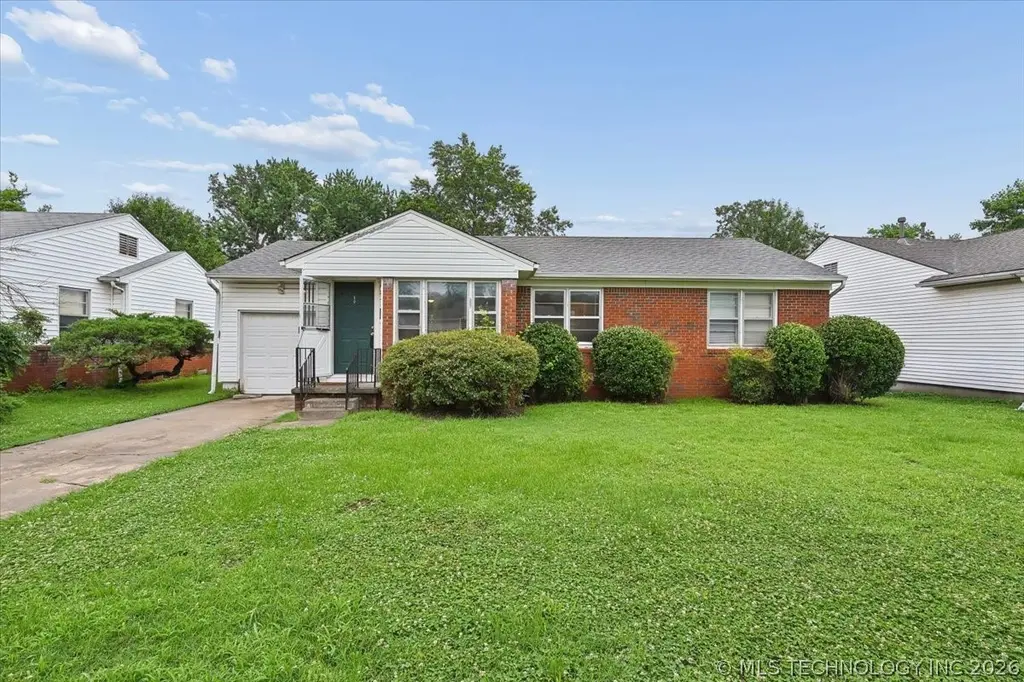
None · Tulsa, OK
Flood risk 4/10 · Minor
- FEMA flood zone
- X (shaded)
- Chance of flooding over 30 yrs
- 0.21%
- Est. flood insurance / yr
- $507 – $1,088
Fire risk 1/10 · Minimal
- Est. fire insurance / yr
- $2,463 – $4,575
Heat risk 7/10 · Major
- Hot days now (above 110°F)
- 7 days/yr
- Hot days in 30 yrs
- 18 days/yr
Wind risk 3/10 · Minor
- Chance of severe wind over 30 yrs
- 4.0%
Air-quality risk 3/10 · Minor
- Unhealthy air days now
- 2 days/yr
- Unhealthy air days in 30 yrs
- 3 days/yr
Risk factors via First Street. Map © Google.
Why this score? — see what drove the D+ grade
The composite is a weighted blend of 9 inputs, each scored 0–100. Each bar is that input's sub-score; the figure is the points it added to the 100-point composite (weight × sub-score).
- Cash flow +15.2/30.0
- ARV discount +13.5/15.0
- DSCR +4.7/10.0
- Livability +3.8/5.0
- 1% rule +3.7/10.0
- Rent growth +3.2/5.0
- Condition / age +2.5/5.0
- Schools +0.8/10.0
- Appreciation +0.0/10.0
$158,900
🖨 Deal sheet (PDF) 📄 Offer letter ✓ Due diligence
Listing remarks MLS
Wonderful home at a great price! This ONE OWNER is move in ready! Maintainence free exterior, new paint & carpet inside, central H & A and great yard will make this house the place to call home.
Key facts
- 8,100 sq ft lot
- Garage
- Built 1951
Property features AI
Finance
- HOA & community: Community features include gutters
Exterior
- Parking: Attached garage (1 car)
- Security: No safety shelter
- Utilities: Electricity available; Natural gas available; Public water; Public sewer
- Home design: Single-story home; South-facing; Crawlspace foundation
- Construction: Built with brick, vinyl siding, and wood frame; Asphalt/fiberglass roof
- Exterior features: Covered patio and porch; Patio; Porch; Rain gutters; Full yard fencing
Interior
- Kitchen: Dishwasher; Oven; Range; Stove; Refrigerator
- Bedrooms: Three first-floor bedrooms; Master bedroom on the first floor
- Flooring: Carpet; Hardwood; Vinyl
- Bathrooms: One full bathroom
- Heating & cooling: Central heating (gas); Central air conditioning
- Interior features: Wood window frames with storm windows; Storm door(s); Laminate countertops; Electric oven and range connections; No additional interior safety shelter listed
- Laundry & utility: Washer hookup; Electric dryer hookup; Utility room (first floor, adjacent to garage)
Neighborhood map
What this means for you Summary
Snapshot
- This is a 3-bed/1.0-bath single-family listed at $159k.
Deal economics
- At list price, monthly cash flow is $57 ($678/yr) — positive.
- The deal already cash-flows at list — no discount required.
- To meet the 1% rule (rent ≥ 1% of price), the offer needs to be $137k (13.5% below list).
- Recommended offer: $137k (13.5% below list) — sets the bar for 1% rule.
- Cap rate 6.7% vs local median 3.8% in Tulsa — top-decile yield for the area; either an underpriced asset or a hidden risk that comps aren't pricing in. Stress-test before assuming the spread holds.
Location & tenants
- Location reads 75/100 on livability (#13 in OK, #4,058 nationally) — a middle-class / working-renter tenant base. Strengths: amenities A+, commute A+, cost of living A+; Watch: crime F, employment D-.
- Tulsa (urban): math 7% / reading 12% proficiency, ranked #250 of 270 in OK (top 93%) — low school quality limits family demand, transient renter base, plan for 1-2y turnover; 76% free/reduced lunch — lower-income household profile, screen leases tightly.
- Zoned schools: Project Accept Traice Es (math 10% / reading 10%, grade F, #695 of 845 statewide, top 84%, 558 students, 0% FRL); Monroe Demonstration Ms (math 0% / reading 2%, grade F, #344 of 345 statewide, top 100%, 688 students, 0% FRL); Booker T. Washington Hs (math 41% / reading 61%, grade D+, #2 of 447 statewide, top 0%, 1,280 students, 0% FRL) — zoned schools average 0% FRL vs 76% district-wide (76 pts lower); this property's tenant base skews higher-income than the district average.
- Market conditions: Rents rising (+2.8%/yr); 226 active listings in the ZIP; 28 comparable units currently listed for rent nearby; rentals leasing fast (median 5d on market — plan ~1-2 weeks tenant-placement turnaround); 2,818 units permitted in Tulsa County in 2024 (518 in 5+ unit buildings).
Forward outlook
- Local home prices are declining (-3.0%/yr); year-one equity from $1k of loan paydown is wiped out by about $5k of value loss. Plan a longer hold.
- Tulsa County population projected at +30% by 2050 — long-run rental-demand tailwind backs the buy-and-hold thesis.
Negotiation context
- Only 6 days on market — expect competitive offers; lowballing is unlikely to land.
- 2 sale attempts since 19y ago with the ask held roughly flat each time — persistent listings suggest the price (not the market) is what's stuck; bring a comps-based counter.
- Current owner paid $85k; list at $159k implies a 87% gain — meaningful room to come down on a strong offer.
Risks & watch-outs
- Watch-outs: built in 1951 — expect roof / HVAC / electrical / plumbing capex.
- Climate carrying-cost: extreme-heat days projected 7→18/yr by 2055 (HVAC capex compounding) — expect insurance premiums to compound above CPI over the hold.
Questions for the listing agent
- Built in 1951 — when were the roof, HVAC, electrical panel, plumbing, and water heater last replaced?
- Is there a deadline driving the sale (1031 exchange, divorce, estate, relocation)? That informs how much negotiation room exists.
- Schools are F-rated, which usually means shorter tenancies and higher turnover. Who's the typical renter profile here, and what's been the actual vacancy rate?
- Crime grade is F in this area — have there been break-ins, vandalism, or insurance claims at this property in the last 3 years? What carrier currently insures it and at what premium?
- The area grade is low — what's the realistic commute time and amenity access for the typical tenant pool here? Any planned neighborhood developments (good or bad) we should know about?
- What's the average days-on-market for RENTAL listings here right now (not sales)? A rising rental-DOM trend means longer vacancies and softer asking-rent achievability than the comps imply.
- What's the recent tenant-quality profile in this submarket — average credit score on applications, eviction rate, late-payment / NSF rate, and stable-employment percentage? A property-management company in the area should have these aggregated.
- How much new for-sale + rental construction is in the pipeline within 1–3 miles? Heavy new supply typically softens prices + rents 12–24 months out; constrained supply supports both.
Investment metrics
- 1% rule
- 0.87% ✗
- Cap rate
- 6.72%
- Cash-on-cash
- 1.52%
- DSCR
- 1.07
- GRM
- 9.6
CMA / ARV
- ARV (on-the-fly)
- $183,120
- Comps found
- 12
Show comp detail 12 sales within ~0.75 mi
| Address | Dist | Beds/Ba | Sqft | Sold | Price | $/sf | Match |
|---|---|---|---|---|---|---|---|
| 1538 E 53rd St | 0.11mi | 3/1.0 | 1,182 (+8%) | 0mo | $195,000 | $165 | 80 |
| 1414 E 52nd St | 0.12mi | 2/1.0 (-1) | 1,014 (-7%) | 3mo | $142,000 | $140 | 76 |
| 5249 S St Louis Ave | 0.12mi | 2/1.0 (-1) | 1,011 (-7%) | 3mo | $118,000 | $117 | 75 |
| 1403 E 52nd St | 0.15mi | 2/1.0 (-1) | 997 (-8%) | 1mo | $167,000 | $168 | 73 |
| 4685 S Trenton Ave | 0.46mi | 3/1.0 | 1,050 (-4%) | 2mo | $228,000 | $217 | 71 |
| 1527 E 50th St | 0.27mi | 3/1.5 | 1,182 (+8%) | 2mo | $243,000 | $206 | 70 |
| 5140 S Troost Ave | 0.18mi | 3/1.0 | 1,220 (+12%) | 2mo | $150,000 | $123 | 70 |
| 1403 E 49th Pl | 0.32mi | 2/1.5 (-1) | 1,175 (+8%) | 1mo | $205,000 | $174 | 64 |
| 5320 S Quincy Ave | 0.21mi | 2/1.0 (-1) | 1,220 (+12%) | 3mo | $133,000 | $109 | 63 |
| 4937 S Cincinnati Ave | 0.65mi | 3/1.0 | 1,011 (-7%) | 1mo | $220,000 | $218 | 57 |
| 4629 S Trenton Ave | 0.59mi | 2/1.0 (-1) | 996 (-9%) | 1mo | $136,000 | $137 | 52 |
| 5530 S Boston Pl | 0.73mi | 3/1.0 | 928 (-15%) | 2mo | $158,200 | $170 | 39 |
Match score weights: distance 35% · size 25% · config 20% · recency 20%. Top-matched comps best support the ARV.
Projected returns pro-forma
-3.0% appreciation · 2.83% rent growth · sell at horizon
- IRR
- -14.1%
- Equity multiple
- 0.50×
- Total profit
- $-22,404
- Equity at exit
- $23,693
- IRR
- -5.6%
- Equity multiple
- 0.64×
- Total profit
- $-15,920
- Equity at exit
- $13,739
Cash invested: $44,492 (down + closing). Projections, not guarantees.
Landlord ↔ Tenant lean methodology
- Overall (STATE)
- 83 Strongly Landlord-Friendly
- State Oklahoma
- 83 Strongly Landlord-Friendly · R+20
- County
- — inherits STATE
- City
- — inherits STATE
ZIP-level market 74105
- Rents YoY
- 2.8%
- Active inventory
- 226
- Price-to-rent
- 9.6×
Monthly cashflow live
- Estimated rent
- $1,375 high interval (Pro) →
- Mortgage (P&I)
- −$833
- Tax from tax record
- −$130 /mo · $1,559/yr
- Insurance
- −$66
- HOA
- −$0
- Vacancy / Maint / Mgmt
- −$289
- Net cashflow
- $57
Break-even live
Sensitivity live
| Price | -10% $146 | -5% $102 | +0% $57 | +5% $12 | +10% $-33 |
|---|---|---|---|---|---|
| Rent | -10% $-52 | -5% $2 | +0% $57 | +5% $111 | +10% $165 |
| Rate | -1.0pp $137 | -0.5pp $97 | base $57 | +0.5pp $15 | +1.0pp $-27 |
UW: 25.0% down · 7.5% · 30yr · 1.5% tax · 5.0% vac · 8.0% maint · 8.0% mgmt
Financing live
Cash to close
- Down payment
- $39,725
- Closing costs
- $4,767
- Reserves months
- —
- Total cash needed
- —
Loan-product check · same deal, 3 products live
Conventional
25% down · 7.5% · 30yr
- Down + closing
- —
- Monthly P&I
- —
- Monthly cashflow
- —
- DSCR
- —
- Eligible?
- —
Personal DTI + credit; lowest rate.
DSCR
20% down · 8.5% · 30yr
- Down + closing
- —
- Monthly P&I
- —
- Monthly cashflow
- —
- DSCR
- —
- Eligible?
- —
No personal income docs; deal must DSCR.
Hard money
10% down · 12.0% · 12mo
- Down + closing
- —
- Monthly P&I
- —
- Monthly cashflow
- —
- DSCR
- —
- Eligible?
- —
Short-term bridge; refi at stabilization.
Rent comps 28 comps
| Address | Beds | Baths | Sqft | Rent | $/sqft | DOM | Units | Dist |
|---|---|---|---|---|---|---|---|---|
| 5151 S Utica Ave Tulsa, OK | 1.0–2.0 | 1.0 | 799 | $838 | $1.05 | 3d | 1 | 0.27mi |
| 5009 S Troost Ave Tulsa, OK | 2.0 | 1.0 | 886 | $1,400 | $1.58 | 25d | 1 | 0.29mi |
| 1514 E 49th St Tulsa, OK | 3.0 | 1.0 | 980 | $1,295 | $1.32 | 18d | 1 | 0.33mi |
| 5101 S Madison Ave Tulsa, OK | 1.0–2.0 | 1.0 | 780 | $1,150 | $1.47 | 3d | 2 | 0.43mi |
| 4849 S Victor Ave Tulsa, OK | 1.0–2.0 | 1.0–2.0 | 775 | $1,100 | $1.42 | 18d | 6 | 0.43mi |
| 4676 S Saint Louis Ave Tulsa, OK | 3.0 | 1.0 | 1012 | $1,475 | $1.46 | 25d | 1 | 0.44mi |
| 5607 S Quaker Ave Unit 5607D-Q Tulsa, OK | 2.0 | 2.0 | 950 | $1,100 | $1.16 | 5d | 1 | 0.46mi |
| 5121 S Madison Ave Tulsa, OK | 3.0 | 1.5 | 1048 | $1,550 | $1.48 | 13d | 1 | 0.48mi |
| 2102 E 51st St Tulsa, OK | 1.0–2.0 | 1.0–2.0 | 700 | $725 | $1.04 | 3d | 15 | 0.55mi |
| 1115 E 48th Pl Tulsa, OK | 3.0 | 1.5 | 1195 | $1,500 | $1.26 | 25d | 1 | 0.56mi |
| 5624 S Peoria Ave Unit 5624C-P Tulsa, OK | 2.0 | 1.0 | 850 | $1,000 | $1.18 | 5d | 1 | 0.58mi |
| 5628 S Peoria Ave Unit 5628A-P Tulsa, OK | 2.0 | 2.0 | 950 | $1,100 | $1.16 | 5d | 1 | 0.60mi |
| 1348 E 45th Pl Tulsa, OK | 3.0 | 1.5 | 1281 | $1,675 | $1.31 | 25d | 1 | 0.66mi |
| 5270 S Lewis Ave Tulsa, OK | 2.0 | 2.0 | 1050 | $950 | $0.90 | 25d | 8 | 0.68mi |
| 1337 E 61st St Tulsa, OK | 1.0–2.0 | 1.0 | 700 | $1,051 | $1.50 | 5d | 14 | 0.80mi |
| 4740 S Boston Ave Tulsa, OK | 2.0 | 1.0 | 839 | $1,475 | $1.76 | 4d | 1 | 0.84mi |
| 1110 E 60th St Tulsa, OK | 1.0–2.0 | 1.0–2.0 | 794 | $1,069 | $1.35 | 5d | 4 | 0.87mi |
| 6105 S Troost Ave Tulsa, OK | 2.0 | 2.0 | 1124 | $1,300 | $1.16 | 25d | 1 | 0.92mi |
| 2218 E 59th St Tulsa, OK | 1.0–2.0 | 1.0 | 787 | $1,199 | $1.52 | 5d | 4 | 0.96mi |
| 6135 S Troost Ave Unit 6135 Tulsa, OK | 2.0 | 2.0 | 1150 | $1,125 | $0.98 | 25d | 1 | 1.00mi |
| 1419 E 42nd St Tulsa, OK | 2.0 | 1.0 | 850 | $1,395 | $1.64 | 5d | 1 | 1.03mi |
| 6119 S Madison Pl Tulsa, OK | 3.0 | 2.0 | 1214 | $1,550 | $1.28 | 12d | 1 | 1.03mi |
| 6307 S Owasso Ave Unit 6309 Tulsa, OK | 4.0 | 2.0 | 1131 | $1,560 | $1.38 | 3d | 1 | 1.15mi |
| 1414 E 39th St Tulsa, OK | 1.0–2.0 | 1.0–2.0 | 1117 | $2,120 | $1.90 | 3d | 17 | 1.24mi |
| 1027 E 41st St Tulsa, OK | 2.0 | 1.0 | 860 | $1,195 | $1.39 | 5d | 2 | 1.25mi |
| 6345 S Madison Pl Unit 1 Tulsa, OK | 3.0 | 2.0 | 1080 | $1,100 | $1.02 | 5d | 1 | 1.28mi |
| 6642 S Peoria Ave Tulsa, OK | 1.0–2.0 | 1.0 | 712 | $1,100 | $1.54 | 13d | 2 | 1.49mi |
| 1802 E 66th Pl Tulsa, OK | 1.0–2.0 | 1.0–2.0 | 695 | $1,100 | $1.58 | 23d | 3 | 1.49mi |
Listing history 6 events
-
2026-06-22days on market $158,900 Active 6 DOM
-
2026-06-18days on market $158,900 Active 3 DOM
-
2026-06-17days on market $158,900 Active 2 DOM
-
2026-06-15pricestatus $158,900 Active 1 DOM
-
2026-06-08remarks 153-char remark
-
2026-06-08$159,900 Pending 1 DOM
ⓘ Source: listings_history table (triggers on properties + properties_extension) + one-shot
backfill from property_details.listing_events for pre-trigger history.
Tax reassessment forecast OK · Resets to sale price
- Current annual tax
- $1,559 · $130/mo
- Projected year-2 tax
- $1,559 · $130/mo
- Expected delta
- $0/yr ($0/mo · 0.0%)
ⓘ Screening estimate from a state-policy table — verify with the county assessor before closing.
Climate risk First Street
- Flood 4/10 Moderate FEMA zone X (shaded) · 21% chance over 30 yrs
- Wildfire 1/10 Low
- Heat 7/10 Severe 7 d/yr ≥110°F today · 18 d/yr by 30 yrs out
- Wind 3/10 Moderate 4% chance of damaging wind over 30 yrs
- Air quality 3/10 Moderate 2 unhealthy d/yr today · 3 by 30 yrs out
Nearby sold comps map
Loading sold comps map…
Walkable amenities ~0.75 mi
Loading nearby amenities…
Taxation est. · year 1
- Rental income
- $16,495
- − Mortgage interest
- −$8,901
- − Property taxes
- −$1,559
- − Insurance
- −$794
- − Repairs & maintenance
- −$1,320
- − Management
- −$1,320
- − Depreciation
- −$4,623
- Taxable loss
- −$2,021
- Est. tax savings @ 24.0%
- +$485
- After-tax cash flow
- $1,163/yr
For passive investors: Depreciation is non-cash, so a rental often shows a tax loss while cash-flowing — sheltering income. Rental losses are passive: they offset passive income freely, and up to $25,000/yr can offset ordinary (W-2) income if you actively participate and your MAGI is under $100k (phasing out to $0 by $150k); unused losses carry forward. On sale, claimed depreciation is recaptured at up to 25%, and gains may owe capital-gains tax (a 1031 exchange can defer both). Figures are a year-1 estimate at your 24.0% rate — not tax advice; consult a CPA.
Schools (NCES district)
- District
- Tulsa
- NCES district ID
- 4030240
- Math proficiency
- 7% ▼ -9.00%
- Reading proficiency
- 12% ▼ -7.00%
- Median HH income
- $37,895
- Composite
- 8.04/100
- National rank
- #9919
- State rank
- #250 of 270 in OK
Livability — Tulsa
- Score
- 75/100
- State rank
- #13
- US rank
- #4058
Category grades
Schools grade is shown separately in the Schools card above.
Census & demographics
- Census place
- Tulsa, OK
- County
- Tulsa County · 640,811 people
- City population
- 389,418
- Metro
- Tulsa, OK
- Population (ZIP)
- 26,951
- Household income
- $69,547
- Rent vs Own
- Severe rent burden
- 1214.0
Population outlook (Tulsa County) Hauer SSP2
- Today (2025)
- 723,846 people
- By 2030
- 766,033 · +5.8%
- By 2040
- 851,386 · +17.6%
- By 2050
- 938,389 · +29.6%
- By 2075
- 1,166,011 · +61.1%
- By 2100
- 1,350,277 · +86.5%
Race, ethnicity, and origin ACS 2023
- Neighborhood character
- Predominantly White (70%)
- Race & ethnicity
- White 70% Two or more races 12% Black 9% Hispanic / Latino 7% Native American 4% Asian 1%
- Hispanic origin (detail)
- Mexican 4%
- Common ancestry
- Slovak 3% Italian 3% Lithuanian 2%
- Foreign-born
- 4% · Canada, China
- Languages at home
- 94% English-only · Spanish 4%
Political lean MEDSL · Tulsa
- 2024 margin
- R (+15.2) · D 41.3% · R 56.5% · Other 2.2%
- 2008→2024 swing
- +9.2pp toward D · 2008: -24.5pp · 2024: -15.2pp
- All cycles
- 2024: R+15.2 2020: R+15.6 2016: R+22.9 2012: R+27.4 2008: R+24.5
Not yet ingested
- Civics
- —
Market trends
- HPI YoY
- ▼ -305.73%
- Current HPI
- 236.6827
- Rent YoY
- ▲ 2.83%
- Metro
- Tulsa, OK
- State GDP YoY
- ▲ 1.55%
- F500 in state
- 6
Industry mix (Fortune 500 HQ in OK)
| Industry | F500 HQs | Revenue |
|---|---|---|
| Energy | 3 | $48B |
|
||
Price history
+88.1% since first listed6 events — show timeline
- 2026-06-08 Pending — MLS Technology, Inc.
- 2026-06-05 Listed $159,900 MLS Technology, Inc.
- 2007-05-14 Sold (Public Records) $85,000 Public Records
- 2007-05-07 Sold (MLS) $85,000 MLS Technology, Inc.
- 2007-04-10 Listing Removed — MLS Technology, Inc.
- 2007-03-02 Listed $85,000 MLS Technology, Inc.
Property tax history
+2.1%/yrLatest (2025): $1,559 · +8.6% YoY. Source: county tax records.
Cash-flow waterfall
monthlySold comps — $/sqft
last 12 mo · ≤1 miLoading sold comps…