 Duplex
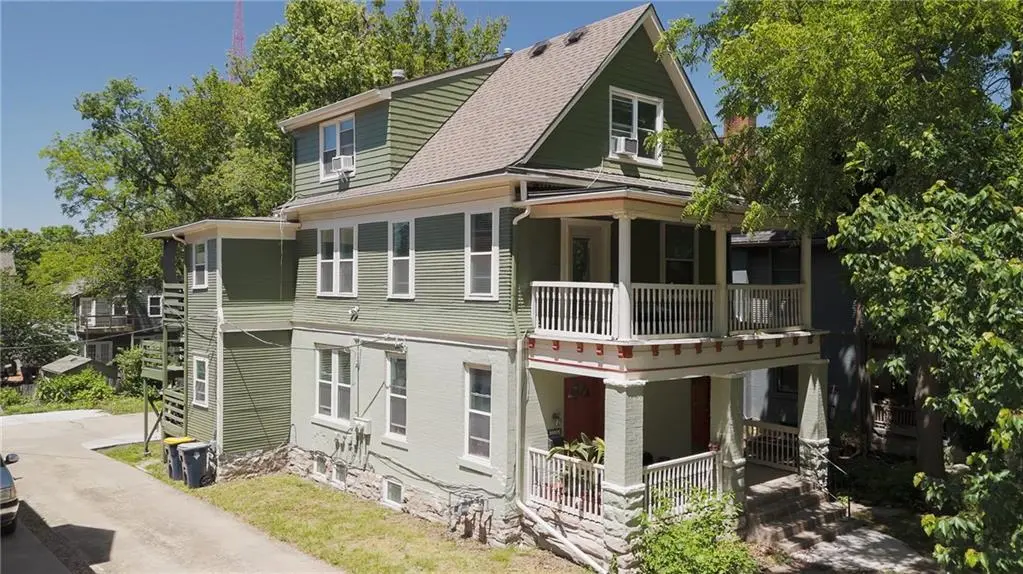
3226 Campbell St · Kansas City, MO
Flood risk 1/10 · Minimal
- FEMA flood zone
- X (unshaded)
- Chance of flooding over 30 yrs
- 0.0%
- Est. flood insurance / yr
- $473 – $860
Fire risk 1/10 · Minimal
- Est. fire insurance / yr
- $1,054 – $1,958
Heat risk 4/10 · Minor
- Hot days now (above 106°F)
- 7 days/yr
- Hot days in 30 yrs
- 16 days/yr
Wind risk 2/10 · Minimal
- Chance of severe wind over 30 yrs
- —
Air-quality risk 3/10 · Minor
- Unhealthy air days now
- 2 days/yr
- Unhealthy air days in 30 yrs
- 3 days/yr
Risk factors via First Street. Map © Google.
Why this score? — see what drove the D grade
The composite is a weighted blend of 9 inputs, each scored 0–100. Each bar is that input's sub-score; the figure is the points it added to the 100-point composite (weight × sub-score).
- ARV discount +15.0/15.0
- Cash flow +10.3/30.0
- Rent growth +4.9/5.0
- Livability +3.9/5.0
- DSCR +2.9/10.0
- 1% rule +2.6/10.0
- Condition / age +2.5/5.0
- Schools +1.5/10.0
- Appreciation +0.0/10.0
$439,000
🖨 Deal sheet (PDF) 📄 Offer letter ✓ Due diligence
Multi-family units
County records classify this as Multi-Family (2-4 Unit). Listing-text estimate: 2 units. confirmed
Listing remarks MLS
Great multifamily property located near North Hyde Park! Private drive with off street parking. Larger upper unit is a 3 bed / 2 bath with living room, dining room, eat-in kitchen, personal laundry room + office/bonus room. Lower unit is a 2 bed / 1 bath unit including a living room, dining room, and personal laundry room. Units are separately metered for electric and gas. Walkable to so many great eateries and bars.
Key facts
- 7,004 sq ft lot
- 4 parking spots
- Built 1895
Property features AI
Exterior
- Parking: Off-street parking for 4 vehicles
- Utilities: Public water; Public sewer
- Home design: Duplex (residential income property); Three-story building
- Construction: Brick construction; Composition roof
- Exterior features: Balcony; Not in a flood plain
Interior
- Kitchen: Both units include a refrigerator and range/oven; 2-bedroom unit also includes a dishwasher
- Bedrooms: One 2-bedroom unit; One 3-bedroom unit
- Bathrooms: One 1-bath unit; One 2-bath unit
- Heating & cooling: Forced air heating; Electric cooling with window unit(s)
- Interior features: Basement present; Separate meters for utilities
- Laundry & utility: Each unit has individual washer and dryer hookups (2-bedroom unit specified with individual washer and dryer); Laundry located inside
Neighborhood map
What this means for you Summary
Snapshot
- This is a 2 × 2-bed/1.5-bath units multifamily listed at $439k.
Deal economics
- At list price, monthly cash flow is $-245 ($-3k/yr) — negative. Per door: $-122/mo.
- To cash-flow at today's rent, offer at most $396k (9.9% below list).
- To meet the 1% rule (rent ≥ 1% of price), the offer needs to be $334k (24.0% below list).
- Recommended offer: $334k (24.0% below list) — sets the bar for 1% rule.
- Cap rate 5.6% vs local median 3.9% in Kansas City — top-decile yield for the area; either an underpriced asset or a hidden risk that comps aren't pricing in. Stress-test before assuming the spread holds.
Location & tenants
- Location reads 78/100 on livability (#28 in MO, #2,671 nationally) — a middle-class / working-renter tenant base. Strengths: amenities A+, commute A+, cost of living A+; Watch: crime F.
- Kansas City 33 (urban): math 12% / reading 24% proficiency, ranked #308 of 324 in MO (top 95%) — low school quality limits family demand, transient renter base, plan for 1-2y turnover; 75% free/reduced lunch — lower-income household profile, screen leases tightly.
- Zoned schools: Ac Prep Elementary (math 12% / reading 27%, grade F, #941 of 1,115 statewide, top 86%, 341 students, 99% FRL); Central Middle School (math 0% / reading 9%, grade F, #388 of 391 statewide, top 99%, 428 students, 99% FRL); Southeast High School (math 2% / reading 12%, grade F, #512 of 521 statewide, top 99%, 487 students, 99% FRL) — zoned schools average 99% FRL vs 75% district-wide (24 pts higher); higher-poverty schools than district average — tighter screening recommended.
- Market conditions: Rents rising fast (+9.5%/yr); 98 active listings in the ZIP; 13 comparable units currently listed for rent nearby; rentals at typical pace (median 26d on market — plan ~3-4 weeks tenant-placement turnaround); lower-income renter base — watch delinquency; 4,002 units permitted in Jackson County in 2024 (2,271 in 5+ unit buildings).
- At $3,336/mo this rent would consume 95% of the median local household income ($42k/yr) (locally 853% of renters already pay >50% of income on rent) — very limited rent-growth headroom before tenants either downsize or default.
Forward outlook
- Local home prices are declining (-3.0%/yr); year-one equity from $3k of loan paydown is wiped out by about $13k of value loss. Plan a longer hold.
- Jackson County population projected at +4% by 2050 — modest demand growth; plan on rents tracking national, not racing it.
Negotiation context
- It's been on market 39 days — a 3% lower offer ($426k) is reasonable based on typical stale-listing flexibility.
- 5 sale attempts since 26y ago with the ask held roughly flat each time — persistent listings suggest the price (not the market) is what's stuck; bring a comps-based counter.
Risks & watch-outs
- Watch-outs: built in 1895 — expect roof / HVAC / electrical / plumbing capex.
Questions for the listing agent
- What do current leases actually rent for vs. the listed asking? Can we see a recent rent roll and the last 12 months of T-12 income?
- It's been on market 39 days. Have you received any prior offers? Is the seller open to a 24% concession, seller financing, or rate buy-down credit?
- Can we see the unit-by-unit rent roll, current vacancy, and any below-market leases? What's the average tenancy length?
- What capital expenditures (roof, boiler, parking lot, exteriors) have been made in the last 5 years, and what's planned in the next 2?
- Built in 1895 — when were the roof, HVAC, electrical panel, plumbing, and water heater last replaced?
- Is there a deadline driving the sale (1031 exchange, divorce, estate, relocation)? That informs how much negotiation room exists.
- Crime grade is F in this area — have there been break-ins, vandalism, or insurance claims at this property in the last 3 years? What carrier currently insures it and at what premium?
- The area grade is low — what's the realistic commute time and amenity access for the typical tenant pool here? Any planned neighborhood developments (good or bad) we should know about?
- What's the average days-on-market for RENTAL listings here right now (not sales)? A rising rental-DOM trend means longer vacancies and softer asking-rent achievability than the comps imply.
- What's the recent tenant-quality profile in this submarket — average credit score on applications, eviction rate, late-payment / NSF rate, and stable-employment percentage? A property-management company in the area should have these aggregated.
- How much new apartment / multifamily construction is in the pipeline within 1–3 miles? Heavy new supply (>2% of stock underway) typically softens rents 12–24 months out; light construction supports rent growth.
Investment metrics
- 1% rule
- 0.76% ✗
- Cap rate
- 5.62%
- Cash-on-cash
- -2.39%
- DSCR
- 0.89
- GRM
- 11.0
CMA / ARV
- ARV (median comp)
- $726,870
- List price
- $439,000
- Delta
- -39.60%
- Verdict
- UNDERPRICED
- Comps
- 20 within 1.0 mi
Projected returns pro-forma
-3.0% appreciation · 8.0% rent growth · sell at horizon
- IRR
- -15.1%
- Equity multiple
- 0.44×
- Total profit
- $-69,145
- Equity at exit
- $65,456
- IRR
- -0.0%
- Equity multiple
- 1.00×
- Total profit
- $-228
- Equity at exit
- $37,957
Cash invested: $122,920 (down + closing). Projections, not guarantees.
Landlord ↔ Tenant lean methodology
- Overall (STATE)
- 81 Strongly Landlord-Friendly
- State Missouri
- 81 Strongly Landlord-Friendly · R+10
- County
- — inherits STATE
- City
- — inherits STATE
ZIP-level market 64109
- Rents YoY
- 9.5%
- Active inventory
- 98
- Price-to-rent
- 21.9×
Monthly cashflow live
- Estimated rent
- $3,336 high interval (Pro) →
- Mortgage (P&I)
- −$2,302
- Tax from tax record
- −$395 /mo · $4,742/yr
- Insurance
- −$183
- HOA
- −$0
- Vacancy / Maint / Mgmt
- −$701
- Net cashflow
- $-245
Break-even live
Sensitivity live
| Price | -10% $4 | -5% $-121 | +0% $-245 | +5% $-369 | +10% $-493 |
|---|---|---|---|---|---|
| Rent | -10% $-508 | -5% $-377 | +0% $-245 | +5% $-113 | +10% $19 |
| Rate | -1.0pp $-24 | -0.5pp $-133 | base $-245 | +0.5pp $-359 | +1.0pp $-474 |
2-unit breakdown (identical units grouped — click to expand)
| Units | Beds | Baths | Est. rent |
|---|---|---|---|
| 2× units | 2 | 1.5 | $3,336 |
| #1 | 2 | 1.5 | $1,668 |
| #2 | 2 | 1.5 | $1,668 |
| Total (2 units) | $3,336 | ||
UW: 25.0% down · 7.5% · 30yr · 1.5% tax · 5.0% vac · 8.0% maint · 8.0% mgmt
Financing live
Cash to close
- Down payment
- $109,750
- Closing costs
- $13,170
- Reserves months
- —
- Total cash needed
- —
Loan-product check · same deal, 3 products live
Conventional
25% down · 7.5% · 30yr
- Down + closing
- —
- Monthly P&I
- —
- Monthly cashflow
- —
- DSCR
- —
- Eligible?
- —
Personal DTI + credit; lowest rate.
DSCR
20% down · 8.5% · 30yr
- Down + closing
- —
- Monthly P&I
- —
- Monthly cashflow
- —
- DSCR
- —
- Eligible?
- —
No personal income docs; deal must DSCR.
Hard money
10% down · 12.0% · 12mo
- Down + closing
- —
- Monthly P&I
- —
- Monthly cashflow
- —
- DSCR
- —
- Eligible?
- —
Short-term bridge; refi at stabilization.
Rent comps 13 comps
| Address | Beds | Baths | Sqft | Rent | $/sqft | DOM | Units | Dist |
|---|---|---|---|---|---|---|---|---|
| 908 E 31st St Kansas City, MO | 5.0 | 1.5 | 2100 | $1,800 | $0.86 | 45d | 1 | 0.21mi |
| 912 E 31st St Kansas City, MO | 5.0 | 1.5 | 2200 | $1,800 | $0.82 | 18d | 1 | 0.21mi |
| 712 E Armour Blvd Kansas City, MO | 4.0 | 3.5 | 4409 | $3,650 | $0.83 | 25d | 1 | 0.30mi |
| 3027 McGee St Kansas City, MO | 4.0 | 3.5 | 3500 | $4,200 | $1.20 | 18d | 1 | 0.42mi |
| 3327 Wyandotte St Kansas City, MO | 5.0 | 2.5 | 2902 | $2,495 | $0.86 | 45d | 1 | 0.68mi |
| 2629 Campbell St Kansas City, MO | 5.0 | 3.0 | 2470 | $3,850 | $1.56 | 14d | 1 | 0.73mi |
| 3839 Harrison Blvd Kansas City, MO | 5.0 | 2.5 | 2709 | $2,950 | $1.09 | 45d | 1 | 0.82mi |
| 3517 Jefferson St Kansas City, MO | 5.0 | 3.5 | 3200 | $3,600 | $1.12 | 18d | 1 | 1.03mi |
| 2436 Forest Ave Kansas City, MO | 5.0 | 4.0 | 2632 | $4,000 | $1.52 | 9d | 1 | 1.03mi |
| 2910 Belleview Ave Kansas City, MO | 4.0 | 2.5 | 2100 | $2,800 | $1.33 | 21d | 1 | 1.26mi |
| 2624 Montgall Ave Kansas City, MO | 4.0 | 3.0 | 3800 | $1,875 | $0.49 | 25d | 1 | 1.44mi |
| 3606 S Benton Ave Kansas City, MO | 5.0 | 3.0 | 2800 | $2,000 | $0.71 | 45d | 1 | 1.44mi |
| 3317 Agnes Ave Kansas City, MO | 5.0 | 2.0 | 2872 | $1,795 | $0.62 | 25d | 1 | 1.45mi |
Listing history 30 events
-
2026-06-21days on market $439,000 Active 39 DOM
-
2026-06-18days on market $439,000 Active 36 DOM
-
2026-06-17days on market $439,000 Active 35 DOM
-
2026-06-16days on market $439,000 Active 34 DOM
-
2026-06-15days on market $439,000 Active 33 DOM
-
2026-06-13days on market $439,000 Active 31 DOM
-
2026-06-09days on market $439,000 Active 27 DOM
-
2026-06-08days on market $439,000 Active 26 DOM
-
2026-06-07days on market $439,000 Active 25 DOM
-
2026-06-05days on market $439,000 Active 22 DOM
-
2026-06-03days on market $439,000 Active 21 DOM
-
2026-06-02days on market $439,000 Active 20 DOM
-
2026-06-01days on market $439,000 Active 19 DOM
-
2026-05-31days on market $439,000 Active 18 DOM
-
2026-05-14$439,000 Active 928-char remark
-
2026-04-28historical $439,000 928-char remark
-
2025-07-06historical $1,850
-
2025-06-22$1,850
-
2023-03-30soldstatus
-
2023-03-29soldstatus Closed 420-char remark
Show marketing remark (420 chars)
Great multifamily property located near North Hyde Park! Private drive with off street parking. Larger upper unit is a 3 bed / 2 bath with living room, dining room, eat-in kitchen, personal laundry room + office/bonus room. Lower unit is a 2 bed / 1 bath unit including a living room, dining room, and personal laundry room. Units are separately metered for electric and gas. Walkable to so many great eateries and bars.
-
2023-02-26status Pending 420-char remark
Show marketing remark (420 chars)
Great multifamily property located near North Hyde Park! Private drive with off street parking. Larger upper unit is a 3 bed / 2 bath with living room, dining room, eat-in kitchen, personal laundry room + office/bonus room. Lower unit is a 2 bed / 1 bath unit including a living room, dining room, and personal laundry room. Units are separately metered for electric and gas. Walkable to so many great eateries and bars.
-
2023-02-21$299,000 Active 420-char remark
Show marketing remark (420 chars)
Great multifamily property located near North Hyde Park! Private drive with off street parking. Larger upper unit is a 3 bed / 2 bath with living room, dining room, eat-in kitchen, personal laundry room + office/bonus room. Lower unit is a 2 bed / 1 bath unit including a living room, dining room, and personal laundry room. Units are separately metered for electric and gas. Walkable to so many great eateries and bars.
-
2013-05-03soldstatus
-
2013-04-24soldstatus
Show marketing remark (316 chars)
Spacious duplex located in Hyde Park. New Roof and Gutters. New interior paint. Large closets. Move in Condition. Lots of off street parking. Selling "As Is". Inspections are for Buyer’s information only. No Seller's Disclosure. Proof of funds or preapproval letter must be submitted with all offers.
-
2012-11-06$75,000
Show marketing remark (316 chars)
Spacious duplex located in Hyde Park. New Roof and Gutters. New interior paint. Large closets. Move in Condition. Lots of off street parking. Selling "As Is". Inspections are for Buyer’s information only. No Seller's Disclosure. Proof of funds or preapproval letter must be submitted with all offers.
-
2006-10-27soldstatus
-
2000-07-05soldstatus
-
2000-06-30soldstatus
-
2000-03-03$69,900
-
1998-01-03soldstatus
ⓘ Source: listings_history table (triggers on properties + properties_extension) + one-shot
backfill from property_details.listing_events for pre-trigger history.
Tax reassessment forecast MO · Resets to sale price
- Current annual tax
- $4,742 · $395/mo
- Projected year-2 tax
- $4,742 · $395/mo
- Expected delta
- $0/yr ($0/mo · 0.0%)
ⓘ Screening estimate from a state-policy table — verify with the county assessor before closing.
Climate risk First Street
- Flood 1/10 Low FEMA zone X (unshaded) · 0% chance over 30 yrs
- Wildfire 1/10 Low
- Heat 4/10 Moderate 7 d/yr ≥106°F today · 16 d/yr by 30 yrs out
- Wind 2/10 Low
- Air quality 3/10 Moderate 2 unhealthy d/yr today · 3 by 30 yrs out
Nearby sold comps map
Loading sold comps map…
Walkable amenities ~0.75 mi
Loading nearby amenities…
Taxation est. · year 1
- Rental income
- $40,032
- − Mortgage interest
- −$24,591
- − Property taxes
- −$4,742
- − Insurance
- −$2,195
- − Repairs & maintenance
- −$3,203
- − Management
- −$3,203
- − Depreciation
- −$12,771
- Taxable loss
- −$10,672
- Est. tax savings @ 24.0%
- +$2,561
- After-tax cash flow
- $-377/yr
For passive investors: Depreciation is non-cash, so a rental often shows a tax loss while cash-flowing — sheltering income. Rental losses are passive: they offset passive income freely, and up to $25,000/yr can offset ordinary (W-2) income if you actively participate and your MAGI is under $100k (phasing out to $0 by $150k); unused losses carry forward. On sale, claimed depreciation is recaptured at up to 25%, and gains may owe capital-gains tax (a 1031 exchange can defer both). Figures are a year-1 estimate at your 24.0% rate — not tax advice; consult a CPA.
Schools (NCES district)
- District
- Kansas City 33
- NCES district ID
- 2916400
- Math proficiency
- 12% ▼ -8.00%
- Reading proficiency
- 24% ▬ 0.00%
- Median HH income
- $35,227
- Composite
- 14.8/100
- National rank
- #9387
- State rank
- #308 of 324 in MO
Livability — Kansas City
- Score
- 78/100
- State rank
- #28
- US rank
- #2671
Category grades
Schools grade is shown separately in the Schools card above.
Census & demographics
- Census place
- Kansas City, MO
- County
- Jackson County · 687,798 people
- City population
- 439,467
- Metro
- Kansas City, MO-KS
- Population (ZIP)
- 10,043
- Household income
- $41,943
- Rent vs Own
- Severe rent burden
- 853.0
Population outlook (Jackson County) Hauer SSP2
- Today (2025)
- 719,589 people
- By 2030
- 731,456 · +1.6%
- By 2040
- 746,689 · +3.8%
- By 2050
- 749,289 · +4.1%
- By 2075
- 736,227 · +2.3%
- By 2100
- 668,210 · -7.1%
Race, ethnicity, and origin ACS 2023
- Neighborhood character
- Diverse neighborhood (Simpson 0.64)
- Race & ethnicity
- Black 45% White 39% Hispanic / Latino 9% Two or more races 4% Asian 2%
- Hispanic origin (detail)
- Mexican 7%
- Common ancestry
- Slovak 1% Romanian 1% Lithuanian 1%
- Foreign-born
- 7% · Canada, Philippines, China
- Languages at home
- 88% English-only · Spanish 5% Other Asian/Pacific 3% Arabic 1%
Political lean MEDSL · Jackson
- 2024 margin
- D (+19.3) · D 58.9% · R 39.5% · Other 1.6%
- 2008→2024 swing
- -6.1pp toward R · 2008: 25.4pp · 2024: 19.3pp
- All cycles
- 2024: D+19.3 2020: D+22.0 2016: D+16.6 2012: D+19.0 2008: D+25.4
Not yet ingested
- Civics
- —
Market trends
- HPI YoY
- ▼ -275.12%
- Current HPI
- 243.6094
- Rent YoY
- ▲ 9.50%
- Metro
- Kansas City, MO-KS
- State GDP YoY
- ▲ 1.84%
- F500 in state
- 20
Industry mix (Fortune 500 HQ in MO)
| Industry | F500 HQs | Revenue |
|---|---|---|
| Healthcare | 1 | $163B |
|
||
| Insurance | 1 | $21B |
|
||
| Industrial Technology | 1 | $17B |
|
||
| Retail | 1 | $16B |
|
||
| Industrial Distribution | 1 | $10B |
|
||
| Utilities | 1 | $9B |
|
||
Price history
+528.0% since first listed16 events — show timeline
- 2026-05-14 Listed $439,000 Heartland MLS as Distributed by MLS Grid
- 2026-04-28 Coming Soon $439,000 Heartland MLS as Distributed by MLS Grid
- 2025-07-06 Rental Removed $1,850 RenterWarehouse
- 2025-06-22 Listed for Rent $1,850 RenterWarehouse
- 2023-03-30 Sold (Public Records) — Public Records
- 2023-03-29 Sold (MLS) — Heartland MLS as Distributed by MLS Grid
- 2023-02-26 Pending — Heartland MLS as Distributed by MLS Grid
- 2023-02-21 Listed $299,000 Heartland MLS as Distributed by MLS Grid
- 2013-05-03 Sold (Public Records) — Public Records
- 2013-04-24 Sold (MLS) — Heartland MLS as Distributed by MLS Grid
- 2012-11-06 Listed $75,000 Heartland MLS as Distributed by MLS Grid
- 2006-10-27 Sold (Public Records) — Public Records
- 2000-07-05 Sold (Public Records) — Public Records
- 2000-06-30 Sold (MLS) — Heartland MLS as Distributed by MLS Grid
- 2000-03-03 Listed $69,900 Heartland MLS as Distributed by MLS Grid
- 1998-01-03 Sold (Public Records) — Public Records
Property tax history
+14.5%/yrLatest (2025): $4,742 · -4.6% YoY. Source: county tax records.
Cash-flow waterfall
monthlySold comps — $/sqft
last 12 mo · ≤1 miLoading sold comps…