4020 Katanga Dr N · Jacksonville, FL
Flood risk 1/10 · Minimal
- FEMA flood zone
- X (unshaded)
- Chance of flooding over 30 yrs
- 0.0%
- Est. flood insurance / yr
- $507 – $1,088
Fire risk 2/10 · Minimal
- Est. fire insurance / yr
- $947 – $1,759
Heat risk 9/10 · Severe
- Hot days now (above 107°F)
- 7 days/yr
- Hot days in 30 yrs
- 20 days/yr
Wind risk 9/10 · Severe
- Chance of severe wind over 30 yrs
- 99.0%
Air-quality risk 4/10 · Minor
- Unhealthy air days now
- 6 days/yr
- Unhealthy air days in 30 yrs
- 6 days/yr
Risk factors via First Street. Map © Google.
Why this score? — see what drove the B- grade
The composite is a weighted blend of 9 inputs, each scored 0–100. Each bar is that input's sub-score; the figure is the points it added to the 100-point composite (weight × sub-score).
- Cash flow +26.8/30.0
- ARV discount +12.0/15.0
- DSCR +9.2/10.0
- 1% rule +7.9/10.0
- Livability +4.2/5.0
- Schools +3.9/10.0
- Rent growth +3.0/5.0
- Condition / age +2.5/5.0
- Appreciation +0.0/10.0
$89,000
🖨 Deal sheet 📄 Offer letter ✓ Due diligence
Listing remarks
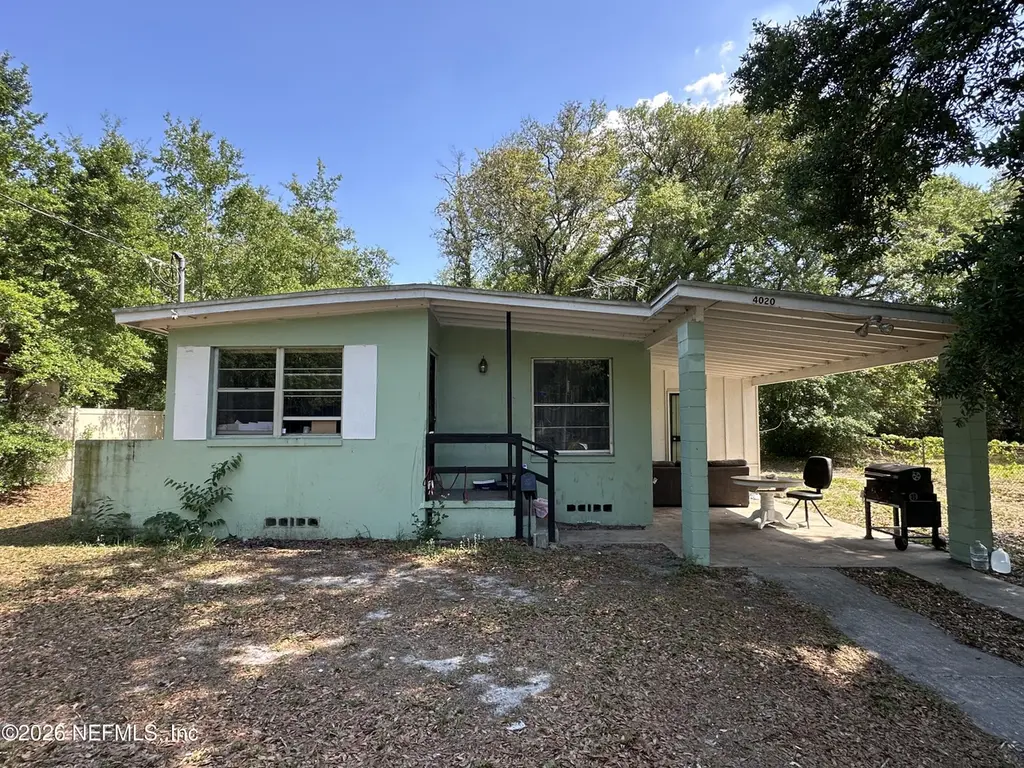
Opportunity is knocking in Cleveland Heights! This cozy 2-bedroom, 1-bath block home offers 876 sq ft of potential and is ready for your personal touch. Built in 1961, this property is the perfect canvas for investors, flippers, or buyers looking to create their dream home from the ground up. Solid block construction provides a strong foundation, while city water and sewer add everyday convenience. With a functional layout and great bones, this fixer-upper is brimming with possibilities--update, redesign, and bring your vision to life! Whether you're looking to renovate and resell or customize a cozy residence, this is your chance to unlock value in a desirable neighborhood. Don't miss out
Key facts
- Block home
- City water and sewer
- Functional layout
Tags
Property features AI
Finance
- HOA & community: Not a senior community
Exterior
- Parking: Attached carport (1 space); Off-street parking; On-street parking
- Utilities: Public sewer; Electricity connected; Sewer connected; Water connected
- Home design: Single family residence; One story; Entry level: 1
- Construction: Block construction; Tar/gravel roof
- Exterior features: Chain link fencing; City street frontage with asphalt road
Interior
- Kitchen: No built-in appliances included
- Bedrooms: 2 bedrooms
- Flooring: Vinyl flooring; Wood flooring
- Bathrooms: 1 full bathroom
- Heating & cooling: Central heating (electric); Electric cooling and wall/window unit(s)
- Interior features: Eat-in kitchen; Primary bathroom with tub and shower
- Laundry & utility: Washer hookup in unit; Electric dryer hookup
Neighborhood map
What this means for you Summary
Snapshot
- This is a 2-bed/1.0-bath single-family listed at $89k.
Deal economics
- At list price, monthly cash flow is $244 ($3k/yr) — positive.
- The deal already cash-flows at list — no discount required.
- Meets the 1% rule at list price ($1k rent vs $89k).
- Recommended offer: $86k (3.0% below list) — sets the bar for market timing.
- Cap rate 9.6% vs local median 4.0% in Jacksonville — top-decile yield for the area; either an underpriced asset or a hidden risk that comps aren't pricing in. Stress-test before assuming the spread holds.
Location & tenants
- Location reads 83/100 on livability (#50 in FL, #911 nationally) — a professional / high-income tenant draw. Strengths: amenities A+, commute A+, housing A+.
- Duval (urban): math 46% / reading 45% proficiency, ranked #48 of 73 in FL (top 66%) — families likely to look elsewhere, expect single-tenant / working-renter base with shorter leases.
- Market conditions: Rents rising (+1.8%/yr); 394 active listings in the ZIP; 33 comparable units currently listed for rent nearby; rentals at typical pace (median 24d on market — plan ~3-4 weeks tenant-placement turnaround); lower-income renter base — watch delinquency; 6,503 units permitted in Duval County in 2024 (1,131 in 5+ unit buildings).
- At $1,150/mo this rent would consume 45% of the median local household income ($31k/yr) (locally 2921% of renters already pay >50% of income on rent) — very limited rent-growth headroom before tenants either downsize or default.
Forward outlook
- Local home prices are declining (-3.0%/yr); year-one equity from $615 of loan paydown is wiped out by about $3k of value loss. Plan a longer hold.
- Duval County population projected at +19% by 2050 — long-run rental-demand tailwind backs the buy-and-hold thesis.
Negotiation context
- It's been on market 39 days — a 3% lower offer ($86k) is reasonable based on typical stale-listing flexibility.
Risks & watch-outs
- Climate carrying-cost: severe wind risk, 99% chance of damaging wind over 30y; extreme-heat days projected 7→20/yr by 2055 (HVAC capex compounding) — expect insurance premiums to compound above CPI over the hold.
Questions for the listing agent
- It's been on market 39 days. Have you received any prior offers? Is the seller open to a 3% concession, seller financing, or rate buy-down credit?
- Built in 1961 — when were the roof, HVAC, electrical panel, plumbing, and water heater last replaced?
- Is there a deadline driving the sale (1031 exchange, divorce, estate, relocation)? That informs how much negotiation room exists.
- Schools are B-rated — typically a magnet for longer-tenancy family renters. What's the average tenant stay here, and is there a school-zone premium baked into asking?
- What's the average days-on-market for RENTAL listings here right now (not sales)? A rising rental-DOM trend means longer vacancies and softer asking-rent achievability than the comps imply.
- What's the recent tenant-quality profile in this submarket — average credit score on applications, eviction rate, late-payment / NSF rate, and stable-employment percentage? A property-management company in the area should have these aggregated.
- How much new for-sale + rental construction is in the pipeline within 1–3 miles? Heavy new supply typically softens prices + rents 12–24 months out; constrained supply supports both.
Investment metrics
- 1% rule
- 1.29% ✓
- Cap rate
- 9.58%
- Cash-on-cash
- 11.76%
- DSCR
- 1.52
- GRM
- 6.4
CMA / ARV
- ARV (on-the-fly)
- $98,988
- Comps found
- 12
Show comp detail 12 sales within ~0.75 mi
| Address | Dist | Beds/Ba | Sqft | Sold | Price | $/sf | Match |
|---|---|---|---|---|---|---|---|
| 4105 Katanga Dr N | 0.05mi | 3/1.0 (+1) | 874 (-0%) | 1mo | $122,500 | $140 | 91 |
| 6151 Ardisia Rd | 0.27mi | 3/1.0 (+1) | 892 (+2%) | 2mo | $128,000 | $143 | 78 |
| 6601 Cleveland Rd | 0.29mi | 3/1.0 (+1) | 896 (+2%) | 2mo | $82,500 | $92 | 76 |
| 6645 Cleveland Rd | 0.33mi | 3/1.0 (+1) | 888 (+1%) | 6mo | $105,000 | $118 | 72 |
| 2736 Lippia Rd | 0.46mi | 3/1.0 (+1) | 856 (-2%) | 0mo | $62,500 | $73 | 69 |
| 2570 Spirea St | 0.40mi | 2/1.0 | 824 (-6%) | 4mo | $90,000 | $109 | 68 |
| 4225 Homer Rd | 0.42mi | 3/1.0 (+1) | 924 (+6%) | 1mo | $104,150 | $113 | 66 |
| 2603 Sunny Acres Dr N | 0.56mi | 3/1.0 (+1) | 854 (-2%) | 4mo | $105,000 | $123 | 61 |
| 3332 Japonica Rd N | 0.54mi | 3/1.0 (+1) | 828 (-6%) | 2mo | $103,500 | $125 | 59 |
| 7203 Ken Knight Dr E | 0.74mi | 2/1.0 | 950 (+8%) | 3mo | $38,000 | $40 | 49 |
| 7142 Ken Knight Dr E | 0.72mi | 2/1.0 | 950 (+8%) | 6mo | $85,000 | $89 | 47 |
| 5638 Vernon Rd | 0.65mi | 3/1.0 (+1) | 963 (+10%) | 2mo | $99,000 | $103 | 46 |
Match score weights: distance 35% · size 25% · config 20% · recency 20%. Top-matched comps best support the ARV.
Projected returns pro-forma
-3.0% appreciation · 1.81% rent growth · sell at horizon
- IRR
- -0.2%
- Equity multiple
- 0.99×
- Total profit
- $-185
- Equity at exit
- $13,270
- IRR
- 8.2%
- Equity multiple
- 1.59×
- Total profit
- $14,602
- Equity at exit
- $7,695
Cash invested: $24,920 (down + closing). Projections, not guarantees.
Landlord ↔ Tenant lean methodology
- Overall (STATE)
- 87 Strongly Landlord-Friendly
- State Florida
- 87 Strongly Landlord-Friendly · R+3
- County
- — inherits STATE
- City
- — inherits STATE
ZIP-level market 32209
- Home prices YoY
- -22.1%
- Rents YoY
- 1.8%
- Active inventory
- 394
- Price-to-rent
- 6.4×
Monthly cashflow live
- Estimated rent
- $1,150 high interval (Pro) →
- Mortgage (P&I)
- −$467
- Tax from tax record
- −$161 /mo · $1,929/yr
- Insurance
- −$37
- HOA
- −$0
- Vacancy / Maint / Mgmt
- −$242
- Net cashflow
- $244
Break-even live
UW: 25.0% down · 7.5% · 30yr · 1.5% tax · 5.0% vac · 8.0% maint · 8.0% mgmt
Financing live
Cash to close
- Down payment
- $22,250
- Closing costs
- $2,670
- Reserves months
- —
- Total cash needed
- —
Loan-product check · same deal, 3 products live
Conventional
25% down · 7.5% · 30yr
- Down + closing
- —
- Monthly P&I
- —
- Monthly cashflow
- —
- DSCR
- —
- Eligible?
- —
Personal DTI + credit; lowest rate.
DSCR
20% down · 8.5% · 30yr
- Down + closing
- —
- Monthly P&I
- —
- Monthly cashflow
- —
- DSCR
- —
- Eligible?
- —
No personal income docs; deal must DSCR.
Hard money
10% down · 12.0% · 12mo
- Down + closing
- —
- Monthly P&I
- —
- Monthly cashflow
- —
- DSCR
- —
- Eligible?
- —
Short-term bridge; refi at stabilization.
Rent comps 33 comps
| Address | Beds | Baths | Sqft | Rent | $/sqft | DOM | Units | Dist |
|---|---|---|---|---|---|---|---|---|
| 4144 Katanga Dr N Jacksonville, FL | 3.0 | 1.0 | 1114 | $1,095 | $0.98 | 23d | 1 | 0.09mi |
| 4294 Katanga Dr N Jacksonville, FL | 3.0 | 1.0 | 864 | $1,450 | $1.68 | 23d | 1 | 0.25mi |
| 6601 Cleveland Rd Jacksonville, FL | 3.0 | 1.0 | 896 | $1,400 | $1.56 | 23d | 1 | 0.32mi |
| 4236 Homer Rd N Jacksonville, FL | 3.0 | 1.0 | 888 | $1,250 | $1.41 | 11d | 1 | 0.43mi |
| 3997 Leonnie Rd Unit 1 Jacksonville, FL | 2.0 | 1.0 | 840 | $950 | $1.13 | 7d | 1 | 0.50mi |
| 4211 Moncrief Rd W Unit 2 Jacksonville, FL | 2.0 | 1.0 | 840 | $995 | $1.18 | 23d | 1 | 0.51mi |
| 4253 Moncrief Rd W Unit 2 Jacksonville, FL | 2.0 | 1.0 | 840 | $975 | $1.16 | 23d | 1 | 0.58mi |
| 4177 Lorenzo Ct Unit 4 Jacksonville, FL | 2.0 | 1.0 | 840 | $945 | $1.12 | 1d | 1 | 0.62mi |
| 6114 Strawflower Pl Jacksonville, FL | 3.0 | 1.0 | 1030 | $1,200 | $1.17 | 23d | 1 | 0.72mi |
| 4543 Moncrief Rd W Jacksonville, FL | 2.0 | 1.0 | 950 | $1,075 | $1.13 | 7d | 1 | 0.74mi |
| 5531 Agra Ct Jacksonville, FL | 3.0 | 1.0 | 988 | $1,295 | $1.31 | 14d | 1 | 0.74mi |
| 5428 Bunche Dr Jacksonville, FL | 3.0 | 1.0 | 900 | $1,600 | $1.78 | 23d | 1 | 0.75mi |
| 4440 Ken Knight Dr N Jacksonville, FL | 2.0 | 1.0 | 716 | $650 | $0.91 | 14d | 1 | 0.82mi |
| 5326 Mays Dr Jacksonville, FL | 3.0 | 1.0 | 900 | $1,200 | $1.33 | 23d | 1 | 0.83mi |
| 2185 Benedict Rd Jacksonville, FL | 2.0 | 1.0 | 630 | $995 | $1.58 | 23d | 1 | 0.87mi |
| 2185 Benedict Rd Unit 2187 Jacksonville, FL | 2.0 | 1.0 | 630 | $995 | $1.58 | 10d | 1 | 0.87mi |
| 5217 Mays Dr Jacksonville, FL | 3.0 | 1.0 | 900 | $1,250 | $1.39 | 7d | 1 | 0.88mi |
| 4655 Ken Knight Dr N Jacksonville, FL | 2.0 | 1.0 | 646 | $600 | $0.93 | 23d | 1 | 0.90mi |
| 2092 Benedict Rd Jacksonville, FL | 3.0 | 1.0 | 816 | $1,095 | $1.34 | 23d | 1 | 1.01mi |
| 2268 W 44th St Jacksonville, FL | 3.0 | 2.0 | 1077 | $1,440 | $1.34 | 4d | 1 | 1.02mi |
| 5035 Campenella Dr Jacksonville, FL | 3.0 | 1.0 | 875 | $1,095 | $1.25 | 23d | 1 | 1.03mi |
| 5355 New Kings Rd Unit 24 Jacksonville, FL | 1.0 | 1.0 | 600 | $700 | $1.17 | 7d | 1 | 1.09mi |
| 5355 New Kings Rd Unit 21 Jacksonville, FL | 2.0 | 1.0 | 700 | $800 | $1.14 | 4d | 1 | 1.09mi |
| 5306 Paris Ave Jacksonville, FL | 3.0 | 1.0 | 944 | $1,150 | $1.22 | 23d | 1 | 1.11mi |
| 5355 New Kings Rd Unit 10 Jacksonville, FL | 2.0 | 1.0 | 528 | $775 | $1.47 | 23d | 1 | 1.16mi |
| 2221 W 39th St Jacksonville, FL | 2.0 | 1.0 | 675 | $800 | $1.19 | 23d | 1 | 1.21mi |
| 2171 W 40th St Jacksonville, FL | 2.0 | 1.0 | 700 | $950 | $1.36 | 23d | 1 | 1.22mi |
| 2312 Palmdale St Jacksonville, FL | 3.0 | 2.0 | 972 | $1,231 | $1.27 | 23d | 1 | 1.28mi |
| 1959 W 45th St Jacksonville, FL | 2.0 | 1.0 | 895 | $1,245 | $1.39 | 14d | 1 | 1.32mi |
| 6705 Gaspar Cir E Jacksonville, FL | 3.0 | 1.5 | 1116 | $1,254 | $1.12 | 17d | 1 | 1.32mi |
| 2050 W 40th St Jacksonville, FL | 3.0 | 1.0 | 1010 | $1,350 | $1.34 | 16d | 1 | 1.35mi |
| 6718 Gaspar Cir W Jacksonville, FL | 3.0 | 2.0 | 1068 | $1,305 | $1.22 | 23d | 1 | 1.42mi |
| 2540 W 25th St Jacksonville, FL | 3.0 | 1.5 | 854 | $1,295 | $1.52 | 14d | 1 | 1.48mi |
Listing history 4 events
-
2026-05-12price $97,500
-
2026-05-06price $100,000
-
2026-05-01price $105,000
-
2026-04-21$109,000 Active
ⓘ Source: listings_history table (triggers on properties + properties_extension) + one-shot
backfill from property_details.listing_events for pre-trigger history.
Tax reassessment forecast FL · Resets to sale price
- Current annual tax
- $1,929 · $161/mo
- Projected year-2 tax
- $1,929 · $161/mo
- Expected delta
- $0/yr ($0/mo · 0.0%)
ⓘ Screening estimate from a state-policy table — verify with the county assessor before closing.
Climate risk First Street
- Flood 1/10 Low FEMA zone X (unshaded) · 0% chance over 30 yrs
- Wildfire 2/10 Low
- Heat 9/10 Extreme 7 d/yr ≥107°F today · 20 d/yr by 30 yrs out
- Wind 9/10 Extreme 99% chance of damaging wind over 30 yrs
- Air quality 4/10 Moderate 6 unhealthy d/yr today · 6 by 30 yrs out
Nearby sold comps map
Loading sold comps map…
Walkable amenities ~0.75 mi
Loading nearby amenities…
Taxation est. · year 1
- Rental income
- $13,803
- − Mortgage interest
- −$4,985
- − Property taxes
- −$1,929
- − Insurance
- −$445
- − Repairs & maintenance
- −$1,104
- − Management
- −$1,104
- − Depreciation
- −$2,589
- Taxable income
- $1,646
- Est. tax owed @ 24.0%
- −$395
- After-tax cash flow
- $2,535/yr
For passive investors: Depreciation is non-cash, so a rental often shows a tax loss while cash-flowing — sheltering income. Rental losses are passive: they offset passive income freely, and up to $25,000/yr can offset ordinary (W-2) income if you actively participate and your MAGI is under $100k (phasing out to $0 by $150k); unused losses carry forward. On sale, claimed depreciation is recaptured at up to 25%, and gains may owe capital-gains tax (a 1031 exchange can defer both). Figures are a year-1 estimate at your 24.0% rate — not tax advice; consult a CPA.
Schools (NCES district)
- District
- Duval
- NCES district ID
- 1200480
- Math proficiency
- 46% ▼ -11.00%
- Reading proficiency
- 45% ▼ -4.00%
- Median HH income
- $48,987
- Composite
- 38.97/100
- National rank
- #4076
- State rank
- #48 of 73 in FL
Livability — Jacksonville
- Score
- 83/100
- State rank
- #50
- US rank
- #911
Category grades
Schools grade is shown separately in the Schools card above.
Census & demographics
- Census place
- Jacksonville, FL
- County
- Duval County · 1,015,274 people
- City population
- 979,034
- Metro
- Jacksonville, FL
- Population (ZIP)
- 34,657
- Household income
- $30,514
- Rent vs Own
- Severe rent burden
- 2921.0
Population outlook (Duval County) Hauer SSP2
- Today (2025)
- 1,013,010 people
- By 2030
- 1,059,228 · +4.6%
- By 2040
- 1,141,439 · +12.7%
- By 2050
- 1,205,258 · +19.0%
- By 2075
- 1,324,282 · +30.7%
- By 2100
- 1,319,620 · +30.3%
Race, ethnicity, and origin ACS 2023
- Neighborhood character
- Predominantly Black (88%)
- Race & ethnicity
- Black 88% White 5% Hispanic / Latino 5% Two or more races 2%
- Hispanic origin (detail)
- Puerto Rican 3%
- Common ancestry
- Hispanic 1% Romanian 1%
- Foreign-born
- 3% · Canada
- Languages at home
- 95% English-only · Spanish 4% French/Haitian/Cajun 1%
Political lean MEDSL · Duval
- 2024 margin
- Toss-up / Even · D 48.7% · R 50.1% · Other 1.2%
- 2008→2024 swing
- +0.4pp no change · 2008: -1.9pp · 2024: -1.5pp
- All cycles
- 2024: R+1.5 2020: D+3.8 2016: R+1.5 2012: R+3.6 2008: R+1.9
Not yet ingested
- Civics
- —
Market trends
- HPI YoY
- ▼ -53.92%
- Current HPI
- 189.5977
- Rent YoY
- ▲ 1.81%
- Metro
- Jacksonville, FL
- State GDP YoY
- ▲ 3.28%
- F500 in state
- 36
Industry mix (Fortune 500 HQ in FL)
| Industry | F500 HQs | Revenue |
|---|---|---|
| Industrial Technology | 2 | $29B |
|
||
| Insurance | 2 | $17B |
|
||
| Retail | 1 | $60B |
|
||
| Technology Distribution | 1 | $58B |
|
||
| Homebuilding | 1 | $35B |
|
||
| Technology Manufacturing | 1 | $35B |
|
||
Price history
-10.6% since first listed4 events — show timeline
- 2026-05-12 Price Changed $97,500 realMLS
- 2026-05-06 Price Changed $100,000 realMLS
- 2026-05-01 Price Changed $105,000 realMLS
- 2026-04-21 Listed $109,000 realMLS
Property tax history
+17.9%/yrLatest (2025): $1,929 · +15.4% YoY. Source: county tax records.
Cash-flow waterfall
monthlySold comps — $/sqft
last 12 mo · ≤1 miLoading sold comps…