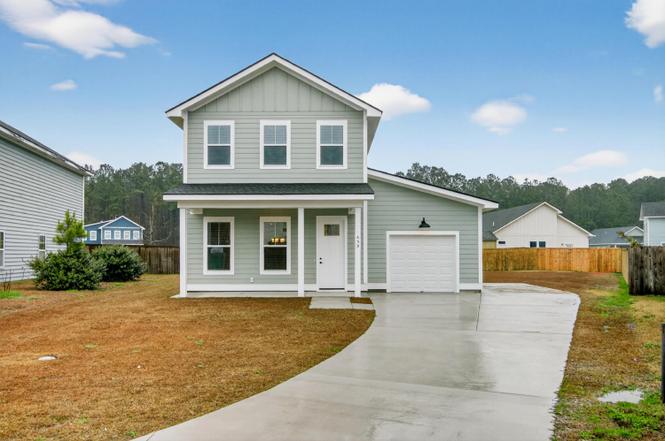
459 Sablewood Dr · Charleston, SC
Flood risk 1/10 · Minimal
- FEMA flood zone
- X (unshaded)
- Chance of flooding over 30 yrs
- 0.0%
- Est. flood insurance / yr
- $507 – $1,088
Fire risk 7/10 · Major
- Est. fire insurance / yr
- $783 – $1,453
Heat risk 9/10 · Severe
- Hot days now (above 108°F)
- 7 days/yr
- Hot days in 30 yrs
- 19 days/yr
Wind risk 8/10 · Major
- Chance of severe wind over 30 yrs
- 96.0%
Air-quality risk 3/10 · Minor
- Unhealthy air days now
- 2 days/yr
- Unhealthy air days in 30 yrs
- 2 days/yr
Risk factors via First Street. Map © Google.
Why this score? — see what drove the C- grade
The composite is a weighted blend of 9 inputs, each scored 0–100. Each bar is that input's sub-score; the figure is the points it added to the 100-point composite (weight × sub-score).
- Cash flow +22.9/30.0
- DSCR +7.3/10.0
- 1% rule +6.1/10.0
- Appreciation +4.4/10.0
- Livability +3.8/5.0
- Schools +3.6/10.0
- Rent growth +2.5/5.0
- Condition / age +2.5/5.0
- ARV discount +0.0/15.0
$489,000
🖨 Deal sheet 📄 Offer letter ✓ Due diligence
Listing remarks
The Laurel is a two story Low country style home with detached garage. It has a front porch for simple gathering. A small foyer is nestled inside with stairway to the upstairs. A spacious downstairs boasts an open floor plan with living, dining and eat in kitchen. Kitchen features 42" hardwood cabinets and granite countertops. French doors lead out to the back patio from the kitchen area. The backyard is between back patio and garage area for close watch of children playing or grilling in the backyard. Upstairs features master bedroom with ensuite and large closet. The two additional bedrooms are jack and jill style sharing a bathroom. Laundry is upstairs for easy access. All bathrooms
Key facts
- Open floor plan
- Jack and jill style
- Front porch
Tags
Property features AI
Finance
- Other: Address: 459 Sablewood Dr, Huger SC 29450; List price available (not included per instructions)
- HOA & community: Association fee approximately $33.35
Exterior
- Parking: 2 parking spaces
- Utilities: Electric heating; Central air conditioning
- Home design: Spec home — Laurel plan; Active listing
- Construction: Living area about 1960; Asphalt roof
- Exterior features: Asphalt roof
Interior
- Kitchen: Dishwasher; Microwave; Refrigerator; Garbage disposal
- Bedrooms: 3 bedrooms
- Bathrooms: 2 full bathrooms, 1 half bathroom
- Heating & cooling: Electric forced-air heating; Central air conditioning; Ceiling fans
- Interior features: Dishwasher; Microwave; Refrigerator; Disposal
Neighborhood map
What this means for you Summary
Snapshot
- This is a 3-bed/2.5-bath single-family listed at $489k.
Deal economics
- At list price, monthly cash flow is $859 ($10k/yr) — positive.
- The deal already cash-flows at list — no discount required.
- Meets the 1% rule at list price ($5k rent vs $489k).
- Recommended offer: $430k (12.0% below list) — sets the bar for market timing.
- Cap rate 8.4% vs local median 2.4% in Charleston — top-decile yield for the area; either an underpriced asset or a hidden risk that comps aren't pricing in. Stress-test before assuming the spread holds.
Location & tenants
- Location reads 76/100 on livability (#22 in SC, #3,336 nationally) — a middle-class / working-renter tenant base. Strengths: amenities A+, housing A+, health & safety A+; Watch: crime D+, commute F, cost of living D-.
- Berkeley 01 (suburban): math 35% / reading 48% proficiency, ranked #30 of 80 in SC (top 38%) — families likely to look elsewhere, expect single-tenant / working-renter base with shorter leases.
- Market conditions: 69 active listings in the ZIP; 3,183 units permitted in Berkeley County in 2024 (580 in 5+ unit buildings).
Forward outlook
- Local home prices are declining (-1.1%/yr); year-one equity from $3k of loan paydown is wiped out by about $5k of value loss. Plan a longer hold.
- Berkeley County population projected at +48% by 2050 — long-run rental-demand tailwind backs the buy-and-hold thesis.
- At projected returns (-1.1% appreciation + 3.0% rent growth), your $137k cash investment doubles in ~9 years — after that, you're playing with house money.
Negotiation context
- It's been on market 272 days — a 12% lower offer ($430k) is reasonable based on typical stale-listing flexibility.
Risks & watch-outs
- Climate carrying-cost: severe wind risk, 96% chance of damaging wind over 30y; major wildfire risk; extreme-heat days projected 7→19/yr by 2055 (HVAC capex compounding) — expect insurance premiums to compound above CPI over the hold.
Questions for the listing agent
- It's been on market 272 days. Have you received any prior offers? Is the seller open to a 12% concession, seller financing, or rate buy-down credit?
- What does the HOA fee cover, when was the last increase, and are there any pending special assessments or reserve-fund shortfalls?
- Why hasn't it sold? Are there any deal-killer items the seller is aware of (foundation, flood, title, zoning, code violations)?
- Is there a deadline driving the sale (1031 exchange, divorce, estate, relocation)? That informs how much negotiation room exists.
- Schools are A-rated — typically a magnet for longer-tenancy family renters. What's the average tenant stay here, and is there a school-zone premium baked into asking?
- Crime grade is D in this area — have there been break-ins, vandalism, or insurance claims at this property in the last 3 years? What carrier currently insures it and at what premium?
- What's the average days-on-market for RENTAL listings here right now (not sales)? A rising rental-DOM trend means longer vacancies and softer asking-rent achievability than the comps imply.
- What's the recent tenant-quality profile in this submarket — average credit score on applications, eviction rate, late-payment / NSF rate, and stable-employment percentage? A property-management company in the area should have these aggregated.
- How much new for-sale + rental construction is in the pipeline within 1–3 miles? Heavy new supply typically softens prices + rents 12–24 months out; constrained supply supports both.
Investment metrics
- 1% rule
- 1.11% ✓
- Cap rate
- 8.40%
- Cash-on-cash
- 7.53%
- DSCR
- 1.33
- GRM
- 7.5
CMA / ARV
- ARV (on-the-fly)
- $417,480
- Comps found
- 12
Show comp detail 12 sales within ~0.75 mi
| Address | Dist | Beds/Ba | Sqft | Sold | Price | $/sf | Match |
|---|---|---|---|---|---|---|---|
| 168 Brightwood Dr | 0.02mi | 3/2.0 | 2,100 (+7%) | 1mo | $390,000 | $186 | 84 |
| 448 Sablewood Dr | 0.06mi | 3/2.5 | 1,838 (-6%) | 3mo | $392,000 | $213 | 84 |
| 447 Sablewood Dr | 0.07mi | 4/2.5 (+1) | 1,828 (-7%) | 5mo | $367,000 | $201 | 77 |
| 420 Sablewood Dr | 0.16mi | 4/2.5 (+1) | 2,083 (+6%) | 2mo | $390,000 | $187 | 75 |
| 149 Brightwood Dr | 0.05mi | 3/2.5 | 1,850 (-6%) | 20mo | $425,000 | $230 | 72 |
| 153 Brightwood Dr | 0.05mi | 4/2.5 (+1) | 1,816 (-7%) | 16mo | $350,000 | $193 | 67 |
| 121 Brightwood Dr | 0.13mi | 3/2.5 | 1,840 (-6%) | 22mo | $403,000 | $219 | 66 |
| 434 Sablewood Dr | 0.14mi | 3/2.5 | 2,100 (+7%) | 23mo | $345,000 | $164 | 63 |
| 104 Brightwood Dr | 0.20mi | 3/2.5 | 2,200 (+12%) | 10mo | $489,000 | $222 | 62 |
| 454 Sablewood Dr | 0.04mi | 3/2.5 | 2,200 (+12%) | 20mo | $439,000 | $200 | 61 |
| 427 Sablewood Dr | 0.17mi | 4/2.5 (+1) | 1,718 (-12%) | 16mo | $375,000 | $218 | 54 |
| 436 Sablewood Dr | 0.13mi | 3/2.0 | 1,702 (-13%) | 23mo | $391,000 | $230 | 51 |
Match score weights: distance 35% · size 25% · config 20% · recency 20%. Top-matched comps best support the ARV.
Projected returns pro-forma
-1.12% appreciation · 3.0% rent growth · sell at horizon
- IRR
- 2.6%
- Equity multiple
- 1.11×
- Total profit
- $15,431
- Equity at exit
- $115,316
- IRR
- 9.2%
- Equity multiple
- 1.89×
- Total profit
- $121,502
- Equity at exit
- $118,785
Cash invested: $136,920 (down + closing). Projections, not guarantees.
Landlord ↔ Tenant lean methodology
- Overall (STATE)
- 90 Strongly Landlord-Friendly
- State South Carolina
- 90 Strongly Landlord-Friendly · R+6
- County
- — inherits STATE
- City
- — inherits STATE
ZIP-level market 29450
- Home prices YoY
- -0.2%
- Active inventory
- 69
- Price-to-rent
- 7.5×
Monthly cashflow live
- Estimated rent
- $5,407 medium interval (Pro) →
- Mortgage (P&I)
- −$2,564
- Tax est. 1.5%
- −$611 /mo · $7,335/yr
- Insurance
- −$204
- HOA
- −$33
- Vacancy / Maint / Mgmt
- −$1,135
- Net cashflow
- $859
Break-even live
UW: 25.0% down · 7.5% · 30yr · 1.5% tax · 5.0% vac · 8.0% maint · 8.0% mgmt
Financing live
Cash to close
- Down payment
- $122,250
- Closing costs
- $14,670
- Reserves months
- —
- Total cash needed
- —
Loan-product check · same deal, 3 products live
Conventional
25% down · 7.5% · 30yr
- Down + closing
- —
- Monthly P&I
- —
- Monthly cashflow
- —
- DSCR
- —
- Eligible?
- —
Personal DTI + credit; lowest rate.
DSCR
20% down · 8.5% · 30yr
- Down + closing
- —
- Monthly P&I
- —
- Monthly cashflow
- —
- DSCR
- —
- Eligible?
- —
No personal income docs; deal must DSCR.
Hard money
10% down · 12.0% · 12mo
- Down + closing
- —
- Monthly P&I
- —
- Monthly cashflow
- —
- DSCR
- —
- Eligible?
- —
Short-term bridge; refi at stabilization.
HOA detail
- Monthly dues
- $33 · $396/yr
Listing history 15 events
-
2026-06-18days on market $489,000 Active 272 DOM
-
2026-06-17days on market $489,000 Active 271 DOM
-
2026-06-16days on market $489,000 Active 270 DOM
-
2026-06-15days on market $489,000 Active 269 DOM
-
2026-06-13days on market $489,000 Active 267 DOM
-
2026-06-13days on market $489,000 Active 266 DOM
-
2026-06-10days on market $489,000 Active 264 DOM
-
2026-06-09days on market $489,000 Active 263 DOM
-
2026-06-08days on market $489,000 Active 262 DOM
-
2026-06-07days on market $489,000 Active 261 DOM
-
2026-06-05days on market $489,000 Active 258 DOM
-
2026-06-03days on market $489,000 Active 257 DOM
-
2026-06-03days on market $489,000 Active 256 DOM
-
2026-06-01days on market $489,000 Active 255 DOM
-
2026-05-31days on market $489,000 Active 254 DOM
ⓘ Source: listings_history table (triggers on properties + properties_extension) + one-shot
backfill from property_details.listing_events for pre-trigger history.
Climate risk First Street
- Flood 1/10 Low FEMA zone X (unshaded) · 0% chance over 30 yrs
- Wildfire 7/10 Severe
- Heat 9/10 Extreme 7 d/yr ≥108°F today · 19 d/yr by 30 yrs out
- Wind 8/10 Severe 96% chance of damaging wind over 30 yrs
- Air quality 3/10 Moderate 2 unhealthy d/yr today · 2 by 30 yrs out
Nearby sold comps map
Loading sold comps map…
Walkable amenities ~0.75 mi
Loading nearby amenities…
Taxation est. · year 1
- Rental income
- $64,881
- − Mortgage interest
- −$27,392
- − Property taxes
- −$7,335
- − Insurance
- −$2,445
- − Repairs & maintenance
- −$5,190
- − Management
- −$5,190
- − HOA
- −$396
- − Depreciation
- −$14,225
- Taxable income
- $2,707
- Est. tax owed @ 24.0%
- −$650
- After-tax cash flow
- $9,658/yr
For passive investors: Depreciation is non-cash, so a rental often shows a tax loss while cash-flowing — sheltering income. Rental losses are passive: they offset passive income freely, and up to $25,000/yr can offset ordinary (W-2) income if you actively participate and your MAGI is under $100k (phasing out to $0 by $150k); unused losses carry forward. On sale, claimed depreciation is recaptured at up to 25%, and gains may owe capital-gains tax (a 1031 exchange can defer both). Figures are a year-1 estimate at your 24.0% rate — not tax advice; consult a CPA.
Schools (NCES district)
- District
- Berkeley 01
- NCES district ID
- 4501170
- Math proficiency
- 35% ▼ -8.00%
- Reading proficiency
- 48% ▼ -2.00%
- Median HH income
- $52,724
- Composite
- 35.95/100
- National rank
- #4799
- State rank
- #30 of 80 in SC
Livability — Charleston
- Score
- 76/100
- State rank
- #22
- US rank
- #3336
Category grades
Schools grade is shown separately in the Schools card above.
Census & demographics
- City population
- 200,573
- Population (ZIP)
- 3,124
Population outlook (Berkeley County) Hauer SSP2
- Today (2025)
- 254,184 people
- By 2030
- 279,677 · +10.0%
- By 2040
- 329,379 · +29.6%
- By 2050
- 375,557 · +47.8%
- By 2075
- 476,740 · +87.6%
- By 2100
- 535,945 · +110.8%
Race, ethnicity, and origin ACS 2023
- Neighborhood character
- Majority Black (64%)
- Race & ethnicity
- Black 64% White 25% Hispanic / Latino 9% Two or more races 4%
- Hispanic origin (detail)
- Mexican 6% Dominican 2%
- Common ancestry
- Serbian 7% Italian 1% Lithuanian 1%
- Foreign-born
- 2% · Canada
- Languages at home
- 96% English-only · Spanish 3%
Political lean MEDSL · Berkeley
- 2024 margin
- R (+16.3) · D 41.1% · R 57.4% · Other 1.4%
- 2008→2024 swing
- -3.2pp toward R · 2008: -13.1pp · 2024: -16.3pp
- All cycles
- 2024: R+16.3 2020: R+11.7 2016: R+17.4 2012: R+18.9 2008: R+13.1
Not yet ingested
- Civics
- —
Market trends
- HPI YoY
- ▼ -1.12%
- Current HPI
- 462.4619
- Rent YoY
- —
- Metro
- —
- State GDP YoY
- ▲ 4.51%
- F500 in state
- 2
Industry mix (Fortune 500 HQ in SC)
| Industry | F500 HQs | Revenue |
|---|---|---|
| Packaging | 1 | $7B |
|
||
Cash-flow waterfall
monthlySold comps — $/sqft
last 12 mo · ≤1 miLoading sold comps…