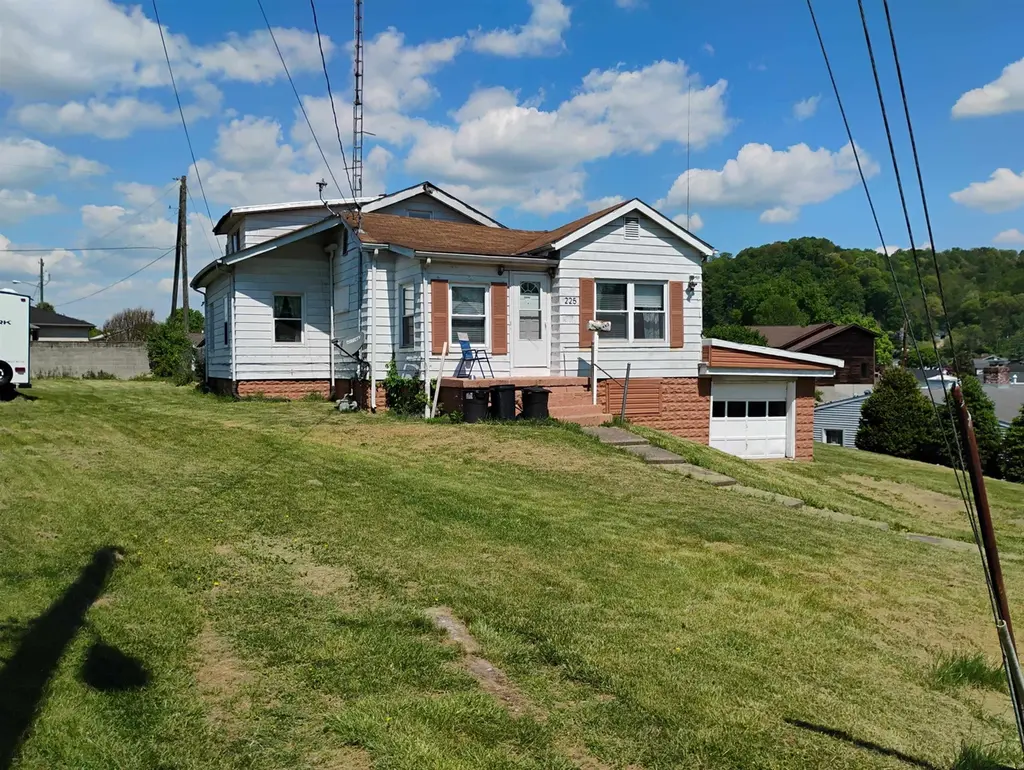
225 Rose St · Ironton, OH
Flood risk 1/10 · Minimal
- FEMA flood zone
- X
- Chance of flooding over 30 yrs
- 0.0%
- Est. flood insurance / yr
- $507 – $1,088
Fire risk 7/10 · Major
- Est. fire insurance / yr
- $713 – $1,323
Heat risk 5/10 · Moderate
- Hot days now (above 102°F)
- 7 days/yr
- Hot days in 30 yrs
- 19 days/yr
Wind risk 2/10 · Minimal
- Chance of severe wind over 30 yrs
- 2.0%
Air-quality risk 2/10 · Minimal
- Unhealthy air days now
- 0 days/yr
- Unhealthy air days in 30 yrs
- 2 days/yr
Risk factors via First Street. Map © Google.
Why this score? — see what drove the B grade
The composite is a weighted blend of 9 inputs, each scored 0–100. Each bar is that input's sub-score; the figure is the points it added to the 100-point composite (weight × sub-score).
- Cash flow +30.0/30.0
- 1% rule +10.0/10.0
- DSCR +10.0/10.0
- ARV discount +7.5/15.0
- Schools +4.6/10.0
- Livability +3.6/5.0
- Rent growth +2.5/5.0
- Condition / age +2.5/5.0
- Appreciation +0.0/10.0
$59,900
🖨 Deal sheet 📄 Offer letter ✓ Due diligence
Listing remarks
DEAL OF THE DAY. AFFORDABLE HOME TO FIX IT YOUR OWN WAY. OR START YOUR RENTAL INCOME BUSINESS. THE LARGE LOT IS A REAL BONUS PART IS FENCED. 3RD BEDROOM IS ATTIC BEDROOM. COVERED BACK PORCH.
Key facts
- Fenced
- Large lot
- Covered back porch
Tags
Property features AI
Exterior
- Home design: Residential single-family home
- Construction: Single-family construction
- Exterior features: Chain link fence
Interior
- Bathrooms: 1 full bathroom; 1 half bathroom
- Heating & cooling: Central heating; Natural gas heating
- Interior features: Partial crawl space basement
Neighborhood map
What this means for you Summary
Snapshot
- This is a 2-bed/1.0-bath single-family listed at $60k.
Deal economics
- At list price, monthly cash flow is $449 ($5k/yr) — positive.
- The deal already cash-flows at list — no discount required.
- Meets the 1% rule at list price ($1k rent vs $60k).
- Recommended offer: $58k (3.0% below list) — sets the bar for market timing.
- Cap rate 15.3% vs local median 5.1% in Ironton — top-decile yield for the area; either an underpriced asset or a hidden risk that comps aren't pricing in. Stress-test before assuming the spread holds.
Location & tenants
- Location reads 72/100 on livability (#354 in OH) — a middle-class / working-renter tenant base. Strengths: cost of living A+, health & safety A+, housing A-; Watch: amenities F, commute F, employment D-.
- Ironton City School District (suburban): math 54% / reading 58% proficiency, ranked #382 of 656 in OH (top 58%) — acceptable for families but not a draw, mixed tenant base, ~2y average lease.
- Market conditions: 84 active listings in the ZIP; 18 units permitted in Lawrence County in 2024 (0 in 5+ unit buildings).
Forward outlook
- Local home prices are declining (-3.0%/yr); year-one equity from $414 of loan paydown is wiped out by about $2k of value loss. Plan a longer hold.
- Lawrence County population projected at -22% by 2050 — secular population decline; favor cash flow + early exit over multi-decade hold.
- At projected returns (-3.0% appreciation + 3.0% rent growth), your $17k cash investment doubles in ~4 years — after that, you're playing with house money.
Negotiation context
- It's been on market 48 days — a 3% lower offer ($58k) is reasonable based on typical stale-listing flexibility.
- Current owner paid $16k; list at $60k implies a 274% gain — meaningful room to come down on a strong offer.
Risks & watch-outs
- Watch-outs: built in 1930 — expect roof / HVAC / electrical / plumbing capex.
- Climate carrying-cost: major wildfire risk; extreme-heat days projected 7→19/yr by 2055 (HVAC capex compounding) — expect insurance premiums to compound above CPI over the hold.
Questions for the listing agent
- It's been on market 48 days. Have you received any prior offers? Is the seller open to a 3% concession, seller financing, or rate buy-down credit?
- Built in 1930 — when were the roof, HVAC, electrical panel, plumbing, and water heater last replaced?
- Is there a deadline driving the sale (1031 exchange, divorce, estate, relocation)? That informs how much negotiation room exists.
- Schools are B-rated — typically a magnet for longer-tenancy family renters. What's the average tenant stay here, and is there a school-zone premium baked into asking?
- What's the average days-on-market for RENTAL listings here right now (not sales)? A rising rental-DOM trend means longer vacancies and softer asking-rent achievability than the comps imply.
- What's the recent tenant-quality profile in this submarket — average credit score on applications, eviction rate, late-payment / NSF rate, and stable-employment percentage? A property-management company in the area should have these aggregated.
- How much new for-sale + rental construction is in the pipeline within 1–3 miles? Heavy new supply typically softens prices + rents 12–24 months out; constrained supply supports both.
Investment metrics
- 1% rule
- 1.79% ✓
- Cap rate
- 15.28%
- Cash-on-cash
- 32.11%
- DSCR
- 2.43
- GRM
- 4.7
CMA / ARV
- ARV (median comp)
- $179,376
- List price
- $59,900
- Delta
- -66.61%
- Verdict
- UNDERPRICED
- Comps
- 20 within 1.0 mi
Show comp detail 8 sales within ~0.75 mi
| Address | Dist | Beds/Ba | Sqft | Sold | Price | $/sf | Match |
|---|---|---|---|---|---|---|---|
| 517 Orchard St St | 0.20mi | 3/1.0 (+1) | 1,462 (-2%) | 4mo | $20,000 | $14 | 79 |
| 1605 Thomas St | 0.23mi | 3/2.0 (+1) | 1,512 (+2%) | 13mo | $164,000 | $108 | 66 |
| 1617 Karin St | 0.35mi | 3/2.0 (+1) | 1,408 (-5%) | 9mo | $185,000 | $131 | 59 |
| 1705 Thomas St | 0.32mi | 3/2.0 (+1) | 1,344 (-10%) | 2mo | $170,000 | $126 | 58 |
| 614 Jeannine St | 0.39mi | 3/1.5 (+1) | 1,376 (-8%) | 17mo | $184,000 | $134 | 48 |
| 417 Cliff Street St | 0.49mi | 3/2.0 (+1) | 1,448 (-3%) | 20mo | $185,000 | $128 | 47 |
| 1743 Kevin St | 0.45mi | 3/2.0 (+1) | 1,364 (-8%) | 12mo | $156,900 | $115 | 46 |
| 95 Yellow Branch Rd | 0.67mi | 3/2.0 (+1) | 1,316 (-12%) | 10mo | $173,000 | $131 | 32 |
Match score weights: distance 35% · size 25% · config 20% · recency 20%. Top-matched comps best support the ARV.
Projected returns pro-forma
-3.0% appreciation · 3.0% rent growth · sell at horizon
- IRR
- 27.1%
- Equity multiple
- 2.13×
- Total profit
- $18,880
- Equity at exit
- $8,931
- IRR
- 34.7%
- Equity multiple
- 4.18×
- Total profit
- $53,266
- Equity at exit
- $5,179
Cash invested: $16,772 (down + closing). Projections, not guarantees.
Landlord ↔ Tenant lean methodology
- Overall (STATE)
- 73 Landlord-Friendly
- State Ohio
- 73 Landlord-Friendly · R+6
- County
- — inherits STATE
- City
- — inherits STATE
ZIP-level market 45638
- Home prices YoY
- -19.6%
- Active inventory
- 84
- Price-to-rent
- 4.7×
Monthly cashflow live
- Estimated rent
- $1,072 medium interval (Pro) →
- Mortgage (P&I)
- −$314
- Tax from tax record
- −$59 /mo · $705/yr
- Insurance
- −$25
- HOA
- −$0
- Vacancy / Maint / Mgmt
- −$225
- Net cashflow
- $449
Break-even live
UW: 25.0% down · 7.5% · 30yr · 1.5% tax · 5.0% vac · 8.0% maint · 8.0% mgmt
Financing live
Cash to close
- Down payment
- $14,975
- Closing costs
- $1,797
- Reserves months
- —
- Total cash needed
- —
Loan-product check · same deal, 3 products live
Conventional
25% down · 7.5% · 30yr
- Down + closing
- —
- Monthly P&I
- —
- Monthly cashflow
- —
- DSCR
- —
- Eligible?
- —
Personal DTI + credit; lowest rate.
DSCR
20% down · 8.5% · 30yr
- Down + closing
- —
- Monthly P&I
- —
- Monthly cashflow
- —
- DSCR
- —
- Eligible?
- —
No personal income docs; deal must DSCR.
Hard money
10% down · 12.0% · 12mo
- Down + closing
- —
- Monthly P&I
- —
- Monthly cashflow
- —
- DSCR
- —
- Eligible?
- —
Short-term bridge; refi at stabilization.
Listing history 11 events
-
2026-06-12statusdays on market $59,900 Pending 48 DOM
-
2026-06-09days on market $59,900 Active 47 DOM
-
2026-06-08days on market $59,900 Active 46 DOM
-
2026-06-08days on market $59,900 Active 45 DOM
-
2026-06-07days on market $59,900 Active 44 DOM
-
2026-06-04days on market $59,900 Active 41 DOM
-
2026-06-02days on market $59,900 Active 40 DOM
-
2026-06-01days on market $59,900 Active 39 DOM
-
2026-05-31days on market $59,900 Active 38 DOM
-
2026-04-23$59,900 Active 190-char remark
-
2003-12-16soldstatus $16,000
ⓘ Source: listings_history table (triggers on properties + properties_extension) + one-shot
backfill from property_details.listing_events for pre-trigger history.
Tax reassessment forecast OH · Partial reset (capped growth)
- Current annual tax
- $705 · $59/mo
- Projected year-2 tax
- $820 · $68/mo
- Expected delta
- +$115/yr (+$10/mo · 16.3%)
ⓘ Screening estimate from a state-policy table — verify with the county assessor before closing.
Climate risk First Street
- Flood 1/10 Low FEMA zone X · 0% chance over 30 yrs
- Wildfire 7/10 Severe
- Heat 5/10 Major 7 d/yr ≥102°F today · 19 d/yr by 30 yrs out
- Wind 2/10 Low 2% chance of damaging wind over 30 yrs
- Air quality 2/10 Low 0 unhealthy d/yr today · 2 by 30 yrs out
Nearby sold comps map
Loading sold comps map…
Walkable amenities ~0.75 mi
Loading nearby amenities…
Taxation est. · year 1
- Rental income
- $12,859
- − Mortgage interest
- −$3,355
- − Property taxes
- −$705
- − Insurance
- −$300
- − Repairs & maintenance
- −$1,029
- − Management
- −$1,029
- − Depreciation
- −$1,743
- Taxable income
- $4,699
- Est. tax owed @ 24.0%
- −$1,128
- After-tax cash flow
- $4,257/yr
For passive investors: Depreciation is non-cash, so a rental often shows a tax loss while cash-flowing — sheltering income. Rental losses are passive: they offset passive income freely, and up to $25,000/yr can offset ordinary (W-2) income if you actively participate and your MAGI is under $100k (phasing out to $0 by $150k); unused losses carry forward. On sale, claimed depreciation is recaptured at up to 25%, and gains may owe capital-gains tax (a 1031 exchange can defer both). Figures are a year-1 estimate at your 24.0% rate — not tax advice; consult a CPA.
Schools (NCES district)
- District
- Ironton City School District
- NCES district ID
- 3904414
- Math proficiency
- 54% ▼ -10.00%
- Reading proficiency
- 58% ▼ -7.00%
- Median HH income
- $32,999
- Composite
- 46.13/100
- National rank
- #2505
- State rank
- #382 of 656 in OH
Livability — Ironton
- Score
- 72/100
- State rank
- #354
- US rank
- #5718
Category grades
Schools grade is shown separately in the Schools card above.
Census & demographics
- Census place
- Ironton, OH
- County
- Lawrence · 57,020 people
- Metro
- Huntington-Ashland, WV-KY-OH
- Population (ZIP)
- 19,921
- Household income
- $49,544
- Rent vs Own
- Severe rent burden
- 10.7
Population outlook (Lawrence County) Hauer SSP2
- Today (2025)
- 57,915 people
- By 2030
- 55,650 · -3.9%
- By 2040
- 50,523 · -12.8%
- By 2050
- 45,103 · -22.1%
- By 2075
- 32,441 · -44.0%
- By 2100
- 21,754 · -62.4%
Race, ethnicity, and origin ACS 2023
- Neighborhood character
- Predominantly White (95%)
- Race & ethnicity
- White 95% Two or more races 3% Black 1%
- Common ancestry
- Slovak 2% Iranian 2% Lithuanian 1%
- Foreign-born
- 0%
Political lean MEDSL · Lawrence
- 2024 margin
- Solid R (+50.5) · D 24.4% · R 74.9%
- 2008→2024 swing
- -35.2pp toward R · 2008: -15.3pp · 2024: -50.5pp
- All cycles
- 2024: R+50.5 2020: R+45.6 2016: R+43.9 2012: R+15.5 2008: R+15.3
Not yet ingested
- Civics
- —
Market trends
- HPI YoY
- ▼ -48.00%
- Current HPI
- 196.7459
- Rent YoY
- —
- Metro
- —
- State GDP YoY
- ▲ 1.98%
- F500 in state
- 48
Industry mix (Fortune 500 HQ in OH)
| Industry | F500 HQs | Revenue |
|---|---|---|
| Insurance | 3 | $145B |
|
||
| Industrial Machinery | 3 | $49B |
|
||
| Financial Services | 3 | $24B |
|
||
| Consumer Goods | 2 | $93B |
|
||
| Aerospace / Defense | 2 | $47B |
|
||
| Utilities | 2 | $33B |
|
||
Price history
+274.4% since first listed3 events — show timeline
- 2026-06-10 Pending — HBRMLS
- 2026-04-23 Listed $59,900 HBRMLS
- 2003-12-16 Sold (Public Records) $16,000 Public Records
Property tax history
+12.5%/yrLatest (2025): $705 · +28.2% YoY. Source: county tax records.
Cash-flow waterfall
monthlySold comps — $/sqft
last 12 mo · ≤1 miLoading sold comps…