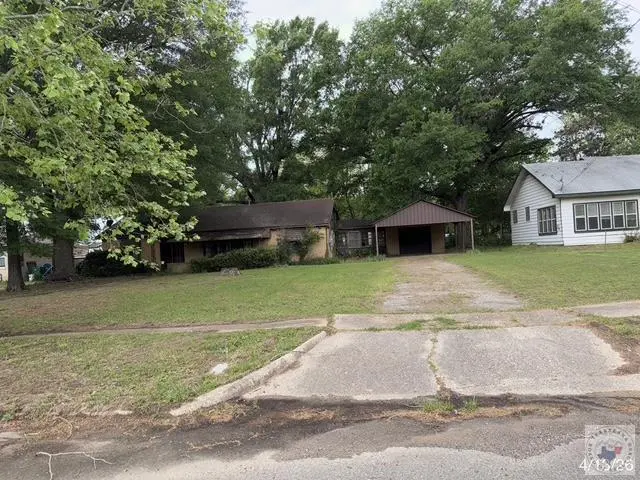
411 Church St · De Kalb, TX
Flood risk 1/10 · Minimal
- FEMA flood zone
- X (unshaded)
- Chance of flooding over 30 yrs
- 0.0%
- Est. flood insurance / yr
- $507 – $1,088
Fire risk 4/10 · Minor
- Est. fire insurance / yr
- $1,222 – $2,270
Heat risk 7/10 · Major
- Hot days now (above 111°F)
- 7 days/yr
- Hot days in 30 yrs
- 23 days/yr
Wind risk 4/10 · Minor
- Chance of severe wind over 30 yrs
- 23.0%
Air-quality risk 2/10 · Minimal
- Unhealthy air days now
- 1 days/yr
- Unhealthy air days in 30 yrs
- 1 days/yr
Risk factors via First Street. Map © Google.
Why this score? — see what drove the A- grade
The composite is a weighted blend of 9 inputs, each scored 0–100. Each bar is that input's sub-score; the figure is the points it added to the 100-point composite (weight × sub-score).
- Cash flow +30.0/30.0
- ARV discount +15.0/15.0
- DSCR +10.0/10.0
- 1% rule +9.8/10.0
- Appreciation +6.5/10.0
- Schools +3.4/10.0
- Livability +3.2/5.0
- Rent growth +2.5/5.0
- Condition / age +2.5/5.0
$84,900
🖨 Deal sheet 📄 Offer letter ✓ Due diligence
Listing remarks MLS
Located in Dekalb TX. This home features three bedrooms, two baths. The spacious kitchen features an island and abundant cabinet space. Enjoy gathering in the large family room and step outside to a fenced backyard ideal for hosting family and friends. Property is being sold "AS IS WHERE IS"
Key facts
- Large family room
- Spacious kitchen
- Fenced backyard
Tags
Neighborhood map
What this means for you Summary
Snapshot
- This is a 3-bed/2.0-bath single-family listed at $85k.
Deal economics
- At list price, monthly cash flow is $330 ($4k/yr) — positive.
- The deal already cash-flows at list — no discount required.
- Meets the 1% rule at list price ($1k rent vs $85k).
- Recommended offer: $80k (6.0% below list) — sets the bar for market timing.
Location & tenants
- Location reads 65/100 on livability (#721 in TX) — a middle-class / working-renter tenant base. Strengths: crime A+, cost of living A+, housing A+; Watch: schools D-, amenities F, commute F.
- Dekalb ISD (rural): math 44% / reading 38% proficiency, ranked #403 of 826 in TX (top 49%) — families likely to look elsewhere, expect single-tenant / working-renter base with shorter leases; 63% free/reduced lunch — lower-income household profile, screen leases tightly.
- Market conditions: 105 active listings in the ZIP; 137 units permitted in Bowie County in 2024 (5 in 5+ unit buildings).
Forward outlook
- In year one you build about $3k of equity ($587 loan paydown + $3k appreciation (3.0% local appreciation)).
- At projected returns (3.0% appreciation + 3.0% rent growth), your $24k cash investment doubles in ~4 years — after that, you're playing with house money.
- By year 10, paydown + projected appreciation supports a ~$31k cash-out refi (75% LTV) — recoverable capital for the next deal without selling this one.
Negotiation context
- It's been on market 66 days — a 6% lower offer ($80k) is reasonable based on typical stale-listing flexibility.
Risks & watch-outs
- Watch-outs: property tax is 2.6% of price.
- Climate carrying-cost: extreme-heat days projected 7→23/yr by 2055 (HVAC capex compounding) — expect insurance premiums to compound above CPI over the hold.
Questions for the listing agent
- It's been on market 66 days. Have you received any prior offers? Is the seller open to a 6% concession, seller financing, or rate buy-down credit?
- Property tax is high relative to price — has the assessment been appealed recently, and will the sale trigger a re-assessment?
- Why hasn't it sold? Are there any deal-killer items the seller is aware of (foundation, flood, title, zoning, code violations)?
- Is there a deadline driving the sale (1031 exchange, divorce, estate, relocation)? That informs how much negotiation room exists.
- Schools are D-rated, which usually means shorter tenancies and higher turnover. Who's the typical renter profile here, and what's been the actual vacancy rate?
- What's the average days-on-market for RENTAL listings here right now (not sales)? A rising rental-DOM trend means longer vacancies and softer asking-rent achievability than the comps imply.
- What's the recent tenant-quality profile in this submarket — average credit score on applications, eviction rate, late-payment / NSF rate, and stable-employment percentage? A property-management company in the area should have these aggregated.
- How much new for-sale + rental construction is in the pipeline within 1–3 miles? Heavy new supply typically softens prices + rents 12–24 months out; constrained supply supports both.
Investment metrics
- 1% rule
- 1.48% ✓
- Cap rate
- 10.96%
- Cash-on-cash
- 16.66%
- DSCR
- 1.74
- GRM
- 5.6
CMA / ARV
- ARV (median comp)
- $139,944
- List price
- $84,900
- Delta
- -39.33%
- Verdict
- UNDERPRICED
- Comps
- 5 within 1.0 mi
Projected returns pro-forma
3.04% appreciation · 3.0% rent growth · sell at horizon
- IRR
- 23.3%
- Equity multiple
- 2.32×
- Total profit
- $31,472
- Equity at exit
- $38,346
- IRR
- 24.2%
- Equity multiple
- 4.47×
- Total profit
- $82,486
- Equity at exit
- $59,230
Cash invested: $23,772 (down + closing). Projections, not guarantees.
Landlord ↔ Tenant lean methodology
- Overall (STATE)
- 87 Strongly Landlord-Friendly
- State Texas
- 87 Strongly Landlord-Friendly · R+5
- County
- — inherits STATE
- City
- — inherits STATE
ZIP-level market 75559
- Home prices YoY
- 1.9%
- Active inventory
- 105
- Price-to-rent
- 5.6×
Monthly cashflow live
- Estimated rent
- $1,258 medium interval (Pro) →
- Mortgage (P&I)
- −$445
- Tax from tax record
- −$183 /mo · $2,197/yr
- Insurance
- −$35
- HOA
- −$0
- Vacancy / Maint / Mgmt
- −$264
- Net cashflow
- $330
Break-even live
UW: 25.0% down · 7.5% · 30yr · 1.5% tax · 5.0% vac · 8.0% maint · 8.0% mgmt
Financing live
Cash to close
- Down payment
- $21,225
- Closing costs
- $2,547
- Reserves months
- —
- Total cash needed
- —
Loan-product check · same deal, 3 products live
Conventional
25% down · 7.5% · 30yr
- Down + closing
- —
- Monthly P&I
- —
- Monthly cashflow
- —
- DSCR
- —
- Eligible?
- —
Personal DTI + credit; lowest rate.
DSCR
20% down · 8.5% · 30yr
- Down + closing
- —
- Monthly P&I
- —
- Monthly cashflow
- —
- DSCR
- —
- Eligible?
- —
No personal income docs; deal must DSCR.
Hard money
10% down · 12.0% · 12mo
- Down + closing
- —
- Monthly P&I
- —
- Monthly cashflow
- —
- DSCR
- —
- Eligible?
- —
Short-term bridge; refi at stabilization.
Listing history 15 events
-
2026-06-18days on market $84,900 Active 66 DOM
-
2026-06-17days on market $84,900 Active 65 DOM
-
2026-06-16days on market $84,900 Active 64 DOM
-
2026-06-15days on market $84,900 Active 63 DOM
-
2026-06-13days on market $84,900 Active 61 DOM
-
2026-06-12days on market $84,900 Active 60 DOM
-
2026-06-09days on market $84,900 Active 57 DOM
-
2026-06-08days on market $84,900 Active 56 DOM
-
2026-06-08days on market $84,900 Active 55 DOM
-
2026-06-05days on market $84,900 Active 53 DOM
-
2026-06-03days on market $84,900 Active 51 DOM
-
2026-06-02days on market $84,900 Active 50 DOM
-
2026-06-01days on market $84,900 Active 49 DOM
-
2026-05-31days on market $84,900 Active 48 DOM
-
2026-04-13$89,900 Active 302-char remark
Show marketing remark (302 chars)
Located in Dekalb TX. This home features three bedrooms, two baths. The spacious kitchen features an island and abundant cabinet space. Enjoy gathering in the large family room and step outside to a fenced backyard ideal for hosting family and friends. Property is being sold "AS IS WHERE IS"
ⓘ Source: listings_history table (triggers on properties + properties_extension) + one-shot
backfill from property_details.listing_events for pre-trigger history.
Tax reassessment forecast TX · Resets to sale price
- Current annual tax
- $2,197 · $183/mo
- Projected year-2 tax
- $2,197 · $183/mo
- Expected delta
- $0/yr ($0/mo · 0.0%)
ⓘ Screening estimate from a state-policy table — verify with the county assessor before closing.
Climate risk First Street
- Flood 1/10 Low FEMA zone X (unshaded) · 0% chance over 30 yrs
- Wildfire 4/10 Moderate
- Heat 7/10 Severe 7 d/yr ≥111°F today · 23 d/yr by 30 yrs out
- Wind 4/10 Moderate 23% chance of damaging wind over 30 yrs
- Air quality 2/10 Low 1 unhealthy d/yr today · 1 by 30 yrs out
Nearby sold comps map
Loading sold comps map…
Walkable amenities ~0.75 mi
Loading nearby amenities…
Taxation est. · year 1
- Rental income
- $15,093
- − Mortgage interest
- −$4,756
- − Property taxes
- −$2,197
- − Insurance
- −$424
- − Repairs & maintenance
- −$1,207
- − Management
- −$1,207
- − Depreciation
- −$2,470
- Taxable income
- $2,832
- Est. tax owed @ 24.0%
- −$680
- After-tax cash flow
- $3,280/yr
For passive investors: Depreciation is non-cash, so a rental often shows a tax loss while cash-flowing — sheltering income. Rental losses are passive: they offset passive income freely, and up to $25,000/yr can offset ordinary (W-2) income if you actively participate and your MAGI is under $100k (phasing out to $0 by $150k); unused losses carry forward. On sale, claimed depreciation is recaptured at up to 25%, and gains may owe capital-gains tax (a 1031 exchange can defer both). Figures are a year-1 estimate at your 24.0% rate — not tax advice; consult a CPA.
Schools (NCES district)
- District
- Dekalb ISD
- NCES district ID
- 4816570
- Math proficiency
- 44% ▲ 6.00%
- Reading proficiency
- 38% ▲ 2.00%
- Median HH income
- $40,661
- Composite
- 34.46/100
- National rank
- #5193
- State rank
- #403 of 826 in TX
Livability — De Kalb
- Score
- 65/100
- State rank
- #721
- US rank
- #13453
Category grades
Schools grade is shown separately in the Schools card above.
Census & demographics
- Census place
- De Kalb, TX
- Population (ZIP)
- 5,276
Population outlook (Bowie County) Hauer SSP2
- Today (2025)
- 94,699 people
- By 2030
- 94,824 · +0.1%
- By 2040
- 94,870 · +0.2%
- By 2050
- 93,686 · -1.1%
- By 2075
- 90,082 · -4.9%
- By 2100
- 76,579 · -19.1%
Race, ethnicity, and origin ACS 2023
- Neighborhood character
- Predominantly White (73%)
- Race & ethnicity
- White 73% Black 12% Hispanic / Latino 10% Two or more races 6% Native American 1%
- Hispanic origin (detail)
- Mexican 9%
- Common ancestry
- Serbian 1% Italian 1% Iranian 1%
- Foreign-born
- 4% · Canada
- Languages at home
- 96% English-only · Spanish 2% Tagalog/Filipino 1% German/W. Germanic 1%
Political lean MEDSL · Bowie
- 2024 margin
- Solid R (+48.7) · D 25.3% · R 74.0%
- 2008→2024 swing
- -10.8pp toward R · 2008: -37.9pp · 2024: -48.7pp
- All cycles
- 2024: R+48.7 2020: R+42.8 2016: R+46.6 2012: R+41.5 2008: R+37.9
Not yet ingested
- Civics
- —
Market trends
- HPI YoY
- ▲ 3.04%
- Current HPI
- 161.9331
- Rent YoY
- —
- Metro
- —
- State GDP YoY
- ▲ 3.95%
- F500 in state
- 110
Industry mix (Fortune 500 HQ in TX)
| Industry | F500 HQs | Revenue |
|---|---|---|
| Energy | 16 | $1,198B |
|
||
| Technology | 5 | $198B |
|
||
| Engineering / Construction | 4 | $72B |
|
||
| Energy Services | 3 | $60B |
|
||
| Utilities | 3 | $41B |
|
||
| Healthcare | 2 | $330B |
|
||
Price history
1 event — show timeline
- 2026-04-13 Listed $89,900 TBOR
Property tax history
+1.1%/yrLatest (2025): $2,197 · -4.8% YoY. Source: county tax records.
Cash-flow waterfall
monthlySold comps — $/sqft
last 12 mo · ≤1 miLoading sold comps…