120 Padre Blvd #206 · South Padre Island, TX
Flood risk 8/10 · Major
- FEMA flood zone
- AE
- Chance of flooding over 30 yrs
- 0.99%
- Est. flood insurance / yr
- $1,737 – $8,500
Fire risk 1/10 · Minimal
- Est. fire insurance / yr
- $1,222 – $2,270
Heat risk 10/10 · Severe
- Hot days now (above 105°F)
- 8 days/yr
- Hot days in 30 yrs
- 30 days/yr
Wind risk 9/10 · Severe
- Chance of severe wind over 30 yrs
- 99.0%
Air-quality risk 2/10 · Minimal
- Unhealthy air days now
- 0 days/yr
- Unhealthy air days in 30 yrs
- 1 days/yr
Risk factors via First Street. Map © Google.
Why this score? — see what drove the D grade
The composite is a weighted blend of 9 inputs, each scored 0–100. Each bar is that input's sub-score; the figure is the points it added to the 100-point composite (weight × sub-score).
- Cash flow +16.1/30.0
- ARV discount +7.8/15.0
- 1% rule +6.3/10.0
- DSCR +5.0/10.0
- Livability +3.0/5.0
- Rent growth +2.5/5.0
- Condition / age +2.0/5.0
- Schools +1.9/10.0
- Appreciation +0.0/10.0
$215,000
🖨 Deal sheet (PDF) 📄 Offer letter ✓ Due diligence
Listing remarks MLS
Desireable TURNKEY condo with excellent rental potential, possessing all the right qualities: close to beach and waterpark, short walk to restaurant/bar, has convenient complex elevator, on-site laundry, fabulous picnic/BBQ area and sparkling pool. Plus, condo interiors are bright with natural light and tastefully remodeled kitchen. Balcony overlooks complex pool area and even provides a vista of the bay. It just doesn't get better than this at such a low price!
Key facts
- Bbq
- Tennis
- Picnic area
Tags
Property features AI
Finance
- HOA & community: Homeowners association with monthly fee
Exterior
- Utilities: Public water
- Home design: Condominium (residential); Single-story
- Exterior features: Balcony
Interior
- Flooring: Tile
- Bathrooms: 1 full bathroom
- Heating & cooling: Central heating; Central air; Ceiling fan(s)
- Interior features: Electric water heater; Tile flooring
Neighborhood map
What this means for you Summary
Snapshot
- This is a 1-bed/1.0-bath condo listed at $215k. Condition is rated fair.
Deal economics
- At list price, monthly cash flow is $-317 ($-4k/yr) — negative.
- The deal already cash-flows at list — no discount required.
- Meets the 1% rule at list price ($2k rent vs $215k).
- Recommended offer: $212k (1.5% below list) — sets the bar for market timing.
- Cap rate 6.9% vs local median 1.8% in South Padre Island — top-decile yield for the area; either an underpriced asset or a hidden risk that comps aren't pricing in. Stress-test before assuming the spread holds.
Location & tenants
- Location reads 60/100 on livability (#1,077 in TX) — a middle-class / working-renter tenant base. Strengths: housing B; Watch: amenities C-, crime F, commute F.
- Point Isabel ISD (town): math 14% / reading 31% proficiency, ranked #756 of 826 in TX (top 92%) — low school quality limits family demand, transient renter base, plan for 1-2y turnover.
- Zoned schools: Port Isabel J H (math 10% / reading 29%, grade F, #1,445 of 1,662 statewide, top 88%, 425 students, 84% FRL); Port Isabel H S (math 17% / reading 42%, grade F, #1,112 of 1,632 statewide, top 70%, 606 students, 82% FRL) — zoned schools average 83% FRL vs 35% district-wide (48 pts higher); higher-poverty schools than district average — tighter screening recommended.
- Market conditions: 524 active listings in the ZIP; 2 comparable units currently listed for rent nearby; 2,326 units permitted in Cameron County in 2024 (503 in 5+ unit buildings).
- This rent runs 43% of the median local income ($68k/yr) — at the standard rent-burdened threshold; future hikes will face affordability resistance.
Forward outlook
- Local home prices are declining (-3.0%/yr); year-one equity from $1k of loan paydown is wiped out by about $6k of value loss. Plan a longer hold.
- Cameron County population projected at +3% by 2050 — modest demand growth; plan on rents tracking national, not racing it.
Negotiation context
- It's been on market 21 days — a 2% lower offer ($212k) is reasonable based on typical stale-listing flexibility.
- 10 sale attempts since 3y ago with the ask held roughly flat each time — persistent listings suggest the price (not the market) is what's stuck; bring a comps-based counter.
Risks & watch-outs
- Watch-outs: flood insurance adds $427/mo.
- Climate carrying-cost: in FEMA flood zone AE (mandatory federal flood insurance); severe wind risk, 99% chance of damaging wind over 30y; extreme-heat days projected 8→30/yr by 2055 (HVAC capex compounding) — expect insurance premiums to compound above CPI over the hold.
Questions for the listing agent
- What do current leases actually rent for vs. the listed asking? Can we see a recent rent roll and the last 12 months of T-12 income?
- Have any recent inspections been done? Can we get a copy of the seller's disclosures and any deferred-maintenance estimates?
- What's the actual annual flood-insurance premium (NFIP or private), and is the property in a SFHA with mandatory coverage?
- What does the HOA fee cover, when was the last increase, and are there any pending special assessments or reserve-fund shortfalls?
- Any open or pending special assessments — roof, HVAC, plumbing, elevator, façade? What's the per-unit balance and payoff schedule, and is the seller paying it off at close or rolling it to the buyer?
- Is there a deadline driving the sale (1031 exchange, divorce, estate, relocation)? That informs how much negotiation room exists.
- Schools are F-rated, which usually means shorter tenancies and higher turnover. Who's the typical renter profile here, and what's been the actual vacancy rate?
- Crime grade is F in this area — have there been break-ins, vandalism, or insurance claims at this property in the last 3 years? What carrier currently insures it and at what premium?
- The area grade is low — what's the realistic commute time and amenity access for the typical tenant pool here? Any planned neighborhood developments (good or bad) we should know about?
- What's the average days-on-market for RENTAL listings here right now (not sales)? A rising rental-DOM trend means longer vacancies and softer asking-rent achievability than the comps imply.
- What's the recent tenant-quality profile in this submarket — average credit score on applications, eviction rate, late-payment / NSF rate, and stable-employment percentage? A property-management company in the area should have these aggregated.
- How much new apartment / multifamily construction is in the pipeline within 1–3 miles? Heavy new supply (>2% of stock underway) typically softens rents 12–24 months out; light construction supports rent growth.
Investment metrics
- 1% rule
- 1.13% ✓
- Cap rate
- 6.90%
- Cash-on-cash
- 2.18%
- DSCR
- 1.10
- GRM
- 7.4
CMA / ARV
- ARV (median comp)
- $216,640
- List price
- $215,000
- Delta
- -0.76%
- Verdict
- FAIR
- Comps
- 10 within 1.0 mi
Projected returns pro-forma
-3.0% appreciation · 3.0% rent growth · sell at horizon
- IRR
- -26.8%
- Equity multiple
- 0.09×
- Total profit
- $-54,532
- Equity at exit
- $32,057
- IRR
- -23.3%
- Equity multiple
- -0.19×
- Total profit
- $-71,470
- Equity at exit
- $18,589
Cash invested: $60,200 (down + closing). Projections, not guarantees.
Landlord ↔ Tenant lean methodology
- Overall (STATE)
- 87 Strongly Landlord-Friendly
- State Texas
- 87 Strongly Landlord-Friendly · R+5
- County
- — inherits STATE
- City
- — inherits STATE
ZIP-level market 78597
- Home prices YoY
- -13.5%
- Active inventory
- 524
- Price-to-rent
- 7.4×
Monthly cashflow live
- Estimated rent
- $2,423 medium interval (Pro) →
- Mortgage (P&I)
- −$1,127
- Tax est. 1.5%
- −$269 /mo · $3,225/yr
- Insurance
- −$90
- Flood insurance flood zone
- −$427 /mo · $5,118/yr
- HOA est. from 6 same-building comps
- −$319
- Vacancy / Maint / Mgmt
- −$509
- Net cashflow
- $-317
Break-even live
Sensitivity live
| Price | -10% $-168 | -5% $-243 | +0% $-317 | +5% $-391 | +10% $-466 |
|---|---|---|---|---|---|
| Rent | -10% $-508 | -5% $-413 | +0% $-317 | +5% $-221 | +10% $-126 |
| Rate | -1.0pp $-209 | -0.5pp $-262 | base $-317 | +0.5pp $-373 | +1.0pp $-429 |
UW: 25.0% down · 7.5% · 30yr · 1.5% tax · 5.0% vac · 8.0% maint · 8.0% mgmt
Financing live
Cash to close
- Down payment
- $53,750
- Closing costs
- $6,450
- Reserves months
- —
- Total cash needed
- —
Loan-product check · same deal, 3 products live
Conventional
25% down · 7.5% · 30yr
- Down + closing
- —
- Monthly P&I
- —
- Monthly cashflow
- —
- DSCR
- —
- Eligible?
- —
Personal DTI + credit; lowest rate.
DSCR
20% down · 8.5% · 30yr
- Down + closing
- —
- Monthly P&I
- —
- Monthly cashflow
- —
- DSCR
- —
- Eligible?
- —
No personal income docs; deal must DSCR.
Hard money
10% down · 12.0% · 12mo
- Down + closing
- —
- Monthly P&I
- —
- Monthly cashflow
- —
- DSCR
- —
- Eligible?
- —
Short-term bridge; refi at stabilization.
Rent comps 2 comps
| Address | Beds | Baths | Sqft | Rent | $/sqft | DOM | Units | Dist |
|---|---|---|---|---|---|---|---|---|
| 404 Padre Blvd Unit 1507754P South Padre Island, TX | 1.0 | 2.0 | 667 | $3,382 | $5.07 | 15d | 1 | 0.41mi |
| 113 W Sunny Isle Dr Unit 2 South Padre Island, TX | 2.0 | 1.0 | 750 | $2,300 | $3.07 | 15d | 1 | 1.03mi |
HOA detail condo
- Monthly dues
- $0 · $0/yr
- Likely covers
- waterpool
- Assessments
- None detected in remarks — confirm with the listing agent.
Listing history 20 events
-
2026-06-07remarks 623-char remark
-
2026-06-07statusdays on market $215,000 Pending 21 DOM
-
2026-06-03days on market $215,000 Active Under Contract 28 DOM
-
2026-06-02days on market $215,000 Active Under Contract 27 DOM
-
2026-06-01days on market $215,000 Active Under Contract 26 DOM
-
2026-05-31days on market $215,000 Active Under Contract 25 DOM
-
2026-05-30days on market $215,000 Active Under Contract 24 DOM
-
2026-05-07$215,000 Active 466-char remark
Show marketing remark (466 chars)
Desireable TURNKEY condo with excellent rental potential, possessing all the right qualities: close to beach and waterpark, short walk to restaurant/bar, has convenient complex elevator, on-site laundry, fabulous picnic/BBQ area and sparkling pool. Plus, condo interiors are bright with natural light and tastefully remodeled kitchen. Balcony overlooks complex pool area and even provides a vista of the bay. It just doesn't get better than this at such a low price!
-
2026-05-06$215,000 Active 635-char remark
-
2024-04-03status Active
-
2024-04-01status Active
-
2023-12-29status Active
-
2023-10-03status Active
-
2023-09-01status Active
-
2023-08-18historical
-
2023-07-20status Active
-
2023-07-16historical Active Under Contract
-
2023-05-26status Active
-
2023-03-30$255,000 Active
-
2015-05-18soldstatus
ⓘ Source: listings_history table (triggers on properties + properties_extension) + one-shot
backfill from property_details.listing_events for pre-trigger history.
Climate risk First Street
- Flood 8/10 Severe FEMA zone AE · 99% chance over 30 yrs
- Wildfire 1/10 Low
- Heat 10/10 Extreme 8 d/yr ≥105°F today · 30 d/yr by 30 yrs out
- Wind 9/10 Extreme 99% chance of damaging wind over 30 yrs
- Air quality 2/10 Low 0 unhealthy d/yr today · 1 by 30 yrs out
Nearby sold comps map
Loading sold comps map…
Walkable amenities ~0.75 mi
Loading nearby amenities…
Taxation est. · year 1
- Rental income
- $29,079
- − Mortgage interest
- −$12,043
- − Property taxes
- −$3,225
- − Insurance
- −$6,194
- − Repairs & maintenance
- −$2,326
- − Management
- −$2,326
- − HOA
- −$3,828
- − Depreciation
- −$6,255
- Taxable loss
- −$7,118
- Est. tax savings @ 24.0%
- +$1,708
- After-tax cash flow
- $-2,095/yr
For passive investors: Depreciation is non-cash, so a rental often shows a tax loss while cash-flowing — sheltering income. Rental losses are passive: they offset passive income freely, and up to $25,000/yr can offset ordinary (W-2) income if you actively participate and your MAGI is under $100k (phasing out to $0 by $150k); unused losses carry forward. On sale, claimed depreciation is recaptured at up to 25%, and gains may owe capital-gains tax (a 1031 exchange can defer both). Figures are a year-1 estimate at your 24.0% rate — not tax advice; consult a CPA.
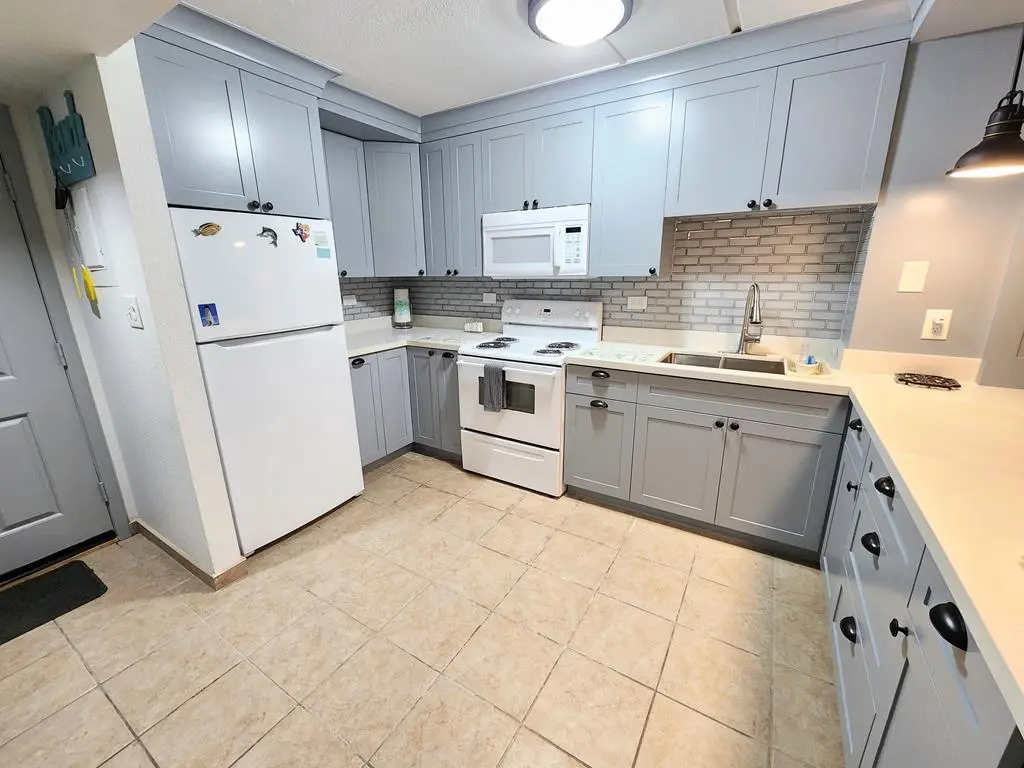
Condition & rehab AI · 1 photo
This condo requires moderate repairs and updates to improve its condition and appeal, making it a good investment for rental or resale.
Repairs flagged
- Minor kitchen cabinets — Light wear and tear.
- Minor countertops — Light wear and tear.
- Minor bathroom fixtures — Dated and possibly worn out.
- Moderate flooring — Tile flooring appears worn and may need replacement.
- Moderate paint — Paint appears faded and may need touch-up or repainting.
- Unknown HVAC system — Not shown in photos, but may need maintenance or replacement.
- Unknown landscaping — Not shown in photos, but may need improvement to enhance curb appeal.
Value-add opportunities
- Both Painting and updating fixtures — Enhances both resale and rental appeal.
- Both Replacing worn flooring — Improves both resale and rental appeal.
- Both Upgrading HVAC system — Improves comfort and energy efficiency, enhancing both resale and rental appeal.
Renovation cost estimate screening
| Repair item | Severity | Est. cost |
|---|---|---|
| kitchen cabinets · Light wear and tear. | Minor | $500–3,000 |
| countertops · Light wear and tear. | Minor | $500–3,000 |
| bathroom fixtures · Dated and possibly worn out. | Minor | $500–3,000 |
| flooring · Tile flooring appears worn and may need replacement. | Moderate | $3,000–15,000 |
| paint · Paint appears faded and may need touch-up or repainting. | Moderate | $3,000–15,000 |
| HVAC system · Not shown in photos, but may need maintenance or replacement. | Unknown | $500–3,000 |
| landscaping · Not shown in photos, but may need improvement to enhance curb appeal. | Unknown | $500–3,000 |
| Total estimated repair cost · 7 items | $8,500–45,000 |
Value-add ROI direction
- Both Painting and updating fixtures — Enhances both resale and rental appeal. ↑
- Both Replacing worn flooring — Improves both resale and rental appeal. ↑
- Both Upgrading HVAC system — Improves comfort and energy efficiency, enhancing both resale and rental appeal. ↑
ⓘ Cost ranges are severity-bucket heuristics (US national rule-of-thumb). Get contractor quotes + a written scope before underwriting a rehab budget.
Schools (NCES district)
- District
- Point Isabel ISD
- NCES district ID
- 4835250
- Math proficiency
- 14% ▼ -24.00%
- Reading proficiency
- 31% ▼ -10.00%
- Median HH income
- $38,115
- Composite
- 18.78/100
- National rank
- #8871
- State rank
- #756 of 826 in TX
Livability — South Padre Island
- Score
- 60/100
- State rank
- #1077
- US rank
- #19107
Category grades
Schools grade is shown separately in the Schools card above.
Census & demographics
- Census place
- South Padre Island, TX
- County
- Cameron County · 310,734 people
- Metro
- Brownsville-Harlingen, TX
- Population (ZIP)
- 2,935
- Household income
- $68,421
- Rent vs Own
- Severe rent burden
- 96.0
Population outlook (Cameron County) Hauer SSP2
- Today (2025)
- 441,603 people
- By 2030
- 448,113 · +1.5%
- By 2040
- 456,385 · +3.3%
- By 2050
- 456,294 · +3.3%
- By 2075
- 423,851 · -4.0%
- By 2100
- 342,787 · -22.4%
Race, ethnicity, and origin ACS 2023
- Neighborhood character
- Predominantly White (76%)
- Race & ethnicity
- White 76% Hispanic / Latino 15% Two or more races 7% Black 6% Asian 2%
- Hispanic origin (detail)
- Mexican 14%
- Common ancestry
- Slovak 5% Lithuanian 4% German 2%
- Foreign-born
- 13% · Canada
- Languages at home
- 88% English-only · Spanish 11% Other Indo-European 1%
Political lean MEDSL · Cameron
- 2024 margin
- Lean R (+5.8) · D 46.7% · R 52.5%
- 2008→2024 swing
- -34.6pp toward R · 2008: 28.8pp · 2024: -5.8pp
- All cycles
- 2024: R+5.8 2020: D+13.2 2016: D+32.5 2012: D+32.4 2008: D+28.8
Not yet ingested
- Civics
- —
Market trends
- HPI YoY
- ▼ -66.59%
- Current HPI
- 425.29
- Rent YoY
- —
- Metro
- Brownsville-Harlingen, TX
- State GDP YoY
- ▲ 3.95%
- F500 in state
- 110
Industry mix (Fortune 500 HQ in TX)
| Industry | F500 HQs | Revenue |
|---|---|---|
| Energy | 16 | $1,198B |
|
||
| Technology | 5 | $198B |
|
||
| Engineering / Construction | 4 | $72B |
|
||
| Energy Services | 3 | $60B |
|
||
| Utilities | 3 | $41B |
|
||
| Healthcare | 2 | $330B |
|
||
Price history
-15.7% since first listed15 events — show timeline
- 2026-06-05 Pending — RGVMLS
- 2026-05-26 Contingent — SPIBOR
- 2026-05-07 Listed $215,000 SPIBOR
- 2026-05-06 Listed $215,000 RGVMLS
- 2024-04-03 Relisted — SPIBOR
- 2024-04-01 Relisted — SPIBOR
- 2023-12-29 Relisted — SPIBOR
- 2023-10-03 Relisted — SPIBOR
- 2023-09-01 Relisted — SPIBOR
- 2023-08-18 Delisted — SPIBOR
- 2023-07-20 Relisted — SPIBOR
- 2023-07-16 Contingent — SPIBOR
- 2023-05-26 Relisted — SPIBOR
- 2023-03-30 Listed $255,000 SPIBOR
- 2015-05-18 Sold (MLS) — SPIBOR
Cash-flow waterfall
monthlySold comps — $/sqft
last 12 mo · ≤1 miLoading sold comps…