5361 Island Yacht Way · Sacramento, CA
Flood risk 1/10 · Minimal
- FEMA flood zone
- A99
- Chance of flooding over 30 yrs
- 0.0%
- Est. flood insurance / yr
- $1,009 – $1,996
Fire risk 6/10 · Moderate
- Est. fire insurance / yr
- $659 – $1,223
Heat risk 7/10 · Major
- Hot days now (above 103°F)
- 7 days/yr
- Hot days in 30 yrs
- 16 days/yr
Wind risk 1/10 · Minimal
- Chance of severe wind over 30 yrs
- —
Air-quality risk 10/10 · Severe
- Unhealthy air days now
- 29 days/yr
- Unhealthy air days in 30 yrs
- 30 days/yr
Risk factors via First Street. Map © Google.
Why this score? — see what drove the D- grade
The composite is a weighted blend of 9 inputs, each scored 0–100. Each bar is that input's sub-score; the figure is the points it added to the 100-point composite (weight × sub-score).
- ARV discount +12.8/15.0
- Appreciation +9.6/10.0
- Cash flow +3.9/30.0
- Livability +3.6/5.0
- Schools +3.1/10.0
- Rent growth +2.9/5.0
- Condition / age +2.5/5.0
- 1% rule +0.1/10.0
- DSCR +0.0/10.0
$675,990
🖨 Deal sheet 📄 Offer letter ✓ Due diligence
Listing remarks MLS
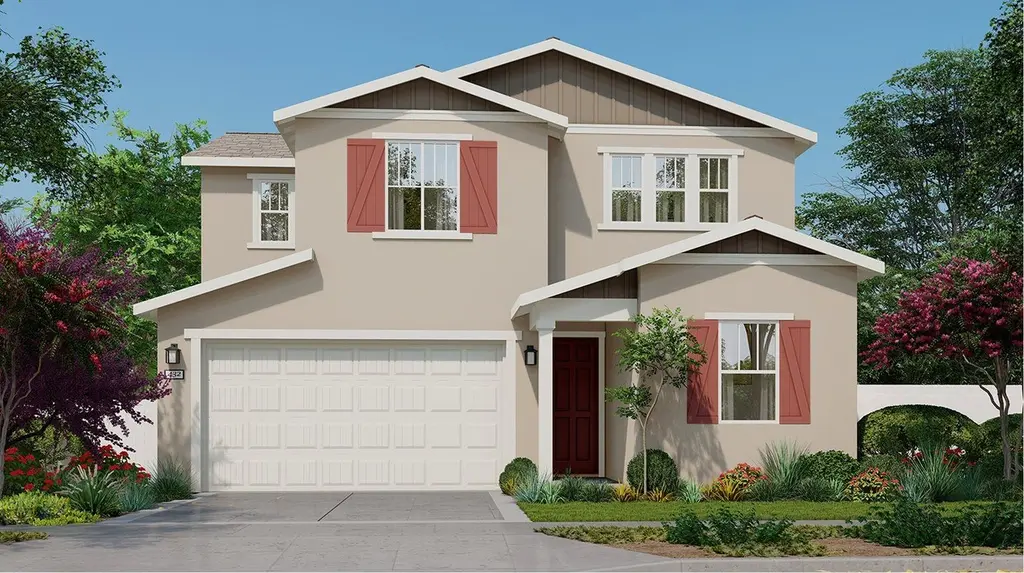
A secluded bedroom is located off the entry of this new two-story home, leading to a spacious and flexible open-concept floorplan with convenient access to the inviting California Room for outdoor entertainment. On the second floor is a versatile loft surrounded by three additional bedrooms, including the luxurious owner's suite with a spa-inspired bathroom and walk-in closet.
Key facts
- Walk-in closet
- California room
- Secluded bedroom
Tags
Neighborhood map
What this means for you Summary
Snapshot
- This is a 4-bed/3.0-bath single-family listed at $676k.
Deal economics
- At list price, monthly cash flow is $-2k ($-25k/yr) — negative.
- To cash-flow at today's rent, offer at most $380k (43.8% below list).
- To meet the 1% rule (rent ≥ 1% of price), the offer needs to be $348k (48.5% below list).
- Recommended offer: $348k (48.5% below list) — sets the bar for 1% rule.
Location & tenants
- Location reads 71/100 on livability (#218 in CA) — a middle-class / working-renter tenant base. Strengths: amenities A+, commute A+, housing A; Watch: schools D+, crime F, cost of living F.
- Twin Rivers Unified (suburban): math 29% / reading 37% proficiency, ranked #970 of 1,400 in CA (top 69%) — families likely to look elsewhere, expect single-tenant / working-renter base with shorter leases; 76% free/reduced lunch — lower-income household profile, screen leases tightly.
- Market conditions: Rents rising (+1.4%/yr); 402 active listings in the ZIP; 21 comparable units currently listed for rent nearby; rentals leasing fast (median 11d on market — plan ~1-2 weeks tenant-placement turnaround); high-income renter base; 6,825 units permitted in Sacramento County in 2024 (1,752 in 5+ unit buildings).
- This rent runs 36% of the median local income ($114k/yr) — at the standard rent-burdened threshold; future hikes will face affordability resistance.
Forward outlook
- In year one you build about $67k of equity ($5k loan paydown + $62k appreciation (9.2% local appreciation)).
- Sacramento County population projected at +17% by 2050 — long-run rental-demand tailwind backs the buy-and-hold thesis.
- By year 2, paydown + projected appreciation supports a ~$107k cash-out refi (75% LTV) — recoverable capital for the next deal without selling this one.
Negotiation context
- It's been on market 97 days — a 9% lower offer ($615k) is reasonable based on typical stale-listing flexibility.
Risks & watch-outs
- Watch-outs: flood insurance adds $125/mo.
- Climate carrying-cost: in FEMA flood zone A99 (mandatory federal flood insurance); major wildfire risk; extreme-heat days projected 7→16/yr by 2055 (HVAC capex compounding) — expect insurance premiums to compound above CPI over the hold.
Questions for the listing agent
- What do current leases actually rent for vs. the listed asking? Can we see a recent rent roll and the last 12 months of T-12 income?
- It's been on market 97 days. Have you received any prior offers? Is the seller open to a 49% concession, seller financing, or rate buy-down credit?
- What's the actual annual flood-insurance premium (NFIP or private), and is the property in a SFHA with mandatory coverage?
- Why hasn't it sold? Are there any deal-killer items the seller is aware of (foundation, flood, title, zoning, code violations)?
- Is there a deadline driving the sale (1031 exchange, divorce, estate, relocation)? That informs how much negotiation room exists.
- Schools are D-rated, which usually means shorter tenancies and higher turnover. Who's the typical renter profile here, and what's been the actual vacancy rate?
- Crime grade is F in this area — have there been break-ins, vandalism, or insurance claims at this property in the last 3 years? What carrier currently insures it and at what premium?
- The area grade is low — what's the realistic commute time and amenity access for the typical tenant pool here? Any planned neighborhood developments (good or bad) we should know about?
- What's the average days-on-market for RENTAL listings here right now (not sales)? A rising rental-DOM trend means longer vacancies and softer asking-rent achievability than the comps imply.
- What's the recent tenant-quality profile in this submarket — average credit score on applications, eviction rate, late-payment / NSF rate, and stable-employment percentage? A property-management company in the area should have these aggregated.
- How much new for-sale + rental construction is in the pipeline within 1–3 miles? Heavy new supply typically softens prices + rents 12–24 months out; constrained supply supports both.
Investment metrics
- 1% rule
- 0.51% ✗
- Cap rate
- 2.88%
- Cash-on-cash
- -12.18%
- DSCR
- 0.46
- GRM
- 16.2
CMA / ARV
- ARV (median comp)
- $766,772
- List price
- $675,990
- Delta
- -11.84%
- Verdict
- UNDERPRICED
- Comps
- 20 within 1.0 mi
Show comp detail 12 sales within ~0.75 mi
| Address | Dist | Beds/Ba | Sqft | Sold | Price | $/sf | Match |
|---|---|---|---|---|---|---|---|
| 1476 Jeannie Way | 0.28mi | 4/3.0 | 2,304 (-3%) | 1mo | $630,000 | $273 | 81 |
| 8150 Gardini Dr | 0.28mi | 4/3.0 | 2,175 (-9%) | 2mo | $787,515 | $362 | 71 |
| 3854 Watermist Way | 0.54mi | 4/3.0 | 2,307 (-3%) | 1mo | $649,500 | $282 | 68 |
| 1472 Jeannie Way | 0.28mi | 4/3.0 | 2,034 (-15%) | 0mo | $600,000 | $295 | 62 |
| 5649 Harveston Way | 0.60mi | 4/3.0 | 2,223 (-7%) | 2mo | $655,000 | $295 | 59 |
| 5743 Littlestone St | 0.73mi | 4/3.5 | 2,362 (-1%) | 5mo | $649,000 | $275 | 58 |
| 5955 Fallstaff St | 0.75mi | 4/2.5 | 2,282 (-4%) | 1mo | $680,000 | $298 | 55 |
| 3930 Waterleaf Ave | 0.59mi | 4/3.0 | 2,150 (-10%) | 2mo | $767,000 | $357 | 54 |
| 190 Hebron Cir | 0.56mi | 3/2.5 (-1) | 2,511 (+5%) | 6mo | $650,000 | $259 | 53 |
| 5913 Vantage St | 0.67mi | 4/3.0 | 2,150 (-10%) | 2mo | $665,000 | $309 | 51 |
| 3936 Waterleaf Ave | 0.59mi | 4/3.0 | 2,727 (+14%) | 3mo | $850,000 | $312 | 46 |
| 3789 Gresham Ln | 0.54mi | 5/4.0 (+1) | 2,646 (+11%) | 2mo | $730,000 | $276 | 46 |
Match score weights: distance 35% · size 25% · config 20% · recency 20%. Top-matched comps best support the ARV.
Projected returns pro-forma
9.18% appreciation · 1.43% rent growth · sell at horizon
- IRR
- 13.0%
- Equity multiple
- 2.03×
- Total profit
- $195,122
- Equity at exit
- $569,195
- IRR
- 13.0%
- Equity multiple
- 4.48×
- Total profit
- $658,940
- Equity at exit
- $1,187,476
Cash invested: $189,277 (down + closing). Projections, not guarantees.
Landlord ↔ Tenant lean methodology
- Overall (STATE)
- 18 Strongly Tenant-Friendly
- State California
- 18 Strongly Tenant-Friendly · D+13
- County
- — inherits STATE
- City
- — inherits STATE
ZIP-level market 95835
- Home prices YoY
- 3.5%
- Rents YoY
- 1.4%
- Active inventory
- 402
- Price-to-rent
- 16.2×
Monthly cashflow live
- Estimated rent
- $3,481 high interval (Pro) →
- Mortgage (P&I)
- −$3,545
- Tax est. 1.5%
- −$845 /mo · $10,140/yr
- Insurance
- −$282
- Flood insurance flood zone
- −$125 /mo · $1,502/yr
- HOA
- −$0
- Vacancy / Maint / Mgmt
- −$731
- Net cashflow
- $-2,047
Break-even live
UW: 25.0% down · 7.5% · 30yr · 1.5% tax · 5.0% vac · 8.0% maint · 8.0% mgmt
Financing live
Cash to close
- Down payment
- $168,998
- Closing costs
- $20,280
- Reserves months
- —
- Total cash needed
- —
Loan-product check · same deal, 3 products live
Conventional
25% down · 7.5% · 30yr
- Down + closing
- —
- Monthly P&I
- —
- Monthly cashflow
- —
- DSCR
- —
- Eligible?
- —
Personal DTI + credit; lowest rate.
DSCR
20% down · 8.5% · 30yr
- Down + closing
- —
- Monthly P&I
- —
- Monthly cashflow
- —
- DSCR
- —
- Eligible?
- —
No personal income docs; deal must DSCR.
Hard money
10% down · 12.0% · 12mo
- Down + closing
- —
- Monthly P&I
- —
- Monthly cashflow
- —
- DSCR
- —
- Eligible?
- —
Short-term bridge; refi at stabilization.
Rent comps 21 comps
| Address | Beds | Baths | Sqft | Rent | $/sqft | DOM | Units | Dist |
|---|---|---|---|---|---|---|---|---|
| 5342 Liberty Ship Way Sacramento, CA | 4.0 | 4.0 | 2776 | $3,650 | $1.31 | 2d | 1 | 0.07mi |
| 4096 Azul Way Sacramento, CA | 3.0 | 2.5 | 3180 | $2,800 | $0.88 | 19d | 1 | 0.37mi |
| 3766 Bayou Rd Sacramento, CA | 3.0 | 2.5 | 1660 | $2,675 | $1.61 | 44d | 1 | 0.47mi |
| 3712 Bayou Rd Sacramento, CA | 3.0 | 2.5 | 1660 | $4,000 | $2.41 | 3d | 1 | 0.54mi |
| 3606 Damora Ave Sacramento, CA | 4.0 | 3.5 | 2362 | $3,900 | $1.65 | 44d | 1 | 0.60mi |
| 4236 Bellwether Way Sacramento, CA | 4.0 | 2.5 | 2282 | $3,300 | $1.45 | 2d | 1 | 0.70mi |
| 5948 Rosalee St Sacramento, CA | 3.0 | 2.5 | 2740 | $3,095 | $1.13 | 44d | 1 | 0.71mi |
| 3530 Callison Dr Sacramento, CA | 4.0 | 2.5 | 2007 | $3,000 | $1.49 | 2d | 1 | 0.71mi |
| 5421 Shennecock Way Unit 1 Sacramento, CA | 4.0 | 2.5 | 2561 | $3,000 | $1.17 | 10d | 1 | 0.79mi |
| 3396 Shaker Way Sacramento, CA | 3.0 | 2.5 | 1815 | $3,250 | $1.79 | 12d | 1 | 0.95mi |
| 789 Greg Thatch Cir Sacramento, CA | 3.0 | 2.5 | 2000 | $2,990 | $1.50 | 3d | 1 | 0.96mi |
| 271 Vista Cove Cir Sacramento, CA | 5.0 | 3.0 | 2900 | $3,595 | $1.24 | 4d | 1 | 1.02mi |
| 11 Long Warf Pl Sacramento, CA | 3.0 | 2.5 | 1708 | $2,795 | $1.64 | 2d | 1 | 1.05mi |
| 5050 Trouville Ln Sacramento, CA | 3.0 | 2.5 | 1583 | $2,950 | $1.86 | 44d | 1 | 1.08mi |
| 5663 Lolet Way Sacramento, CA | 4.0 | 3.0 | 2630 | $3,295 | $1.25 | 2d | 1 | 1.12mi |
| 620 Candela Cir Sacramento, CA | 3.0 | 2.5 | 1681 | $2,595 | $1.54 | 44d | 1 | 1.19mi |
| 30 Sheen Ct Sacramento, CA | 3.0 | 2.5 | 1652 | $2,850 | $1.73 | 44d | 1 | 1.22mi |
| 100 Picasso Cir Sacramento, CA | 4.0 | 3.0 | 2413 | $3,950 | $1.64 | 3d | 1 | 1.35mi |
| 260 Wapello Cir Sacramento, CA | 3.0 | 3.0 | 1697 | $2,650 | $1.56 | 7d | 1 | 1.41mi |
| 3301 N Park Dr Sacramento, CA | 3.0 | 2.5 | 1678 | $2,672 | $1.59 | 44d | 2 | 1.43mi |
| 570 Wapello Cir Sacramento, CA | 3.0 | 2.5 | 1697 | $3,000 | $1.77 | 44d | 1 | 1.48mi |
Listing history 3 events
-
2026-06-01days on market $675,990 Active 97 DOM
-
2026-05-31days on market $675,990 Active 96 DOM
-
2026-02-24$695,990 Active 379-char remark
Show marketing remark (379 chars)
A secluded bedroom is located off the entry of this new two-story home, leading to a spacious and flexible open-concept floorplan with convenient access to the inviting California Room for outdoor entertainment. On the second floor is a versatile loft surrounded by three additional bedrooms, including the luxurious owner's suite with a spa-inspired bathroom and walk-in closet.
ⓘ Source: listings_history table (triggers on properties + properties_extension) + one-shot
backfill from property_details.listing_events for pre-trigger history.
Climate risk First Street
- Flood 1/10 Low FEMA zone A99 · 0% chance over 30 yrs
- Wildfire 6/10 Major
- Heat 7/10 Severe 7 d/yr ≥103°F today · 16 d/yr by 30 yrs out
- Wind 1/10 Low
- Air quality 10/10 Extreme 29 unhealthy d/yr today · 30 by 30 yrs out
Nearby sold comps map
Loading sold comps map…
Walkable amenities ~0.75 mi
Loading nearby amenities…
Taxation est. · year 1
- Rental income
- $41,775
- − Mortgage interest
- −$37,866
- − Property taxes
- −$10,140
- − Insurance
- −$4,882
- − Repairs & maintenance
- −$3,342
- − Management
- −$3,342
- − Depreciation
- −$19,665
- Taxable loss
- −$37,463
- Est. tax savings @ 24.0%
- +$8,991
- After-tax cash flow
- $-15,569/yr
For passive investors: Depreciation is non-cash, so a rental often shows a tax loss while cash-flowing — sheltering income. Rental losses are passive: they offset passive income freely, and up to $25,000/yr can offset ordinary (W-2) income if you actively participate and your MAGI is under $100k (phasing out to $0 by $150k); unused losses carry forward. On sale, claimed depreciation is recaptured at up to 25%, and gains may owe capital-gains tax (a 1031 exchange can defer both). Figures are a year-1 estimate at your 24.0% rate — not tax advice; consult a CPA.
Schools (NCES district)
- District
- Twin Rivers Unified
- NCES district ID
- 0601332
- Math proficiency
- 29% ▲ 2.00%
- Reading proficiency
- 37% ▲ 2.00%
- Median HH income
- $42,481
- Composite
- 30.67/100
- National rank
- #11437
- State rank
- #970 of 1400 in CA
Livability — Sacramento
- Score
- 71/100
- State rank
- #218
- US rank
- #6957
Category grades
Schools grade is shown separately in the Schools card above.
Census & demographics
- Census place
- Sacramento, CA
- County
- Sacramento County · 1,539,646 people
- City population
- 761,410
- Metro
- Sacramento-Roseville-Folsom, CA
- Population (ZIP)
- 42,004
- Household income
- $114,468
- Rent vs Own
- Severe rent burden
- 1234.0
Population outlook (Sacramento County) Hauer SSP2
- Today (2025)
- 1,660,763 people
- By 2030
- 1,732,990 · +4.3%
- By 2040
- 1,855,755 · +11.7%
- By 2050
- 1,941,335 · +16.9%
- By 2075
- 2,046,162 · +23.2%
- By 2100
- 1,961,444 · +18.1%
Race, ethnicity, and origin ACS 2023
- Neighborhood character
- Highly diverse neighborhood (Simpson 0.78)
- Race & ethnicity
- Asian 30% White 29% Hispanic / Latino 19% Two or more races 15% Black 13%
- Hispanic origin (detail)
- Mexican 15%
- Common ancestry
- Scotch-Irish 2% Italian 1% Romanian 1%
- Foreign-born
- 25% · China, Canada, Vietnam
- Languages at home
- 66% English-only · Other Indo-European 10% Spanish 8% Other Asian/Pacific 4%
Political lean MEDSL · Sacramento
- 2024 margin
- D (+19.7) · D 58.1% · R 38.4% · Other 3.5%
- 2008→2024 swing
- +0.7pp no change · 2008: 19.0pp · 2024: 19.7pp
- All cycles
- 2024: D+19.7 2020: D+25.3 2016: D+23.7 2012: D+16.3 2008: D+19.0
Not yet ingested
- Civics
- —
Market trends
- HPI YoY
- ▲ 9.18%
- Current HPI
- 271.4823
- Rent YoY
- ▲ 1.43%
- Metro
- Sacramento-Roseville-Folsom, CA
- State GDP YoY
- ▲ 3.21%
- F500 in state
- 116
Industry mix (Fortune 500 HQ in CA)
| Industry | F500 HQs | Revenue |
|---|---|---|
| Technology | 27 | $1,492B |
|
||
| Financial Services | 3 | $174B |
|
||
| Retail | 3 | $44B |
|
||
| Insurance | 3 | $26B |
|
||
| Media / Entertainment | 2 | $115B |
|
||
| Pharmaceuticals / Biotech | 2 | $62B |
|
||
Price history
1 event — show timeline
- 2026-02-24 Listed $695,990 Zillow
Cash-flow waterfall
monthlySold comps — $/sqft
last 12 mo · ≤1 miLoading sold comps…