255 Aileen Dr · Columbus, MS
Flood risk 1/10 · Minimal
- FEMA flood zone
- X (unshaded)
- Chance of flooding over 30 yrs
- 0.0%
- Est. flood insurance / yr
- $507 – $1,088
Fire risk 2/10 · Minimal
- Est. fire insurance / yr
- $1,241 – $2,305
Heat risk 7/10 · Major
- Hot days now (above 109°F)
- 7 days/yr
- Hot days in 30 yrs
- 21 days/yr
Wind risk 6/10 · Moderate
- Chance of severe wind over 30 yrs
- 48.0%
Air-quality risk 1/10 · Minimal
- Unhealthy air days now
- 0 days/yr
- Unhealthy air days in 30 yrs
- 0 days/yr
Risk factors via First Street. Map © Google.
Why this score? — see what drove the D grade
The composite is a weighted blend of 9 inputs, each scored 0–100. Each bar is that input's sub-score; the figure is the points it added to the 100-point composite (weight × sub-score).
- Cash flow +15.2/30.0
- ARV discount +7.5/15.0
- DSCR +4.7/10.0
- 1% rule +3.7/10.0
- Livability +3.0/5.0
- Rent growth +2.5/5.0
- Condition / age +2.5/5.0
- Schools +1.0/10.0
- Appreciation +0.0/10.0
$289,000
🖨 Deal sheet 📄 Offer letter ✓ Due diligence
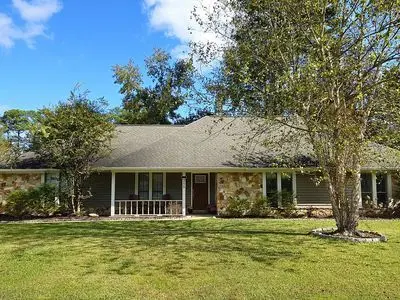
Listing remarks
Located just minutes north of Columbus, this beautiful, move-in-ready home is nestled in the family-friendly Sherwood Forest neighborhood. At nearly 2,100 square feet, the home boasts an oversized family room with vaulted ceilings, a sunroom overlooking a fenced-in back yard, and a fully renovated master bathroom/walk-in closet. You & acirc; & euro; & trade; ll find ample storage between the finished 2-car garage, utility room, storage loft, and a brand-new 8 & acirc; & euro; & trade; x12 & acirc; & euro; & trade; shed. Columbus Air Force Base is an easy 10-minute commute away, and you are a short drive from Golden Triangle Regional Airport, which offers
Key facts
- Built 1981
Neighborhood map
What this means for you Summary
Snapshot
- This is a 3-bed/1.0-bath single-family listed at $289k.
Deal economics
- At list price, monthly cash flow is $99 ($1k/yr) — positive.
- The deal already cash-flows at list — no discount required.
- To meet the 1% rule (rent ≥ 1% of price), the offer needs to be $250k (13.5% below list).
- Recommended offer: $250k (13.5% below list) — sets the bar for 1% rule.
Location & tenants
- Location reads 60/100 on livability (#219 in MS) — a middle-class / working-renter tenant base. Strengths: cost of living A+, housing A, crime B+; Watch: health & safety D, schools F, amenities F.
- Columbus Municipal School District (town): math 9% / reading 17% proficiency, ranked #113 of 130 in MS (top 87%) — low school quality limits family demand, transient renter base, plan for 1-2y turnover; 84% free/reduced lunch — lower-income household profile, screen leases tightly.
- Market conditions: 13 active listings in the ZIP; 1 comparable units currently listed for rent nearby; 130 units permitted in Lowndes County in 2024 (0 in 5+ unit buildings).
Forward outlook
- Local home prices are declining (-3.0%/yr); year-one equity from $2k of loan paydown is wiped out by about $9k of value loss. Plan a longer hold.
- Lowndes County population projected to shrink 9% by 2050 — rents likely to lag national; underwrite the cash flow, not the appreciation.
Negotiation context
- Only 0 days on market — expect competitive offers; lowballing is unlikely to land.
- Current owner paid $154k; list at $289k implies a 88% gain — meaningful room to come down on a strong offer.
Risks & watch-outs
- Climate carrying-cost: major wind risk, 48% chance of damaging wind over 30y; extreme-heat days projected 7→21/yr by 2055 (HVAC capex compounding) — expect insurance premiums to compound above CPI over the hold.
Questions for the listing agent
- Is there a deadline driving the sale (1031 exchange, divorce, estate, relocation)? That informs how much negotiation room exists.
- Schools are F-rated, which usually means shorter tenancies and higher turnover. Who's the typical renter profile here, and what's been the actual vacancy rate?
- The area grade is low — what's the realistic commute time and amenity access for the typical tenant pool here? Any planned neighborhood developments (good or bad) we should know about?
- What's the average days-on-market for RENTAL listings here right now (not sales)? A rising rental-DOM trend means longer vacancies and softer asking-rent achievability than the comps imply.
- What's the recent tenant-quality profile in this submarket — average credit score on applications, eviction rate, late-payment / NSF rate, and stable-employment percentage? A property-management company in the area should have these aggregated.
- How much new for-sale + rental construction is in the pipeline within 1–3 miles? Heavy new supply typically softens prices + rents 12–24 months out; constrained supply supports both.
Investment metrics
- 1% rule
- 0.87% ✗
- Cap rate
- 6.70%
- Cash-on-cash
- 1.47%
- DSCR
- 1.07
- GRM
- 9.6
CMA / ARV
No comps found within radius.
Projected returns pro-forma
-3.0% appreciation · 3.0% rent growth · sell at horizon
- IRR
- -14.0%
- Equity multiple
- 0.50×
- Total profit
- $-40,558
- Equity at exit
- $43,091
- IRR
- -5.2%
- Equity multiple
- 0.66×
- Total profit
- $-27,343
- Equity at exit
- $24,987
Cash invested: $80,920 (down + closing). Projections, not guarantees.
Landlord ↔ Tenant lean methodology
- Overall (STATE)
- 90 Strongly Landlord-Friendly
- State Mississippi
- 90 Strongly Landlord-Friendly · R+11
- County
- — inherits STATE
- City
- — inherits STATE
ZIP-level market 39705
- Home prices YoY
- -14.8%
- Active inventory
- 13
- Price-to-rent
- 9.6×
Monthly cashflow live
- Estimated rent
- $2,500 medium interval (Pro) →
- Mortgage (P&I)
- −$1,516
- Tax from tax record
- −$240 /mo · $2,880/yr
- Insurance
- −$120
- HOA
- −$0
- Vacancy / Maint / Mgmt
- −$525
- Net cashflow
- $99
Break-even live
UW: 25.0% down · 7.5% · 30yr · 1.5% tax · 5.0% vac · 8.0% maint · 8.0% mgmt
Financing live
Cash to close
- Down payment
- $72,250
- Closing costs
- $8,670
- Reserves months
- —
- Total cash needed
- —
Loan-product check · same deal, 3 products live
Conventional
25% down · 7.5% · 30yr
- Down + closing
- —
- Monthly P&I
- —
- Monthly cashflow
- —
- DSCR
- —
- Eligible?
- —
Personal DTI + credit; lowest rate.
DSCR
20% down · 8.5% · 30yr
- Down + closing
- —
- Monthly P&I
- —
- Monthly cashflow
- —
- DSCR
- —
- Eligible?
- —
No personal income docs; deal must DSCR.
Hard money
10% down · 12.0% · 12mo
- Down + closing
- —
- Monthly P&I
- —
- Monthly cashflow
- —
- DSCR
- —
- Eligible?
- —
Short-term bridge; refi at stabilization.
Rent comps 1 comps
| Address | Beds | Baths | Sqft | Rent | $/sqft | DOM | Units | Dist |
|---|---|---|---|---|---|---|---|---|
| 89 Sir Henry Dr Columbus, MS | 3.0 | 2.0 | 2451 | $2,500 | $1.02 | 43d | 1 | 0.36mi |
Listing history 7 events
-
2026-05-26$289,000
-
2023-05-19soldstatus
-
2020-02-13soldstatus
-
2016-08-31soldstatus
-
2012-09-04soldstatus
-
2009-03-16soldstatus $154,000
-
2004-05-14soldstatus
ⓘ Source: listings_history table (triggers on properties + properties_extension) + one-shot
backfill from property_details.listing_events for pre-trigger history.
Tax reassessment forecast MS · Resets to sale price
- Current annual tax
- $2,880 · $240/mo
- Projected year-2 tax
- $2,880 · $240/mo
- Expected delta
- $0/yr ($0/mo · 0.0%)
ⓘ Screening estimate from a state-policy table — verify with the county assessor before closing.
Climate risk First Street
- Flood 1/10 Low FEMA zone X (unshaded) · 0% chance over 30 yrs
- Wildfire 2/10 Low
- Heat 7/10 Severe 7 d/yr ≥109°F today · 21 d/yr by 30 yrs out
- Wind 6/10 Major 48% chance of damaging wind over 30 yrs
- Air quality 1/10 Low 0 unhealthy d/yr today · 0 by 30 yrs out
Nearby sold comps map
Loading sold comps map…
Walkable amenities ~0.75 mi
Loading nearby amenities…
Taxation est. · year 1
- Rental income
- $30,000
- − Mortgage interest
- −$16,188
- − Property taxes
- −$2,880
- − Insurance
- −$1,445
- − Repairs & maintenance
- −$2,400
- − Management
- −$2,400
- − Depreciation
- −$8,407
- Taxable loss
- −$3,721
- Est. tax savings @ 24.0%
- +$893
- After-tax cash flow
- $2,082/yr
For passive investors: Depreciation is non-cash, so a rental often shows a tax loss while cash-flowing — sheltering income. Rental losses are passive: they offset passive income freely, and up to $25,000/yr can offset ordinary (W-2) income if you actively participate and your MAGI is under $100k (phasing out to $0 by $150k); unused losses carry forward. On sale, claimed depreciation is recaptured at up to 25%, and gains may owe capital-gains tax (a 1031 exchange can defer both). Figures are a year-1 estimate at your 24.0% rate — not tax advice; consult a CPA.
Schools (NCES district)
- District
- Columbus Municipal School District
- NCES district ID
- 2801200
- Math proficiency
- 9% ▼ -11.00%
- Reading proficiency
- 17% ▼ -6.00%
- Median HH income
- $33,376
- Composite
- 10.49/100
- National rank
- #9782
- State rank
- #113 of 130 in MS
Livability — Columbus
- Score
- 60/100
- State rank
- #219
- US rank
- #18952
Category grades
Schools grade is shown separately in the Schools card above.
Census & demographics
- City population
- 35,442
- Population (ZIP)
- 12,195
Population outlook (Lowndes County) Hauer SSP2
- Today (2025)
- 59,842 people
- By 2030
- 59,312 · -0.9%
- By 2040
- 57,282 · -4.3%
- By 2050
- 54,348 · -9.2%
- By 2075
- 45,423 · -24.1%
- By 2100
- 34,724 · -42.0%
Race, ethnicity, and origin ACS 2023
- Neighborhood character
- Diverse neighborhood (Simpson 0.56)
- Race & ethnicity
- White 61% Black 26% Two or more races 5% Hispanic / Latino 4% Asian 3%
- Common ancestry
- Serbian 1% Romanian 1% Slovak 1%
- Foreign-born
- 6% · Canada
- Languages at home
- 94% English-only · Other Indo-European 2% Spanish 2% Tagalog/Filipino 1%
Political lean MEDSL · Lowndes
- 2024 margin
- Lean R (+8.2) · D 45.4% · R 53.6%
- 2008→2024 swing
- -5.3pp toward R · 2008: -2.9pp · 2024: -8.2pp
- All cycles
- 2024: R+8.2 2020: R+2.6 2016: R+6.3 2012: R+1.5 2008: R+2.9
Not yet ingested
- Civics
- —
Market trends
- HPI YoY
- ▼ -30.83%
- Current HPI
- 176.841
- Rent YoY
- —
- Metro
- —
- State GDP YoY
- —
- F500 in state
- 0
Price history
+87.7% since first listed7 events — show timeline
- 2026-05-26 Listed $289,000 FSBO.com
- 2023-05-19 Sold (Public Records) — Public Records
- 2020-02-13 Sold (Public Records) — Public Records
- 2016-08-31 Sold (Public Records) — Public Records
- 2012-09-04 Sold (Public Records) — Public Records
- 2009-03-16 Sold (Public Records) $154,000 Public Records
- 2004-05-14 Sold (Public Records) — Public Records
Property tax history
+10.3%/yrLatest (2025): $2,880 · +1.8% YoY. Source: county tax records.
Cash-flow waterfall
monthlySold comps — $/sqft
last 12 mo · ≤1 miLoading sold comps…