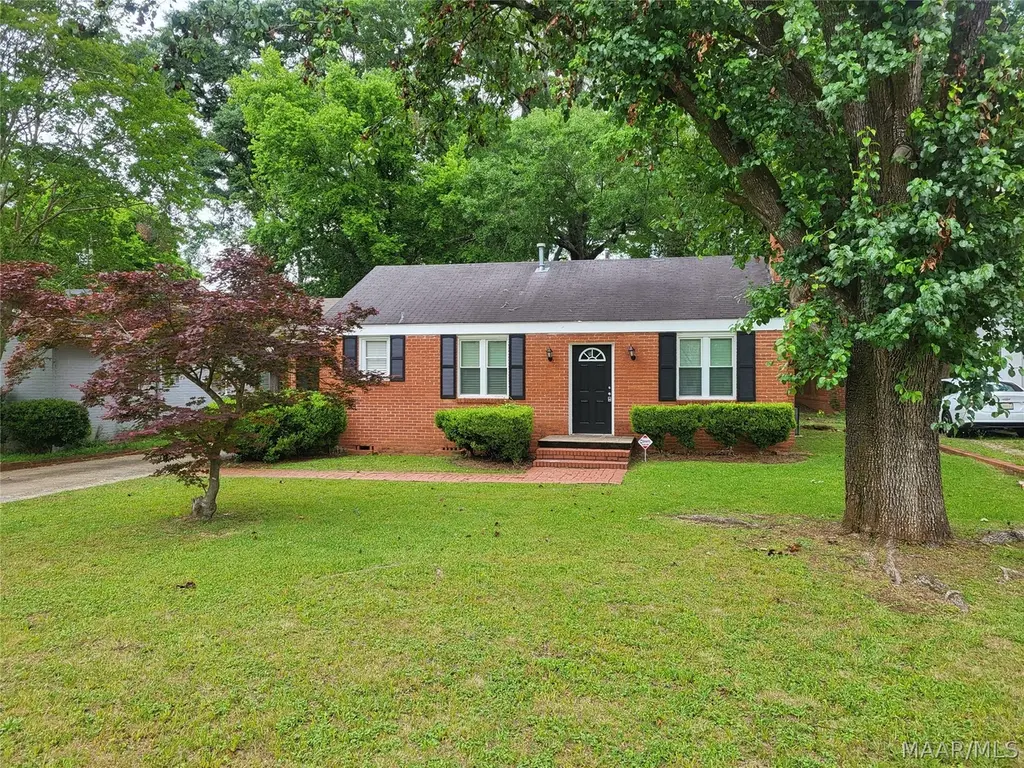
1933 Bullard St · Montgomery, AL
Flood risk 4/10 · Minor
- FEMA flood zone
- X (unshaded)
- Chance of flooding over 30 yrs
- 0.2%
- Est. flood insurance / yr
- $507 – $1,088
Fire risk 1/10 · Minimal
- Est. fire insurance / yr
- $916 – $1,700
Heat risk 7/10 · Major
- Hot days now (above 107°F)
- 7 days/yr
- Hot days in 30 yrs
- 20 days/yr
Wind risk 8/10 · Major
- Chance of severe wind over 30 yrs
- 80.0%
Air-quality risk 3/10 · Minor
- Unhealthy air days now
- 4 days/yr
- Unhealthy air days in 30 yrs
- 4 days/yr
Risk factors via First Street. Map © Google.
Why this score? — see what drove the C grade
The composite is a weighted blend of 9 inputs, each scored 0–100. Each bar is that input's sub-score; the figure is the points it added to the 100-point composite (weight × sub-score).
- Cash flow +28.9/30.0
- DSCR +10.0/10.0
- 1% rule +7.2/10.0
- Rent growth +4.1/5.0
- Livability +3.2/5.0
- Condition / age +2.5/5.0
- Schools +1.7/10.0
- ARV discount +0.0/15.0
- Appreciation +0.0/10.0
$85,300
🖨 Deal sheet 📄 Offer letter ✓ Due diligence
Listing remarks
Welcome to this charming 2-bedroom, 1-bath home located in a prime area of Montgomery! Whether you’re looking for a cozy primary residence or a smart investment opportunity, this property offers flexibility and potential. This home features a functional layout with natural light throughout and sits on a spacious lot. Built in 1951, it carries character and charm while offering the opportunity to make it your own. The crawl space allows for easier access and maintenance. This property offers immediate income potential for investors or a great opportunity for a first time home buyer looking to offset expenses. Conveniently located to midtown downtown and all that Montgomery has to offer
Key facts
- Easy access
- Crawl space
- Natural light
Tags
Property features AI
Exterior
- Parking: Driveway; 2-car garage
- Utilities: Public water; Public sewer; Electricity available; Cable available; High-speed internet available
- Home design: Single-story; Brick, block, and concrete construction
- Construction: Built (year source: public records); Brick, block and concrete construction
- Exterior features: Storage; Workshop; City lot; Lot approximately 50 x 50
Interior
- Flooring: Carpet; Plank; Vinyl
- Bathrooms: 1 full bathroom
- Heating & cooling: Central heating (electric, heat pump); Central electric cooling
- Interior features: Storage; Storm shelter; See remarks
- Laundry & utility: Water heater
Neighborhood map
What this means for you Summary
Snapshot
- This is a 2-bed/1.0-bath single-family listed at $85k.
Deal economics
- At list price, monthly cash flow is $291 ($3k/yr) — positive.
- The deal already cash-flows at list — no discount required.
- Meets the 1% rule at list price ($1k rent vs $85k).
- Recommended offer: $83k (3.0% below list) — sets the bar for market timing.
- Cap rate 10.4% vs local median 6.0% in Montgomery — top-decile yield for the area; either an underpriced asset or a hidden risk that comps aren't pricing in. Stress-test before assuming the spread holds.
Location & tenants
- Location reads 65/100 on livability (#138 in AL) — a middle-class / working-renter tenant base. Strengths: cost of living A+, housing A+; Watch: schools C-, employment D, crime F.
- Montgomery County (urban): math 9% / reading 31% proficiency, ranked #106 of 129 in AL (top 82%) — low school quality limits family demand, transient renter base, plan for 1-2y turnover; 70% free/reduced lunch — lower-income household profile, screen leases tightly.
- Market conditions: Rents rising fast (+6.3%/yr); 137 active listings in the ZIP; 38 comparable units currently listed for rent nearby; rentals at typical pace (median 21d on market — plan ~3-4 weeks tenant-placement turnaround); 45% of comp listings sitting > 30 days — soft ceiling on asking rent; 460 units permitted in Montgomery County in 2024 (37 in 5+ unit buildings).
Forward outlook
- Local home prices are declining (-3.0%/yr); year-one equity from $590 of loan paydown is wiped out by about $3k of value loss. Plan a longer hold.
- Montgomery County population projected to shrink 8% by 2050 — rents likely to lag national; underwrite the cash flow, not the appreciation.
- At projected returns (-3.0% appreciation + 6.3% rent growth), your $24k cash investment doubles in ~7 years — after that, you're playing with house money.
Negotiation context
- It's been on market 49 days — a 3% lower offer ($83k) is reasonable based on typical stale-listing flexibility.
- 5 sale attempts since 28y ago; this cycle's ask has dropped $8k (8%) from the opening price — seller is motivated, your offer sets the floor, not the list.
- Current owner paid $58k; 47% above their basis — modest negotiation headroom, anchor on the comps not their cost.
Risks & watch-outs
- Watch-outs: built in 1951 — expect roof / HVAC / electrical / plumbing capex.
- Climate carrying-cost: severe wind risk, 80% chance of damaging wind over 30y; extreme-heat days projected 7→20/yr by 2055 (HVAC capex compounding) — expect insurance premiums to compound above CPI over the hold.
Questions for the listing agent
- It's been on market 49 days. Have you received any prior offers? Is the seller open to a 3% concession, seller financing, or rate buy-down credit?
- Built in 1951 — when were the roof, HVAC, electrical panel, plumbing, and water heater last replaced?
- Is there a deadline driving the sale (1031 exchange, divorce, estate, relocation)? That informs how much negotiation room exists.
- Crime grade is F in this area — have there been break-ins, vandalism, or insurance claims at this property in the last 3 years? What carrier currently insures it and at what premium?
- What's the average days-on-market for RENTAL listings here right now (not sales)? A rising rental-DOM trend means longer vacancies and softer asking-rent achievability than the comps imply.
- What's the recent tenant-quality profile in this submarket — average credit score on applications, eviction rate, late-payment / NSF rate, and stable-employment percentage? A property-management company in the area should have these aggregated.
- How much new for-sale + rental construction is in the pipeline within 1–3 miles? Heavy new supply typically softens prices + rents 12–24 months out; constrained supply supports both.
Investment metrics
- 1% rule
- 1.22% ✓
- Cap rate
- 10.38%
- Cash-on-cash
- 14.60%
- DSCR
- 1.65
- GRM
- 6.8
CMA / ARV
- ARV (median comp)
- $62,750
- List price
- $85,300
- Delta
- 35.94%
- Verdict
- OVERPRICED
- Comps
- 20 within 1.0 mi
Show comp detail 5 sales within ~0.75 mi
| Address | Dist | Beds/Ba | Sqft | Sold | Price | $/sf | Match |
|---|---|---|---|---|---|---|---|
| 2339 Sixth St E | 0.10mi | 3/1.0 (+1) | 858 (-6%) | 22mo | $60,000 | $70 | 62 |
| 1224 Ryan St | 0.48mi | 2/1.0 | 841 (-8%) | 12mo | $40,000 | $48 | 54 |
| 2505 Bay St | 0.49mi | 2/1.0 | 800 (-12%) | 11mo | $45,000 | $56 | 48 |
| 1808 Pinecrest Dr | 0.51mi | 3/1.0 (+1) | 1,026 (+13%) | 14mo | $66,000 | $64 | 39 |
| 2315 Chestnut St | 0.56mi | 2/1.0 | 776 (-15%) | 16mo | $49,900 | $64 | 36 |
Match score weights: distance 35% · size 25% · config 20% · recency 20%. Top-matched comps best support the ARV.
Projected returns pro-forma
-3.0% appreciation · 6.29% rent growth · sell at horizon
- IRR
- 8.5%
- Equity multiple
- 1.34×
- Total profit
- $8,216
- Equity at exit
- $12,719
- IRR
- 20.2%
- Equity multiple
- 2.95×
- Total profit
- $46,509
- Equity at exit
- $7,375
Cash invested: $23,884 (down + closing). Projections, not guarantees.
Landlord ↔ Tenant lean methodology
- Overall (STATE)
- 90 Strongly Landlord-Friendly
- State Alabama
- 90 Strongly Landlord-Friendly · R+15
- County
- — inherits STATE
- City
- — inherits STATE
ZIP-level market 36106
- Home prices YoY
- -13.1%
- Rents YoY
- 6.3%
- Active inventory
- 137
- Price-to-rent
- 6.8×
Monthly cashflow live
- Estimated rent
- $1,040 high interval (Pro) →
- Mortgage (P&I)
- −$447
- Tax from tax record
- −$48 /mo · $576/yr
- Insurance
- −$36
- HOA
- −$0
- Vacancy / Maint / Mgmt
- −$218
- Net cashflow
- $291
Break-even live
UW: 25.0% down · 7.5% · 30yr · 1.5% tax · 5.0% vac · 8.0% maint · 8.0% mgmt
Financing live
Cash to close
- Down payment
- $21,325
- Closing costs
- $2,559
- Reserves months
- —
- Total cash needed
- —
Loan-product check · same deal, 3 products live
Conventional
25% down · 7.5% · 30yr
- Down + closing
- —
- Monthly P&I
- —
- Monthly cashflow
- —
- DSCR
- —
- Eligible?
- —
Personal DTI + credit; lowest rate.
DSCR
20% down · 8.5% · 30yr
- Down + closing
- —
- Monthly P&I
- —
- Monthly cashflow
- —
- DSCR
- —
- Eligible?
- —
No personal income docs; deal must DSCR.
Hard money
10% down · 12.0% · 12mo
- Down + closing
- —
- Monthly P&I
- —
- Monthly cashflow
- —
- DSCR
- —
- Eligible?
- —
Short-term bridge; refi at stabilization.
Rent comps 38 comps
| Address | Beds | Baths | Sqft | Rent | $/sqft | DOM | Units | Dist |
|---|---|---|---|---|---|---|---|---|
| 2205 E 5th St Montgomery, AL | 3.0 | 1.0 | 1020 | $800 | $0.78 | 43d | 1 | 0.21mi |
| 2454 Spruce Curv Montgomery, AL | 3.0 | 1.0 | 988 | $1,100 | $1.11 | 43d | 1 | 0.31mi |
| 1732 West St Unit 1732 A Montgomery, AL | 1.0 | 1.0 | 715 | $1,375 | $1.92 | 43d | 1 | 0.37mi |
| 1493 Watson St Montgomery, AL | 1.0 | 1.0 | 1066 | $900 | $0.84 | 21d | 1 | 0.37mi |
| 1491 Watson St Montgomery, AL | 1.0 | 1.0 | 1066 | $900 | $0.84 | 21d | 1 | 0.37mi |
| 1487 Watson St Montgomery, AL | 1.0 | 1.0 | 1066 | $875 | $0.82 | 21d | 1 | 0.37mi |
| 1513 Rex St Montgomery, AL | 1.0 | 1.0 | 840 | $1,095 | $1.30 | 43d | 1 | 0.39mi |
| 1915 Walnut St Ste B Montgomery, AL | 1.0 | 1.0 | 950 | $950 | $1.00 | 43d | 1 | 0.42mi |
| 2642 E 3rd St Unit EA2676 Montgomery, AL | 1.0 | 1.0 | 604 | $800 | $1.32 | 21d | 1 | 0.49mi |
| 1814 Pinecrest Dr Montgomery, AL | 3.0 | 1.0 | 1053 | $990 | $0.94 | 43d | 1 | 0.50mi |
| 2166 College St Montgomery, AL | 1.0 | 1.0 | 700 | $775 | $1.11 | 13d | 1 | 0.52mi |
| 1347 Felder Ave Montgomery, AL | 2.0 | 1.0 | 1000 | $1,095 | $1.09 | 13d | 1 | 0.57mi |
| 1343 Felder Ave Montgomery, AL | 2.0 | 1.0 | 1000 | $1,095 | $1.09 | 13d | 1 | 0.57mi |
| 2736 Chevy Chase Dr Montgomery, AL | 3.0 | 1.0 | 1100 | $1,300 | $1.18 | 43d | 1 | 0.59mi |
| 2000 Cherry St Montgomery, AL | 2.0 | 1.0 | 1106 | $950 | $0.86 | 43d | 1 | 0.79mi |
| 2845 Zelda Rd Montgomery, AL | 2.0 | 2.0 | 1013 | $1,042 | $1.03 | 13d | 3 | 0.80mi |
| 2300 Plum St Unit 2302 Montgomery, AL | 1.0 | 1.0 | 656 | $700 | $1.07 | 13d | 1 | 0.82mi |
| 2302 Plum St Montgomery, AL | 1.0 | 1.0 | 656 | $700 | $1.07 | 13d | 1 | 0.84mi |
| 2727 Boultier St Montgomery, AL | 1.0–3.0 | 1.0–2.0 | 1070 | $1,508 | $1.41 | 13d | 3 | 0.86mi |
| 1834 Highland Ave Unit A Montgomery, AL | 1.0 | 1.0 | 980 | $1,250 | $1.28 | 43d | 1 | 0.96mi |
| 2405 Palmetto St Unit B Montgomery, AL | 1.0 | 1.0 | 550 | $750 | $1.36 | 13d | 1 | 1.01mi |
| 906 E Fairview Ave Unit 902 Montgomery, AL | 2.0 | 1.0 | 1100 | $995 | $0.90 | 21d | 1 | 1.12mi |
| 1020 Pershing St Unit D Montgomery, AL | 1.0 | 1.0 | 750 | $600 | $0.80 | 21d | 1 | 1.22mi |
| 329 S Capitol Pkwy Apt A Montgomery, AL | 1.0 | 1.0 | 800 | $645 | $0.81 | 43d | 1 | 1.24mi |
| 311 Bradley Dr Montgomery, AL | 3.0 | 1.0 | 1104 | $825 | $0.75 | 43d | 1 | 1.26mi |
| 945 E Edgemont Ave Unit 951 Montgomery, AL | 2.0 | 1.0 | 841 | $750 | $0.89 | 43d | 1 | 1.28mi |
| 951 E Edgemont Ave Montgomery, AL | 2.0 | 1.0 | 841 | $750 | $0.89 | 43d | 1 | 1.29mi |
| 429 Felder Ave Montgomery, AL | 1.0 | 1.0 | 1000 | $1,075 | $1.07 | 13d | 1 | 1.30mi |
| 301 Bradley Dr Montgomery, AL | 2.0 | 1.0 | 841 | $935 | $1.11 | 13d | 1 | 1.31mi |
| 603 Hubbard Ave Unit A Montgomery, AL | 1.0 | 1.0 | 954 | $950 | $1.00 | 21d | 1 | 1.36mi |
| 319 Olivia Ct Montgomery, AL | 2.0 | 1.0 | 850 | $700 | $0.82 | 21d | 1 | 1.36mi |
| 1154 Lakewood Dr Montgomery, AL | 3.0 | 2.0 | 1066 | $1,350 | $1.27 | 43d | 1 | 1.41mi |
| 1827 Capitol Ave Montgomery, AL | 2.0 | 1.0 | 1068 | $1,600 | $1.50 | 13d | 1 | 1.44mi |
| 1827 Capitol Ave Montgomery, AL | 2.0 | 1.0 | 1068 | $1,600 | $1.50 | 43d | 1 | 1.44mi |
| 122 Oak Forest Dr Montgomery, AL | 3.0 | 1.0 | 1092 | $975 | $0.89 | 21d | 1 | 1.45mi |
| 432 Clanton Ave Montgomery, AL | 2.0 | 1.0 | 800 | $995 | $1.24 | 13d | 1 | 1.46mi |
| 329 Cloverdale Rd Montgomery, AL | 1.0 | 1.0 | 850 | $725 | $0.85 | 43d | 1 | 1.46mi |
| 3456 Harrison Rd Montgomery, AL | 3.0 | 1.0 | 1008 | $1,300 | $1.29 | 43d | 1 | 1.46mi |
Listing history 26 events
-
2026-06-18days on market $85,300 Active 49 DOM
-
2026-06-17days on market $85,300 Active 48 DOM
-
2026-06-16pricedays on market $85,300 Active 47 DOM
-
2026-06-15days on market $86,900 Active 46 DOM
-
2026-06-14days on market $86,900 Active 44 DOM
-
2026-06-13days on market $86,900 Active 43 DOM
-
2026-06-10days on market $86,900 Active 41 DOM
-
2026-06-09days on market $86,900 Active 40 DOM
-
2026-06-08days on market $86,900 Active 39 DOM
-
2026-06-07days on market $86,900 Active 38 DOM
-
2026-06-03pricedays on market $86,900 Active 34 DOM
-
2026-06-02days on market $87,900 Active 33 DOM
-
2026-06-01pricedays on market $87,900 Active 32 DOM
-
2026-05-31days on market $89,000 Active 31 DOM
-
2026-05-30days on market $89,000 Active 30 DOM
-
2026-05-04price $91,900 838-char remark
-
2026-04-30$92,900 Active 838-char remark
-
2026-02-19price $84,900
-
2025-09-27price $99,900
-
2025-05-12price $109,000
-
2025-05-01status Active
-
2025-04-18historical Contingent
-
2025-03-10$115,000 Active
-
2022-05-02$40,000
-
1999-08-13soldstatus $57,950
-
1998-05-08$59,900
ⓘ Source: listings_history table (triggers on properties + properties_extension) + one-shot
backfill from property_details.listing_events for pre-trigger history.
Tax reassessment forecast AL · Resets to sale price
- Current annual tax
- $576 · $48/mo
- Projected year-2 tax
- $576 · $48/mo
- Expected delta
- $0/yr ($0/mo · 0.0%)
ⓘ Screening estimate from a state-policy table — verify with the county assessor before closing.
Climate risk First Street
- Flood 4/10 Moderate FEMA zone X (unshaded) · 20% chance over 30 yrs
- Wildfire 1/10 Low
- Heat 7/10 Severe 7 d/yr ≥107°F today · 20 d/yr by 30 yrs out
- Wind 8/10 Severe 80% chance of damaging wind over 30 yrs
- Air quality 3/10 Moderate 4 unhealthy d/yr today · 4 by 30 yrs out
Nearby sold comps map
Loading sold comps map…
Walkable amenities ~0.75 mi
Loading nearby amenities…
Taxation est. · year 1
- Rental income
- $12,477
- − Mortgage interest
- −$4,778
- − Property taxes
- −$576
- − Insurance
- −$426
- − Repairs & maintenance
- −$998
- − Management
- −$998
- − Depreciation
- −$2,481
- Taxable income
- $2,218
- Est. tax owed @ 24.0%
- −$532
- After-tax cash flow
- $2,954/yr
For passive investors: Depreciation is non-cash, so a rental often shows a tax loss while cash-flowing — sheltering income. Rental losses are passive: they offset passive income freely, and up to $25,000/yr can offset ordinary (W-2) income if you actively participate and your MAGI is under $100k (phasing out to $0 by $150k); unused losses carry forward. On sale, claimed depreciation is recaptured at up to 25%, and gains may owe capital-gains tax (a 1031 exchange can defer both). Figures are a year-1 estimate at your 24.0% rate — not tax advice; consult a CPA.
Schools (NCES district)
- District
- Montgomery County
- NCES district ID
- 0102430
- Math proficiency
- 9% ▼ -21.00%
- Reading proficiency
- 31% ▼ -1.00%
- Median HH income
- $43,902
- Composite
- 17.24/100
- National rank
- #9093
- State rank
- #106 of 129 in AL
Livability — Montgomery
- Score
- 65/100
- State rank
- #138
- US rank
- #13416
Category grades
Schools grade is shown separately in the Schools card above.
Census & demographics
- Census place
- Montgomery, AL
- County
- Montgomery County · 190,016 people
- City population
- 175,913
- Metro
- Montgomery, AL
- Population (ZIP)
- 14,065
- Household income
- $69,087
- Rent vs Own
- Severe rent burden
- 876.0
Population outlook (Montgomery County) Hauer SSP2
- Today (2025)
- 224,008 people
- By 2030
- 221,460 · -1.1%
- By 2040
- 214,179 · -4.4%
- By 2050
- 204,912 · -8.5%
- By 2075
- 177,821 · -20.6%
- By 2100
- 145,134 · -35.2%
Race, ethnicity, and origin ACS 2023
- Neighborhood character
- Diverse neighborhood (Simpson 0.58)
- Race & ethnicity
- White 47% Black 43% Hispanic / Latino 5% Two or more races 4% Asian 1%
- Hispanic origin (detail)
- Mexican 3%
- Common ancestry
- Serbian 2% Slovak 2% Italian 1%
- Foreign-born
- 4% · Canada, China, South Korea
- Languages at home
- 94% English-only · Spanish 3%
Political lean MEDSL · Montgomery
- 2024 margin
- Solid D (+30.7) · D 64.8% · R 34.1% · Other 1.1%
- 2008→2024 swing
- +11.5pp toward D · 2008: 19.2pp · 2024: 30.7pp
- All cycles
- 2024: D+30.7 2020: D+31.5 2016: D+26.2 2012: D+24.3 2008: D+19.2
Not yet ingested
- Civics
- —
Market trends
- HPI YoY
- ▼ -22.82%
- Current HPI
- 151.1822
- Rent YoY
- ▲ 6.29%
- Metro
- Montgomery, AL
- State GDP YoY
- ▲ 2.94%
- F500 in state
- 4
Industry mix (Fortune 500 HQ in AL)
| Industry | F500 HQs | Revenue |
|---|---|---|
| Financial Services | 1 | $8B |
|
||
| Healthcare | 1 | $5B |
|
||
Price history
+42.4% since first listed15 events — show timeline
- 2026-06-15 Price Changed $85,300 MAAR
- 2026-06-03 Price Changed $86,900 MAAR
- 2026-06-01 Price Changed $87,900 MAAR
- 2026-05-21 Price Changed $89,000 MAAR
- 2026-05-04 Price Changed $91,900 MAAR
- 2026-04-30 Listed $92,900 MAAR
- 2026-02-19 Price Changed $84,900 LCMLS
- 2025-09-27 Price Changed $99,900 Greater Alabama MLS
- 2025-05-12 Price Changed $109,000 MAAR
- 2025-05-01 Relisted — MAAR
- 2025-04-18 Contingent — MAAR
- 2025-03-10 Listed $115,000 MAAR
- 2022-05-02 Listed $40,000 MAAR
- 1999-08-13 Sold (MLS) $57,950 MAAR
- 1998-05-08 Listed $59,900 MAAR
Property tax history
+8.2%/yrLatest (2025): $576 · -4.7% YoY. Source: county tax records.
Cash-flow waterfall
monthlySold comps — $/sqft
last 12 mo · ≤1 miLoading sold comps…