11 Knolls Rd · Fairview, NY
Flood risk 1/10 · Minimal
- FEMA flood zone
- X (unshaded)
- Chance of flooding over 30 yrs
- 0.0%
- Est. flood insurance / yr
- $473 – $860
Fire risk 3/10 · Minor
- Est. fire insurance / yr
- $691 – $1,283
Heat risk 4/10 · Minor
- Hot days now (above 98°F)
- 7 days/yr
- Hot days in 30 yrs
- 13 days/yr
Wind risk 4/10 · Minor
- Chance of severe wind over 30 yrs
- 10.0%
Air-quality risk 2/10 · Minimal
- Unhealthy air days now
- 1 days/yr
- Unhealthy air days in 30 yrs
- 3 days/yr
Risk factors via First Street. Map © Google.
Why this score? — see what drove the B grade
The composite is a weighted blend of 9 inputs, each scored 0–100. Each bar is that input's sub-score; the figure is the points it added to the 100-point composite (weight × sub-score).
- Cash flow +30.0/30.0
- DSCR +10.0/10.0
- 1% rule +9.6/10.0
- ARV discount +7.5/15.0
- Schools +4.7/10.0
- Livability +4.0/5.0
- Rent growth +3.4/5.0
- Condition / age +2.5/5.0
- Appreciation +0.0/10.0
$160,000
🖨 Deal sheet (PDF) 📄 Offer letter ✓ Due diligence
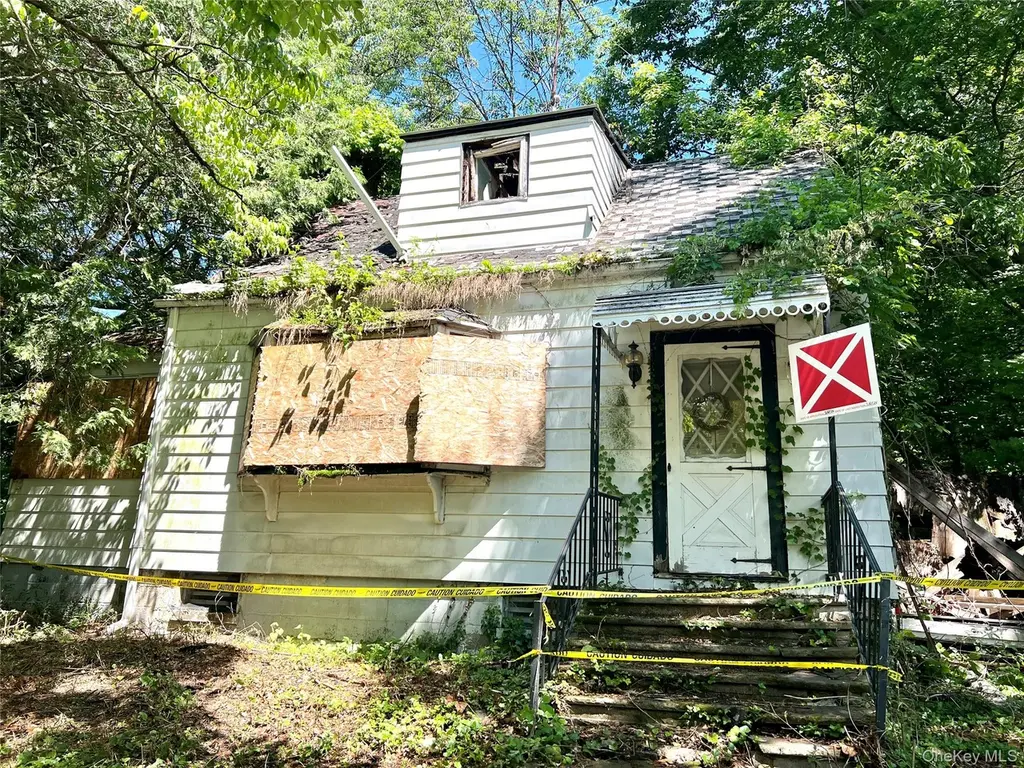
Listing remarks
Attention builders and investors! Opportunity to re-create what once was or start over, you have options as sale comes with adjacent lot at 9 Knolls Rd. Located in the heart of Hyde Park in an established neighborhood, the existing structure has been condemned and is not currently habitable. The home will require extensive renovation or possible demolition and reconstruction subject to municipal approvals. Prior house was 2 bedrooms, 1. 5 baths and 1629 sq. feet. Excellent potential, located near colleges, hospitals, major commuter routes. Do not go to property without an agent.
Key facts
- Extensive renovation
- Near hospitals
- Near colleges
Tags
Property features AI
Exterior
- Parking: Off-street parking
- Utilities: Sewer: other; Cable available
- Home design: Single family residence; Living area according to public records
- Construction: Construction materials listed as unknown
- Exterior features: Not waterfront
Interior
- Bathrooms: One full bathroom; One half bathroom
- Heating & cooling: Oil heating; No central cooling
- Interior features: Partial basement; Crawl attic; Six total rooms; No built-in appliances listed
Neighborhood map
What this means for you Summary
Snapshot
- This is a 2-bed/1.5-bath single-family listed at $160k.
Deal economics
- At list price, monthly cash flow is $735 ($9k/yr) — positive.
- The deal already cash-flows at list — no discount required.
- Meets the 1% rule at list price ($2k rent vs $160k).
- Cap rate 11.8% vs local median 3.8% in Fairview — top-decile yield for the area; either an underpriced asset or a hidden risk that comps aren't pricing in. Stress-test before assuming the spread holds.
Location & tenants
- Location reads 79/100 on livability (#149 in NY, #2,302 nationally) — a middle-class / working-renter tenant base. Strengths: commute A+, employment A+, housing A+; Watch: cost of living C-, amenities F.
- Hyde Park Central School District (rural): math 43% / reading 62% proficiency, ranked #316 of 590 in NY (top 54%) — acceptable for families but not a draw, mixed tenant base, ~2y average lease.
- Zoned schools: Ralph R Smith School (math 22% / reading 32%, grade F, #1,786 of 2,108 statewide, top 86%, 340 students, 54% FRL); Haviland Middle School (math 23% / reading 57%, grade F, #413 of 729 statewide, top 57%, 759 students, 59% FRL); Franklin D Roosevelt Senior High School (math 93% / reading 90%, grade A+, #197 of 1,100 statewide, top 18%, 1,136 students, 52% FRL) — zoned schools average 55% FRL vs 34% district-wide (21 pts higher); higher-poverty schools than district average — tighter screening recommended.
- Market conditions: Rents rising (+3.7%/yr); 189 active listings in the ZIP; 2 comparable units currently listed for rent nearby; 620 units permitted in Dutchess County in 2024 (242 in 5+ unit buildings).
- This rent runs 44% of the median local income ($64k/yr) — at the standard rent-burdened threshold; future hikes will face affordability resistance.
Forward outlook
- Local home prices are declining (-3.0%/yr); year-one equity from $1k of loan paydown is wiped out by about $5k of value loss. Plan a longer hold.
- Dutchess County population projected at -11% by 2050 — secular population decline; favor cash flow + early exit over multi-decade hold.
- At projected returns (-3.0% appreciation + 3.7% rent growth), your $45k cash investment doubles in ~6 years — after that, you're playing with house money.
Negotiation context
- Only 9 days on market — expect competitive offers; lowballing is unlikely to land.
Risks & watch-outs
- Watch-outs: built in 1950 — expect roof / HVAC / electrical / plumbing capex.
Questions for the listing agent
- Built in 1950 — when were the roof, HVAC, electrical panel, plumbing, and water heater last replaced?
- Is there a deadline driving the sale (1031 exchange, divorce, estate, relocation)? That informs how much negotiation room exists.
- Schools are F-rated, which usually means shorter tenancies and higher turnover. Who's the typical renter profile here, and what's been the actual vacancy rate?
- What's the average days-on-market for RENTAL listings here right now (not sales)? A rising rental-DOM trend means longer vacancies and softer asking-rent achievability than the comps imply.
- What's the recent tenant-quality profile in this submarket — average credit score on applications, eviction rate, late-payment / NSF rate, and stable-employment percentage? A property-management company in the area should have these aggregated.
- How much new for-sale + rental construction is in the pipeline within 1–3 miles? Heavy new supply typically softens prices + rents 12–24 months out; constrained supply supports both.
Investment metrics
- 1% rule
- 1.46% ✓
- Cap rate
- 11.80%
- Cash-on-cash
- 19.68%
- DSCR
- 1.88
- GRM
- 5.7
CMA / ARV
- ARV (on-the-fly)
- $360,009
- Comps found
- 9
Show comp detail 9 sales within ~0.75 mi
| Address | Dist | Beds/Ba | Sqft | Sold | Price | $/sf | Match |
|---|---|---|---|---|---|---|---|
| 5 W Cottage Rd | 0.39mi | 2/1.0 | 1,472 (-10%) | 9mo | $325,000 | $221 | 56 |
| 11 Cedar Ln | 0.12mi | 3/2.0 (+1) | 1,452 (-11%) | 20mo | $391,400 | $270 | 53 |
| 10 Maple Rd | 0.38mi | 3/1.5 (+1) | 1,774 (+9%) | 16mo | $368,314 | $208 | 49 |
| 44 Legion Rd | 0.47mi | 3/1.0 (+1) | 1,420 (-13%) | 2mo | $360,000 | $254 | 48 |
| 9 Hook Rd | 0.39mi | 3/2.0 (+1) | 1,850 (+14%) | 18mo | $390,000 | $211 | 37 |
| 49 Bircher Ave | 0.67mi | 2/1.0 | 1,386 (-15%) | 8mo | $369,000 | $266 | 35 |
| 6 Old West Dorsey Ln | 0.74mi | 2/3.0 | 1,838 (+13%) | 9mo | $330,000 | $180 | 31 |
| 19 Hawk Ln | 0.74mi | 3/3.0 (+1) | 1,872 (+15%) | 4mo | $430,000 | $230 | 26 |
| 5 Pells Ct | 0.71mi | 3/1.5 (+1) | 1,833 (+12%) | 23mo | $300,000 | $164 | 22 |
Match score weights: distance 35% · size 25% · config 20% · recency 20%. Top-matched comps best support the ARV.
Projected returns pro-forma
-3.0% appreciation · 3.67% rent growth · sell at horizon
- IRR
- 12.5%
- Equity multiple
- 1.50×
- Total profit
- $22,484
- Equity at exit
- $23,857
- IRR
- 22.0%
- Equity multiple
- 2.93×
- Total profit
- $86,553
- Equity at exit
- $13,834
Cash invested: $44,800 (down + closing). Projections, not guarantees.
Landlord ↔ Tenant lean methodology
- Overall (STATE)
- 15 Strongly Tenant-Friendly
- State New York
- 15 Strongly Tenant-Friendly · D+10
- County
- — inherits STATE
- City
- — inherits STATE
ZIP-level market 12601
- Rents YoY
- 3.7%
- Active inventory
- 189
- Price-to-rent
- 5.7×
Monthly cashflow live
- Estimated rent
- $2,330 medium interval (Pro) →
- Mortgage (P&I)
- −$839
- Tax est. 1.5%
- −$200 /mo · $2,400/yr
- Insurance
- −$67
- HOA
- −$0
- Vacancy / Maint / Mgmt
- −$489
- Net cashflow
- $735
Break-even live
Sensitivity live
| Price | -10% $845 | -5% $790 | +0% $735 | +5% $679 | +10% $624 |
|---|---|---|---|---|---|
| Rent | -10% $551 | -5% $643 | +0% $735 | +5% $827 | +10% $919 |
| Rate | -1.0pp $815 | -0.5pp $775 | base $735 | +0.5pp $693 | +1.0pp $651 |
UW: 25.0% down · 7.5% · 30yr · 1.5% tax · 5.0% vac · 8.0% maint · 8.0% mgmt
Financing live
Cash to close
- Down payment
- $40,000
- Closing costs
- $4,800
- Reserves months
- —
- Total cash needed
- —
Loan-product check · same deal, 3 products live
Conventional
25% down · 7.5% · 30yr
- Down + closing
- —
- Monthly P&I
- —
- Monthly cashflow
- —
- DSCR
- —
- Eligible?
- —
Personal DTI + credit; lowest rate.
DSCR
20% down · 8.5% · 30yr
- Down + closing
- —
- Monthly P&I
- —
- Monthly cashflow
- —
- DSCR
- —
- Eligible?
- —
No personal income docs; deal must DSCR.
Hard money
10% down · 12.0% · 12mo
- Down + closing
- —
- Monthly P&I
- —
- Monthly cashflow
- —
- DSCR
- —
- Eligible?
- —
Short-term bridge; refi at stabilization.
Rent comps 2 comps
| Address | Beds | Baths | Sqft | Rent | $/sqft | DOM | Units | Dist |
|---|---|---|---|---|---|---|---|---|
| 195 Pinebrook Dr Hyde Park, NY | 2.0 | 2.5 | 1381 | $2,950 | $2.14 | 44d | 1 | 0.92mi |
| 9 Ultra Way Poughkeepsie, NY | 2.0 | 2.5 | 1545 | $2,595 | $1.68 | 15d | 2 | 1.38mi |
Listing history 7 events
-
2026-06-18days on market $160,000 Active 9 DOM
-
2026-06-17days on market $160,000 Active 8 DOM
-
2026-06-16days on market $160,000 Active 7 DOM
-
2026-06-15days on market $160,000 Active 6 DOM
-
2026-06-14days on market $160,000 Active 4 DOM
-
2026-06-09remarks 585-char remark
-
2026-06-09$160,000 Active 1 DOM
ⓘ Source: listings_history table (triggers on properties + properties_extension) + one-shot
backfill from property_details.listing_events for pre-trigger history.
Climate risk First Street
- Flood 1/10 Low FEMA zone X (unshaded) · 0% chance over 30 yrs
- Wildfire 3/10 Moderate
- Heat 4/10 Moderate 7 d/yr ≥98°F today · 13 d/yr by 30 yrs out
- Wind 4/10 Moderate 10% chance of damaging wind over 30 yrs
- Air quality 2/10 Low 1 unhealthy d/yr today · 3 by 30 yrs out
Nearby sold comps map
Loading sold comps map…
Walkable amenities ~0.75 mi
Loading nearby amenities…
Taxation est. · year 1
- Rental income
- $27,956
- − Mortgage interest
- −$8,962
- − Property taxes
- −$2,400
- − Insurance
- −$800
- − Repairs & maintenance
- −$2,236
- − Management
- −$2,236
- − Depreciation
- −$4,655
- Taxable income
- $6,666
- Est. tax owed @ 24.0%
- −$1,600
- After-tax cash flow
- $7,217/yr
For passive investors: Depreciation is non-cash, so a rental often shows a tax loss while cash-flowing — sheltering income. Rental losses are passive: they offset passive income freely, and up to $25,000/yr can offset ordinary (W-2) income if you actively participate and your MAGI is under $100k (phasing out to $0 by $150k); unused losses carry forward. On sale, claimed depreciation is recaptured at up to 25%, and gains may owe capital-gains tax (a 1031 exchange can defer both). Figures are a year-1 estimate at your 24.0% rate — not tax advice; consult a CPA.
Schools (NCES district)
- District
- Hyde Park Central School District
- NCES district ID
- 3615180
- Math proficiency
- 43% ▼ -3.00%
- Reading proficiency
- 62% ▲ 15.00%
- Median HH income
- $68,932
- Composite
- 46.59/100
- National rank
- #2421
- State rank
- #316 of 590 in NY
Livability — Fairview
- Score
- 79/100
- State rank
- #149
- US rank
- #2302
Category grades
Schools grade is shown separately in the Schools card above.
Census & demographics
- Census place
- Fairview, NY
- County
- Dutchess County · 188,048 people
- Metro
- Poughkeepsie-Newburgh-Middletown, NY
- Population (ZIP)
- 44,164
- Household income
- $63,652
- Rent vs Own
- Severe rent burden
- 2891.0
Population outlook (Dutchess County) Hauer SSP2
- Today (2025)
- 291,768 people
- By 2030
- 287,131 · -1.6%
- By 2040
- 274,881 · -5.8%
- By 2050
- 259,971 · -10.9%
- By 2075
- 235,366 · -19.3%
- By 2100
- 208,786 · -28.4%
Race, ethnicity, and origin ACS 2023
- Neighborhood character
- Highly diverse neighborhood (Simpson 0.70)
- Race & ethnicity
- White 44% Black 24% Hispanic / Latino 22% Two or more races 17% Asian 3%
- Hispanic origin (detail)
- Mexican 8% Puerto Rican 5% Dominican 1%
- Common ancestry
- Romanian 3% Iranian 1% Lithuanian 1%
- Foreign-born
- 19% · Canada, China
- Languages at home
- 79% English-only · Spanish 15% Other Indo-European 1% Chinese 1%
Political lean MEDSL · Dutchess
- 2024 margin
- Lean D (+5.4) · D 52.7% · R 47.3%
- 2008→2024 swing
- -3.2pp toward R · 2008: 8.6pp · 2024: 5.4pp
- All cycles
- 2024: D+5.4 2020: D+9.6 2016: R+1.1 2012: D+6.6 2008: D+8.6
Not yet ingested
- Civics
- —
Market trends
- HPI YoY
- ▼ -210.62%
- Current HPI
- 293.9789
- Rent YoY
- ▲ 3.67%
- Metro
- Poughkeepsie-Newburgh-Middletown, NY
- State GDP YoY
- ▲ 2.60%
- F500 in state
- 92
Industry mix (Fortune 500 HQ in NY)
| Industry | F500 HQs | Revenue |
|---|---|---|
| Financial Services | 10 | $950B |
|
||
| Consumer Goods | 9 | $162B |
|
||
| Insurance | 4 | $225B |
|
||
| Telecommunications | 2 | $144B |
|
||
| Pharmaceuticals | 2 | $112B |
|
||
| Media / Entertainment | 2 | $69B |
|
||
Price history
1 event — show timeline
- 2026-06-09 Listed $160,000 OneKey® MLS as Distributed by MLS Grid
Property tax history
+3.1%/yrLatest (2025): $8,825 · +0.8% YoY. Source: county tax records.
Cash-flow waterfall
monthlySold comps — $/sqft
last 12 mo · ≤1 miLoading sold comps…