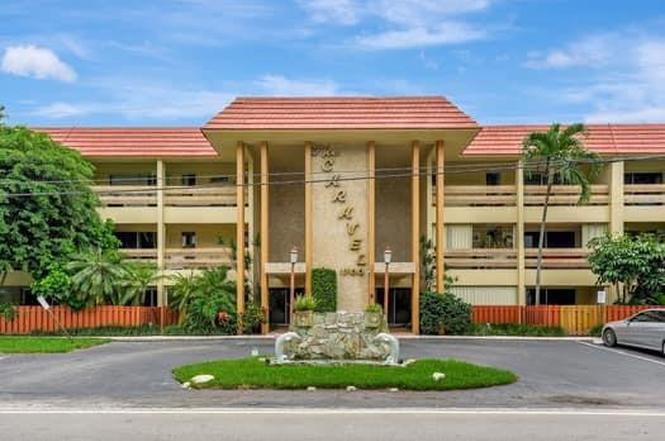
1700 SE 15th St #206 · Fort Lauderdale, FL
Flood risk 7/10 · Major
- FEMA flood zone
- X (shaded)
- Chance of flooding over 30 yrs
- 0.95%
- Est. flood insurance / yr
- $507 – $1,088
Fire risk 1/10 · Minimal
- Est. fire insurance / yr
- $947 – $1,759
Heat risk 10/10 · Severe
- Hot days now (above 105°F)
- 7 days/yr
- Hot days in 30 yrs
- 26 days/yr
Wind risk 10/10 · Severe
- Chance of severe wind over 30 yrs
- 99.0%
Air-quality risk 2/10 · Minimal
- Unhealthy air days now
- 1 days/yr
- Unhealthy air days in 30 yrs
- 1 days/yr
Risk factors via First Street. Map © Google.
Why this score? — see what drove the C+ grade
The composite is a weighted blend of 9 inputs, each scored 0–100. Each bar is that input's sub-score; the figure is the points it added to the 100-point composite (weight × sub-score).
- Cash flow +17.7/30.0
- 1% rule +9.8/10.0
- ARV discount +7.5/15.0
- Appreciation +7.1/10.0
- DSCR +5.5/10.0
- Schools +4.1/10.0
- Livability +4.1/5.0
- Rent growth +3.6/5.0
- Condition / age +2.5/5.0
$219,000
🖨 Deal sheet 📄 Offer letter ✓ Due diligence
Listing remarks
Best Value on 15th Street!BRAND NEW ROOF – COMPLETED MARCH 2025! Ultimate Ft. Lauderdale waterfront lifestyle in this boutique, low-rise gem along one of the city's most sought-after boating corridors. Spacious 2-bedroom condo features a huge private balcony, abundant closet space, pet-friendly community with a sparkling waterside pool and BBQ area. Walk to everything! Just minutes from Las Olas, top-rated restaurants, boutique shopping, grocery stores, and vibrant nightlife. A dream for boat lovers—enjoy a daily yacht parade right from your backyard! With deep-water dockage nearby, no fixed bridges, and quick ocean access, it's a boater’s paradise. perfect renovation oppo
Key facts
- Waterside pool
- Quick ocean access
- Private balcony
Tags
Neighborhood map
What this means for you Summary
Snapshot
- This is a 2-bed/2.0-bath condo listed at $219k.
Deal economics
- At list price, monthly cash flow is $111 ($1k/yr) — positive.
- The deal already cash-flows at list — no discount required.
- Meets the 1% rule at list price ($3k rent vs $219k).
- Recommended offer: $212k (3.0% below list) — sets the bar for market timing.
- Cap rate 7.3% vs local median 2.2% in Fort Lauderdale — top-decile yield for the area; either an underpriced asset or a hidden risk that comps aren't pricing in. Stress-test before assuming the spread holds.
Location & tenants
- Location reads 82/100 on livability (#78 in FL, #1,293 nationally) — a professional / high-income tenant draw. Strengths: crime A+, amenities A+, health & safety A+; Watch: cost of living D-.
- Broward (suburban): math 42% / reading 53% proficiency, ranked #46 of 73 in FL (top 63%) — families likely to look elsewhere, expect single-tenant / working-renter base with shorter leases.
- Zoned schools: Harbordale Elementary School (math 64% / reading 74%, grade A-, #399 of 2,144 statewide, top 19%, 487 students, 38% FRL); Sunrise Middle School (math 50% / reading 52%, grade C, #237 of 571 statewide, top 43%, 1,242 students, 64% FRL); Fort Lauderdale High School (math 38% / reading 67%, grade C-, #154 of 667 statewide, top 24%, 2,228 students, 57% FRL) — zoned schools at 53% FRL track the district average.
- Market conditions: Rents rising fast (+4.5%/yr); 400 active listings in the ZIP; 40 comparable units currently listed for rent nearby; rentals at typical pace (median 19d on market — plan ~3-4 weeks tenant-placement turnaround); solid renter incomes; 2,111 units permitted in Broward County in 2024 (1,265 in 5+ unit buildings).
Forward outlook
- In year one you build about $11k of equity ($2k loan paydown + $9k appreciation (4.2% local appreciation)).
- Broward County population projected at +34% by 2050 — long-run rental-demand tailwind backs the buy-and-hold thesis.
- At projected returns (4.2% appreciation + 4.5% rent growth), your $61k cash investment doubles in ~5 years — after that, you're playing with house money.
- By year 4, paydown + projected appreciation supports a ~$36k cash-out refi (75% LTV) — recoverable capital for the next deal without selling this one.
Negotiation context
- It's been on market 44 days — a 3% lower offer ($212k) is reasonable based on typical stale-listing flexibility.
- Current owner paid $135k; list at $219k implies a 62% gain — meaningful room to come down on a strong offer.
Risks & watch-outs
- Watch-outs: flood insurance adds $66/mo; HOA is 30% of rent.
- Climate carrying-cost: major flood risk; severe wind risk, 99% chance of damaging wind over 30y; extreme-heat days projected 7→26/yr by 2055 (HVAC capex compounding) — expect insurance premiums to compound above CPI over the hold.
Questions for the listing agent
- It's been on market 44 days. Have you received any prior offers? Is the seller open to a 3% concession, seller financing, or rate buy-down credit?
- Built in 1965 — when were the roof, HVAC, electrical panel, plumbing, and water heater last replaced?
- What's the actual annual flood-insurance premium (NFIP or private), and is the property in a SFHA with mandatory coverage?
- What does the HOA fee cover, when was the last increase, and are there any pending special assessments or reserve-fund shortfalls?
- Any open or pending special assessments — roof, HVAC, plumbing, elevator, façade? What's the per-unit balance and payoff schedule, and is the seller paying it off at close or rolling it to the buyer?
- Is there a deadline driving the sale (1031 exchange, divorce, estate, relocation)? That informs how much negotiation room exists.
- Schools are B-rated — typically a magnet for longer-tenancy family renters. What's the average tenant stay here, and is there a school-zone premium baked into asking?
- What's the average days-on-market for RENTAL listings here right now (not sales)? A rising rental-DOM trend means longer vacancies and softer asking-rent achievability than the comps imply.
- What's the recent tenant-quality profile in this submarket — average credit score on applications, eviction rate, late-payment / NSF rate, and stable-employment percentage? A property-management company in the area should have these aggregated.
- How much new apartment / multifamily construction is in the pipeline within 1–3 miles? Heavy new supply (>2% of stock underway) typically softens rents 12–24 months out; light construction supports rent growth.
Investment metrics
- 1% rule
- 1.48% ✓
- Cap rate
- 7.26%
- Cash-on-cash
- 3.47%
- DSCR
- 1.15
- GRM
- 5.6
CMA / ARV
No comps found within radius.
Projected returns pro-forma
4.15% appreciation · 4.54% rent growth · sell at horizon
- IRR
- 13.9%
- Equity multiple
- 1.86×
- Total profit
- $52,755
- Equity at exit
- $112,930
- IRR
- 16.2%
- Equity multiple
- 3.78×
- Total profit
- $170,738
- Equity at exit
- $186,234
Cash invested: $61,320 (down + closing). Projections, not guarantees.
Landlord ↔ Tenant lean methodology
- Overall (STATE)
- 87 Strongly Landlord-Friendly
- State Florida
- 87 Strongly Landlord-Friendly · R+3
- County
- — inherits STATE
- City
- — inherits STATE
ZIP-level market 33316
- Home prices YoY
- 1.3%
- Rents YoY
- 4.5%
- Active inventory
- 400
- Price-to-rent
- 5.6×
Monthly cashflow live
- Estimated rent
- $3,246 high interval (Pro) →
- Mortgage (P&I)
- −$1,148
- Tax from tax record
- −$177 /mo · $2,121/yr
- Insurance
- −$91
- Flood insurance flood zone
- −$66 /mo · $798/yr
- HOA
- −$971
- Vacancy / Maint / Mgmt
- −$682
- Net cashflow
- $111
Break-even live
UW: 25.0% down · 7.5% · 30yr · 1.5% tax · 5.0% vac · 8.0% maint · 8.0% mgmt
Financing live
Cash to close
- Down payment
- $54,750
- Closing costs
- $6,570
- Reserves months
- —
- Total cash needed
- —
Loan-product check · same deal, 3 products live
Conventional
25% down · 7.5% · 30yr
- Down + closing
- —
- Monthly P&I
- —
- Monthly cashflow
- —
- DSCR
- —
- Eligible?
- —
Personal DTI + credit; lowest rate.
DSCR
20% down · 8.5% · 30yr
- Down + closing
- —
- Monthly P&I
- —
- Monthly cashflow
- —
- DSCR
- —
- Eligible?
- —
No personal income docs; deal must DSCR.
Hard money
10% down · 12.0% · 12mo
- Down + closing
- —
- Monthly P&I
- —
- Monthly cashflow
- —
- DSCR
- —
- Eligible?
- —
Short-term bridge; refi at stabilization.
Rent comps 40 comps
| Address | Beds | Baths | Sqft | Rent | $/sqft | DOM | Units | Dist |
|---|---|---|---|---|---|---|---|---|
| 1700 SE 15th St Fort Lauderdale, FL | 1.0–2.0 | 1.0–1.5 | 1050 | $2,500 | $2.38 | 24d | 2 | 0.01mi |
| 1700 SE 15th St Fort Lauderdale, FL | 1.0–2.0 | 1.0–1.5 | 1050 | $2,200 | $2.10 | 15d | 3 | 0.01mi |
| 1721 SE 17th St Fort Lauderdale, FL | 2.0 | 1.0–2.0 | 881 | $4,635 | $5.26 | 2d | 42 | 0.05mi |
| 1617 SE 15th St #605 Fort Lauderdale, FL | 2.0 | 2.0 | 1240 | $2,400 | $1.94 | 24d | 1 | 0.08mi |
| 1600 SE 15th St #503 Fort Lauderdale, FL | 2.0 | 2.0 | 1070 | $2,700 | $2.52 | 21d | 1 | 0.08mi |
| 1718 SE 14th St Fort Lauderdale, FL | 3.0 | 2.0 | 1200 | $4,800 | $4.00 | 24d | 1 | 0.11mi |
| 1819 SE 17th St Fort Lauderdale, FL | 1.0–2.0 | 1.5–2.0 | 1547 | $4,100 | $2.65 | 14d | 3 | 0.15mi |
| 1819 SE 17th St Fort Lauderdale, FL | 1.0–2.0 | 1.5–2.0 | 1547 | $4,100 | $2.65 | 20d | 3 | 0.15mi |
| 1819 SE 17th St Fort Lauderdale, FL | 1.0–2.0 | 1.5–2.0 | 1547 | $4,100 | $2.65 | 15d | 2 | 0.15mi |
| 1819 SE 17th St Fort Lauderdale, FL | 1.0–2.0 | 1.5–2.0 | 1547 | $4,100 | $2.65 | 5d | 3 | 0.15mi |
| 1531 SE 15th St Fort Lauderdale, FL | 2.0 | 2.0 | 1008 | $2,900 | $2.88 | 24d | 1 | 0.17mi |
| 1510 SE 15th St #106 Fort Lauderdale, FL | 2.0 | 2.0 | 940 | $2,650 | $2.82 | 17d | 1 | 0.20mi |
| 1510 SE 15th St Fort Lauderdale, FL | 1.0–2.0 | 1.0–2.0 | 800 | $2,650 | $3.31 | 7d | 2 | 0.24mi |
| 1490 SE 15th St #104 Fort Lauderdale, FL | 2.0 | 2.0 | 1459 | $4,250 | $2.91 | 17d | 1 | 0.28mi |
| 1401 SE 15th St Fort Lauderdale, FL | 1.0–2.0 | 1.0 | 912 | $2,750 | $3.01 | 24d | 1 | 0.37mi |
| 1312 SE 13th Ter Fort Lauderdale, FL | 2.0 | 2.0 | 1141 | $3,850 | $3.37 | 24d | 1 | 0.42mi |
| 1625 SE 10th Ave #302 Fort Lauderdale, FL | 2.0 | 2.0 | 1200 | $2,500 | $2.08 | 24d | 1 | 0.58mi |
| 2201 Mariner Dr Fort Lauderdale, FL | 1.0–2.0 | 1.0–2.0 | 1000 | $2,999 | $3.00 | 2d | 2 | 0.61mi |
| 901 SE 17th St Unit 901 Fort Lauderdale, FL | 1.0 | 1.5 | 1384 | $3,400 | $2.46 | 22d | 1 | 0.61mi |
| 2200 SE 19th St Unit 2200 Fort Lauderdale, FL | 3.0 | 2.0 | 1710 | $5,400 | $3.16 | 22d | 1 | 0.65mi |
| 2420 SE 17th St Fort Lauderdale, FL | 1.0–2.0 | 1.0–2.0 | 841 | $2,450 | $2.91 | 19d | 2 | 0.68mi |
| 824 SE 12th Ct Unit 840 Fort Lauderdale, FL | 3.0 | 2.5 | 1852 | $5,000 | $2.70 | 21d | 1 | 0.68mi |
| 817 SE 12th Ct #1 Fort Lauderdale, FL | 2.0 | 2.5 | 1328 | $2,500 | $1.88 | 24d | 1 | 0.70mi |
| 1919 SE 10th Ave Fort Lauderdale, FL | 1.0–2.0 | 1.0–2.0 | 1034 | $3,504 | $3.39 | 2d | 32 | 0.71mi |
| 711 SE 15th St Unit 5 Fort Lauderdale, FL | 2.0 | 2.0 | 900 | $1,960 | $2.18 | 24d | 1 | 0.71mi |
| 1799 Marietta Dr Fort Lauderdale, FL | 2.0 | 2.0 | 1248 | $4,900 | $3.93 | 24d | 1 | 0.74mi |
| 1250 Miami Rd #10 Fort Lauderdale, FL | 2.0 | 2.0 | 920 | $2,300 | $2.50 | 5d | 1 | 0.74mi |
| 2039 SE 10th Ave #509 Fort Lauderdale, FL | 2.0 | 2.0 | 1054 | $2,295 | $2.18 | 2d | 1 | 0.74mi |
| 2039 SE 10th Ave #509 Fort Lauderdale, FL | 2.0 | 2.0 | 1054 | $2,395 | $2.27 | 17d | 1 | 0.74mi |
| 2033 SE 10th Ave #620 Fort Lauderdale, FL | 2.0 | 2.0 | 1054 | $3,200 | $3.04 | 24d | 1 | 0.77mi |
| 2027 SE 10th Ave #716 Fort Lauderdale, FL | 1.0 | 1.0 | 878 | $2,600 | $2.96 | 7d | 1 | 0.78mi |
| 2131 SE 10th Ave #1112 Fort Lauderdale, FL | 2.0 | 2.0 | 1054 | $3,000 | $2.85 | 24d | 1 | 0.79mi |
| 2009 Admirals Way Fort Lauderdale, FL | 3.0 | 3.0 | 1805 | $14,999 | $8.31 | 24d | 1 | 0.80mi |
| 2125 SE 10th Ave Fort Lauderdale, FL | 2.0 | 2.0 | 1054 | $2,725 | $2.59 | 19d | 2 | 0.80mi |
| 1635 Seabreeze Blvd Fort Lauderdale, FL | 3.0 | 2.0 | 1584 | $9,000 | $5.68 | 17d | 1 | 0.80mi |
| 2119 SE 10th Ave #917 Fort Lauderdale, FL | 2.0 | 2.0 | 1054 | $2,600 | $2.47 | 3d | 1 | 0.84mi |
| 2119 SE 10th Ave #917 Fort Lauderdale, FL | 2.0 | 2.0 | 1054 | $2,790 | $2.65 | 7d | 1 | 0.84mi |
| 2119 SE 10th Ave #910 Fort Lauderdale, FL | 2.0 | 2.0 | 1054 | $2,800 | $2.66 | 21d | 1 | 0.84mi |
| 2100 Miami Rd Unit 302 Fort Lauderdale, FL | 3.0 | 3.0 | 1724 | $4,980 | $2.89 | 5d | 1 | 0.84mi |
| 2100 Miami Rd Unit 401 Fort Lauderdale, FL | 3.0 | 3.0 | 1707 | $4,980 | $2.92 | 17d | 1 | 0.85mi |
HOA detail condo
- Monthly dues
- $971 · $11,652/yr
- Likely covers
- waterpool
- Assessments
- None detected in remarks — confirm with the listing agent.
Listing history 7 events
-
2026-04-24status Pending
-
2024-09-05$219,000 Active
-
2000-10-02soldstatus $135,000
-
1998-10-31soldstatus $118,000
-
1994-12-01soldstatus $80,500
-
1988-11-04soldstatus $64,000
-
1980-07-01soldstatus $83,000
ⓘ Source: listings_history table (triggers on properties + properties_extension) + one-shot
backfill from property_details.listing_events for pre-trigger history.
Tax reassessment forecast FL · Resets to sale price
- Current annual tax
- $2,121 · $177/mo
- Projected year-2 tax
- $2,121 · $177/mo
- Expected delta
- $0/yr ($0/mo · 0.0%)
ⓘ Screening estimate from a state-policy table — verify with the county assessor before closing.
Climate risk First Street
- Flood 7/10 Severe FEMA zone X (shaded) · 95% chance over 30 yrs
- Wildfire 1/10 Low
- Heat 10/10 Extreme 7 d/yr ≥105°F today · 26 d/yr by 30 yrs out
- Wind 10/10 Extreme 99% chance of damaging wind over 30 yrs
- Air quality 2/10 Low 1 unhealthy d/yr today · 1 by 30 yrs out
Nearby sold comps map
Loading sold comps map…
Walkable amenities ~0.75 mi
Loading nearby amenities…
Taxation est. · year 1
- Rental income
- $38,955
- − Mortgage interest
- −$12,267
- − Property taxes
- −$2,121
- − Insurance
- −$1,892
- − Repairs & maintenance
- −$3,116
- − Management
- −$3,116
- − HOA
- −$11,652
- − Depreciation
- −$6,371
- Taxable loss
- −$1,581
- Est. tax savings @ 24.0%
- +$379
- After-tax cash flow
- $1,707/yr
For passive investors: Depreciation is non-cash, so a rental often shows a tax loss while cash-flowing — sheltering income. Rental losses are passive: they offset passive income freely, and up to $25,000/yr can offset ordinary (W-2) income if you actively participate and your MAGI is under $100k (phasing out to $0 by $150k); unused losses carry forward. On sale, claimed depreciation is recaptured at up to 25%, and gains may owe capital-gains tax (a 1031 exchange can defer both). Figures are a year-1 estimate at your 24.0% rate — not tax advice; consult a CPA.
Schools (NCES district)
- District
- Broward
- NCES district ID
- 1200180
- Math proficiency
- 42% ▼ -18.00%
- Reading proficiency
- 53% ▼ -5.00%
- Median HH income
- $52,139
- Composite
- 40.88/100
- National rank
- #3621
- State rank
- #46 of 73 in FL
Livability — Fort Lauderdale
- Score
- 82/100
- State rank
- #78
- US rank
- #1293
Category grades
Schools grade is shown separately in the Schools card above.
Census & demographics
- Census place
- Fort Lauderdale, FL
- County
- Broward County · 1,963,430 people
- City population
- 235,769
- Metro
- Miami-Fort Lauderdale-Pompano Beach, FL
- Population (ZIP)
- 12,437
- Household income
- $96,641
- Rent vs Own
- Severe rent burden
- 770.0
Population outlook (Broward County) Hauer SSP2
- Today (2025)
- 2,207,033 people
- By 2030
- 2,360,704 · +7.0%
- By 2040
- 2,661,208 · +20.6%
- By 2050
- 2,946,698 · +33.5%
- By 2075
- 3,602,273 · +63.2%
- By 2100
- 3,970,984 · +79.9%
Race, ethnicity, and origin ACS 2023
- Neighborhood character
- Predominantly White (70%)
- Race & ethnicity
- White 70% Hispanic / Latino 17% Two or more races 8% Black 7% Asian 3% Native American 1%
- Hispanic origin (detail)
- Mexican 1% Puerto Rican 3% Cuban 3%
- Common ancestry
- Romanian 3% Italian 3% Slovak 3%
- Foreign-born
- 22% · Canada, Jamaica, Dominican Republic
- Languages at home
- 80% English-only · Spanish 13% Tagalog/Filipino 2% Other Indo-European 1%
Political lean MEDSL · Broward
- 2024 margin
- D (+17.0) · D 58.0% · R 41.0%
- 2008→2024 swing
- -17.8pp toward R · 2008: 34.7pp · 2024: 17.0pp
- All cycles
- 2024: D+17.0 2020: D+29.8 2016: D+35.0 2012: D+34.9 2008: D+34.7
Not yet ingested
- Civics
- —
Market trends
- HPI YoY
- ▲ 4.15%
- Current HPI
- 319.5598
- Rent YoY
- ▲ 4.54%
- Metro
- Miami-Fort Lauderdale-Pompano Beach, FL
- State GDP YoY
- ▲ 3.28%
- F500 in state
- 36
Industry mix (Fortune 500 HQ in FL)
| Industry | F500 HQs | Revenue |
|---|---|---|
| Industrial Technology | 2 | $29B |
|
||
| Insurance | 2 | $17B |
|
||
| Retail | 1 | $60B |
|
||
| Technology Distribution | 1 | $58B |
|
||
| Homebuilding | 1 | $35B |
|
||
| Technology Manufacturing | 1 | $35B |
|
||
Price history
+163.9% since first listed7 events — show timeline
- 2026-04-24 Pending — Beaches MLS
- 2024-09-05 Listed $219,000 Beaches MLS
- 2000-10-02 Sold (Public Records) $135,000 Public Records
- 1998-10-31 Sold (Public Records) $118,000 Public Records
- 1994-12-01 Sold (Public Records) $80,500 Public Records
- 1988-11-04 Sold (Public Records) $64,000 Public Records
- 1980-07-01 Sold (Public Records) $83,000 Public Records
Property tax history
+3.9%/yrLatest (2025): $2,121 · +7.3% YoY. Source: county tax records.
Cash-flow waterfall
monthlySold comps — $/sqft
last 12 mo · ≤1 miLoading sold comps…