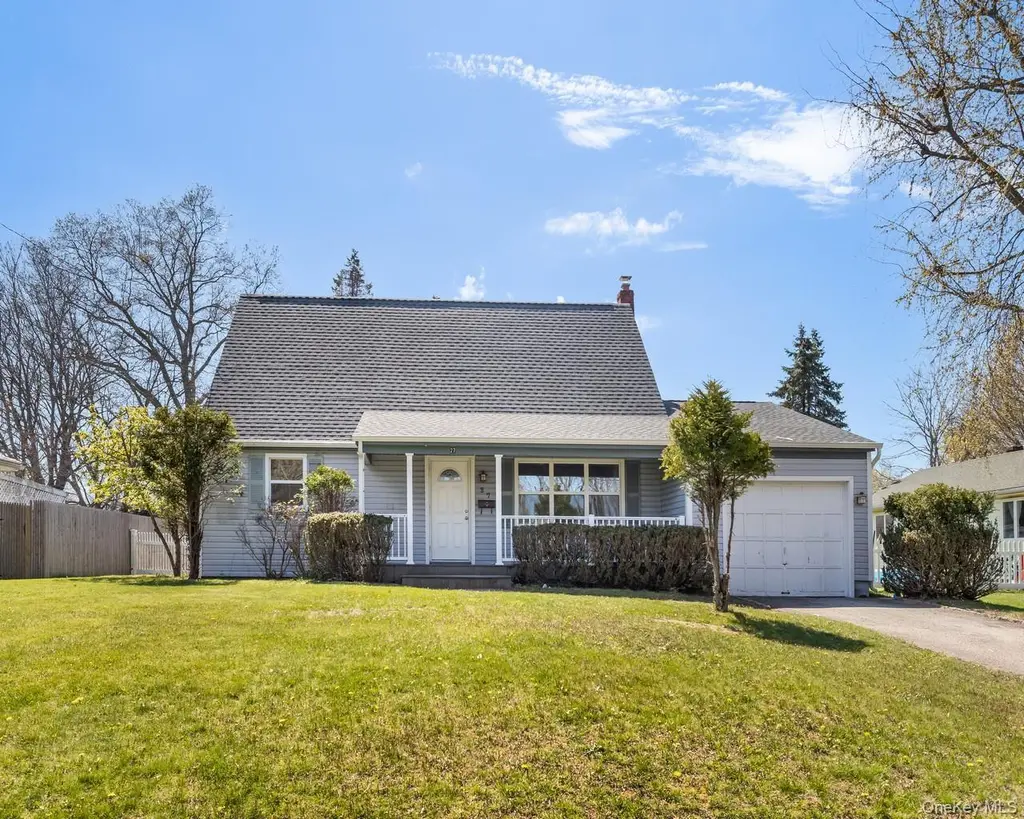
27 (AKA 630) Madison St · Greenport West, NY
Flood risk No data
- FEMA flood zone
- —
- Chance of flooding over 30 yrs
- —
- Est. flood insurance / yr
- —
Fire risk No data
- Est. fire insurance / yr
- —
Heat risk No data
- Hot days now (above threshold)
- —
- Hot days in 30 yrs
- —
Wind risk No data
- Chance of severe wind over 30 yrs
- —
Air-quality risk No data
- Unhealthy air days now
- —
- Unhealthy air days in 30 yrs
- —
Risk factors via First Street. Map © Google.
Why this score? — see what drove the B+ grade
The composite is a weighted blend of 9 inputs, each scored 0–100. Each bar is that input's sub-score; the figure is the points it added to the 100-point composite (weight × sub-score).
- Cash flow +30.0/30.0
- ARV discount +15.0/15.0
- 1% rule +10.0/10.0
- DSCR +10.0/10.0
- Schools +4.5/10.0
- Condition / age +4.0/5.0
- Livability +2.9/5.0
- Rent growth +2.5/5.0
- Appreciation +0.0/10.0
$725,000
🖨 Deal sheet (PDF) 📄 Offer letter ✓ Due diligence
Listing remarks
This charming cape is situated in Greenport, just minutes from Greenport Village and Beaches. The home has 4 bedrooms, 2 full bathrooms, and approximately 1500 sq ft. The eat-in kitchen has granite countertops and an awesome backsplash. The basement is unfinished with bilco doors. There is a fenced backyard and 1 car garage. The home currently has tenants, who will be leaving.
Key facts
- Bilco doors
- Granite countertops
- Fenced backyard
Tags
Property features AI
Exterior
- Parking: Driveway; Garage; 3 total parking spaces; 1-car garage
- Utilities: Electricity connected (PSEG); Water connected; Cesspool sewer
- Home design: Single-family residence; Two-story; Actual property condition
- Construction: Vinyl siding; Full attic; Unfinished basement with Bilco door(s)
- Exterior features: Mailbox; Fenced yard; Back yard
Interior
- Kitchen: Dishwasher; Microwave; Range; Refrigerator
- Bedrooms: Two levels (total rooms: 6)
- Bathrooms: 2 full bathrooms
- Heating & cooling: Baseboard heating; Oil heating; No central cooling
- Interior features: First-floor bedroom; First-floor full bathroom; Granite countertops; Storage space; Walk-in closet(s); Washer/dryer hookup; Porch
- Laundry & utility: Washer/Dryer hookup
Neighborhood map
What this means for you Summary
Snapshot
- This is a 4-bed/2.0-bath single-family listed at $725k. Condition is rated good.
Deal economics
- At list price, monthly cash flow is $9k ($111k/yr) — positive.
- The deal already cash-flows at list — no discount required.
- Meets the 1% rule at list price ($18k rent vs $725k).
- Recommended offer: $703k (3.0% below list) — sets the bar for market timing.
- Cap rate 21.7% vs local median 8.1% in Greenport West — top-decile yield for the area; either an underpriced asset or a hidden risk that comps aren't pricing in. Stress-test before assuming the spread holds.
Location & tenants
- Location reads 58/100 on livability (#1,073 in NY) — a working-class tenant base; expect higher turnover. Strengths: crime A+, employment A+; Watch: amenities F, commute F, cost of living F.
- Greenport Union Free School District (town): math 55% / reading 45% proficiency, ranked #450 of 755 in NY (top 60%) — acceptable for families but not a draw, mixed tenant base, ~2y average lease.
- Zoned schools: Greenport Elementary School (math 47% / reading 62%, grade C, #908 of 2,108 statewide, top 46%, 339 students, 61% FRL); Greenport High School (math 52% / reading 54%, grade C-, #934 of 1,100 statewide, top 86%, 356 students, 63% FRL).
- Market conditions: 69 active listings in the ZIP; 6 comparable units currently listed for rent nearby; rentals lingering (median 46d on market — plan ~5-8 weeks vacancy on turnover, expect pricing pressure); 50% of comp listings sitting > 30 days — soft ceiling on asking rent; 1,366 units permitted in Suffolk County in 2024 (216 in 5+ unit buildings).
Forward outlook
- Local home prices are declining (-3.0%/yr); year-one equity from $5k of loan paydown is wiped out by about $22k of value loss. Plan a longer hold.
- Suffolk County population projected to shrink 5% by 2050 — rents likely to lag national; underwrite the cash flow, not the appreciation.
- At projected returns (-3.0% appreciation + 3.0% rent growth), your $203k cash investment doubles in ~3 years — after that, you're playing with house money.
Negotiation context
- It's been on market 40 days — a 3% lower offer ($703k) is reasonable based on typical stale-listing flexibility.
- 4 sale attempts since 2y ago with the ask held roughly flat each time — persistent listings suggest the price (not the market) is what's stuck; bring a comps-based counter.
Questions for the listing agent
- It's been on market 40 days. Have you received any prior offers? Is the seller open to a 3% concession, seller financing, or rate buy-down credit?
- Built in 1965 — when were the roof, HVAC, electrical panel, plumbing, and water heater last replaced?
- Is there a deadline driving the sale (1031 exchange, divorce, estate, relocation)? That informs how much negotiation room exists.
- Schools are D-rated, which usually means shorter tenancies and higher turnover. Who's the typical renter profile here, and what's been the actual vacancy rate?
- What's the average days-on-market for RENTAL listings here right now (not sales)? A rising rental-DOM trend means longer vacancies and softer asking-rent achievability than the comps imply.
- What's the recent tenant-quality profile in this submarket — average credit score on applications, eviction rate, late-payment / NSF rate, and stable-employment percentage? A property-management company in the area should have these aggregated.
- How much new for-sale + rental construction is in the pipeline within 1–3 miles? Heavy new supply typically softens prices + rents 12–24 months out; constrained supply supports both.
Investment metrics
- 1% rule
- 2.50% ✓
- Cap rate
- 21.67%
- Cash-on-cash
- 54.92%
- DSCR
- 3.44
- GRM
- 3.3
CMA / ARV
- ARV (median comp)
- $950,399
- List price
- $725,000
- Delta
- -23.72%
- Verdict
- UNDERPRICED
- Comps
- 20 within 1.0 mi
Show comp detail 9 sales within ~0.75 mi
| Address | Dist | Beds/Ba | Sqft | Sold | Price | $/sf | Match |
|---|---|---|---|---|---|---|---|
| 57 (aka 400) Wilmarth Ave | 0.12mi | 3/1.0 (-1) | 1,500 (0%) | 4mo | $585,000 | $390 | 82 |
| 16 Washington Ave | 0.22mi | 3/1.5 (-1) | 1,550 (+3%) | 12mo | $979,000 | $632 | 67 |
| 795 Westwood Ln | 0.45mi | 3/2.0 (-1) | 1,500 (0%) | 10mo | $1,230,000 | $820 | 66 |
| 416 West St | 0.60mi | 4/1.5 | 1,450 (-3%) | 4mo | $725,000 | $500 | 61 |
| 3400 & 3500 Sound Dr | 0.64mi | 3/2.0 (-1) | 1,500 (0%) | 8mo | $4,600,000 | $3,067 | 58 |
| 312 5th Ave | 0.65mi | 3/2.0 (-1) | 1,620 (+8%) | 10mo | $875,000 | $540 | 44 |
| 216 North St | 0.51mi | 3/3.5 (-1) | 1,724 (+15%) | 0mo | $999,000 | $579 | 40 |
| 302 Monsell Pl | 0.35mi | 3/2.0 (-1) | 1,300 (-13%) | 21mo | $945,000 | $727 | 39 |
| 237 5th Ave | 0.70mi | 3/1.5 (-1) | 1,700 (+13%) | 11mo | $1,250,000 | $735 | 29 |
Match score weights: distance 35% · size 25% · config 20% · recency 20%. Top-matched comps best support the ARV.
Projected returns pro-forma
-3.0% appreciation · 3.0% rent growth · sell at horizon
- IRR
- 53.2%
- Equity multiple
- 3.34×
- Total profit
- $474,472
- Equity at exit
- $108,100
- IRR
- 58.4%
- Equity multiple
- 6.79×
- Total profit
- $1,176,155
- Equity at exit
- $62,685
Cash invested: $203,000 (down + closing). Projections, not guarantees.
Landlord ↔ Tenant lean methodology
- Overall (STATE)
- 15 Strongly Tenant-Friendly
- State New York
- 15 Strongly Tenant-Friendly · D+10
- County
- — inherits STATE
- City
- — inherits STATE
ZIP-level market 11944
- Home prices YoY
- -23.7%
- Active inventory
- 69
- Price-to-rent
- 3.3×
Monthly cashflow live
- Estimated rent
- $18,102 medium interval (Pro) →
- Mortgage (P&I)
- −$3,802
- Tax est. 1.5%
- −$906 /mo · $10,875/yr
- Insurance
- −$302
- HOA
- −$0
- Vacancy / Maint / Mgmt
- −$3,801
- Net cashflow
- $9,290
Break-even live
Sensitivity live
| Price | -10% $9,791 | -5% $9,540 | +0% $9,290 | +5% $9,039 | +10% $8,789 |
|---|---|---|---|---|---|
| Rent | -10% $7,860 | -5% $8,575 | +0% $9,290 | +5% $10,005 | +10% $10,720 |
| Rate | -1.0pp $9,655 | -0.5pp $9,474 | base $9,290 | +0.5pp $9,102 | +1.0pp $8,911 |
UW: 25.0% down · 7.5% · 30yr · 1.5% tax · 5.0% vac · 8.0% maint · 8.0% mgmt
Financing live
Cash to close
- Down payment
- $181,250
- Closing costs
- $21,750
- Reserves months
- —
- Total cash needed
- —
Loan-product check · same deal, 3 products live
Conventional
25% down · 7.5% · 30yr
- Down + closing
- —
- Monthly P&I
- —
- Monthly cashflow
- —
- DSCR
- —
- Eligible?
- —
Personal DTI + credit; lowest rate.
DSCR
20% down · 8.5% · 30yr
- Down + closing
- —
- Monthly P&I
- —
- Monthly cashflow
- —
- DSCR
- —
- Eligible?
- —
No personal income docs; deal must DSCR.
Hard money
10% down · 12.0% · 12mo
- Down + closing
- —
- Monthly P&I
- —
- Monthly cashflow
- —
- DSCR
- —
- Eligible?
- —
Short-term bridge; refi at stabilization.
Rent comps 6 comps
| Address | Beds | Baths | Sqft | Rent | $/sqft | DOM | Units | Dist |
|---|---|---|---|---|---|---|---|---|
| 485 Sutton Pl Greenport, NY | 4.0 | 2.5 | 2026 | $20,000 | $9.87 | 46d | 1 | 0.20mi |
| 312 5th Ave Greenport, NY | 4.0 | 2.0 | 1900 | $12,000 | $6.32 | 46d | 1 | 0.64mi |
| 123 Sterling Ave #2 Greenport, NY | 3.0 | 3.0 | 1528 | $45,000 | $29.45 | 46d | 1 | 0.72mi |
| 134 6th St Greenport, NY | 3.0 | 2.0 | 1560 | $18,500 | $11.86 | 21d | 1 | 1.23mi |
| 131 6th St Unit G Greenport, NY | 3.0 | 2.5 | 2238 | $5,000 | $2.23 | 26d | 1 | 1.25mi |
| 1110 Gillette Dr East Marion, NY | 4.0 | 2.0 | 1500 | $7,000 | $4.67 | 21d | 1 | 1.48mi |
Listing history 25 events
-
2026-06-22days on market $725,000 Active 40 DOM
-
2026-06-21days on market $725,000 Active 39 DOM
-
2026-06-21days on market $725,000 Active 38 DOM
-
2026-06-18days on market $725,000 Active 36 DOM
-
2026-06-17days on market $725,000 Active 35 DOM
-
2026-06-16days on market $725,000 Active 34 DOM
-
2026-06-15days on market $725,000 Active 33 DOM
-
2026-06-13days on market $725,000 Active 31 DOM
-
2026-06-12days on market $725,000 Active 30 DOM
-
2026-06-09days on market $725,000 Active 27 DOM
-
2026-06-08days on market $725,000 Active 26 DOM
-
2026-06-07days on market $725,000 Active 25 DOM
-
2026-06-05days on market $725,000 Active 23 DOM
-
2026-06-04days on market $725,000 Active 21 DOM
-
2026-06-02days on market $725,000 Active 20 DOM
-
2026-06-01days on market $725,000 Active 19 DOM
-
2026-05-31days on market $725,000 Active 18 DOM
-
2026-05-13$725,000 Active 383-char remark
-
2024-12-18historical $3,800
-
2024-11-26$3,800
-
2024-11-26historical $3,800
-
2024-11-13$3,800
-
2024-06-18historical $4,000
-
2024-05-14price $4,000
-
2024-04-28$4,500
ⓘ Source: listings_history table (triggers on properties + properties_extension) + one-shot
backfill from property_details.listing_events for pre-trigger history.
Nearby sold comps map
Loading sold comps map…
Walkable amenities ~0.75 mi
Loading nearby amenities…
Taxation est. · year 1
- Rental income
- $217,219
- − Mortgage interest
- −$40,611
- − Property taxes
- −$10,875
- − Insurance
- −$3,625
- − Repairs & maintenance
- −$17,378
- − Management
- −$17,378
- − Depreciation
- −$21,091
- Taxable income
- $106,262
- Est. tax owed @ 24.0%
- −$25,503
- After-tax cash flow
- $85,976/yr
For passive investors: Depreciation is non-cash, so a rental often shows a tax loss while cash-flowing — sheltering income. Rental losses are passive: they offset passive income freely, and up to $25,000/yr can offset ordinary (W-2) income if you actively participate and your MAGI is under $100k (phasing out to $0 by $150k); unused losses carry forward. On sale, claimed depreciation is recaptured at up to 25%, and gains may owe capital-gains tax (a 1031 exchange can defer both). Figures are a year-1 estimate at your 24.0% rate — not tax advice; consult a CPA.
Condition & rehab AI · 10 photos
This charming cape is move-in ready with good condition and fresh updates, ideal for both resale and rental.
Value-add opportunities
- Both Paint exterior — Enhances curb appeal and value
- Both Replace gutters — Improves drainage and aesthetics
Renovation cost estimate screening
Value-add ROI direction
- Both Paint exterior — Enhances curb appeal and value ↑
- Both Replace gutters — Improves drainage and aesthetics ↑
ⓘ Cost ranges are severity-bucket heuristics (US national rule-of-thumb). Get contractor quotes + a written scope before underwriting a rehab budget.
Schools (NCES district)
- District
- Greenport Union Free School District
- NCES district ID
- 3612840
- Math proficiency
- 55% ▲ 5.00%
- Reading proficiency
- 45% ▼ -5.00%
- Median HH income
- $54,490
- Composite
- 45.25/100
- National rank
- #5759
- State rank
- #450 of 755 in NY
Livability — Greenport West
- Score
- 58/100
- State rank
- #1073
- US rank
- #21520
Category grades
Schools grade is shown separately in the Schools card above.
Census & demographics
- Census place
- Greenport West, NY
- Population (ZIP)
- 4,744
Population outlook (Suffolk County) Hauer SSP2
- Today (2025)
- 1,505,262 people
- By 2030
- 1,498,318 · -0.5%
- By 2040
- 1,471,101 · -2.3%
- By 2050
- 1,424,848 · -5.3%
- By 2075
- 1,337,157 · -11.2%
- By 2100
- 1,217,720 · -19.1%
Race, ethnicity, and origin ACS 2023
- Neighborhood character
- Predominantly White (69%)
- Race & ethnicity
- White 69% Hispanic / Latino 23% Two or more races 6% Black 4% Asian 2%
- Hispanic origin (detail)
- Mexican 5% Puerto Rican 2%
- Common ancestry
- Romanian 6% Lithuanian 2% Subsaharan African 2%
- Foreign-born
- 19% · Canada, China
- Languages at home
- 69% English-only · Spanish 22% German/W. Germanic 3% Russian/Polish/Slavic 2%
Political lean MEDSL · Suffolk
- 2024 margin
- Lean R (+10.0) · D 45.0% · R 55.0%
- 2008→2024 swing
- -16.0pp toward R · 2008: 6.0pp · 2024: -10.0pp
- All cycles
- 2024: R+10.0 2020: R+0.0 2016: R+8.2 2012: D+2.9 2008: D+6.0
Not yet ingested
- Civics
- —
Market trends
- HPI YoY
- ▼ -143.97%
- Current HPI
- 462.3431
- Rent YoY
- —
- Metro
- —
- State GDP YoY
- ▲ 2.60%
- F500 in state
- 92
Industry mix (Fortune 500 HQ in NY)
| Industry | F500 HQs | Revenue |
|---|---|---|
| Financial Services | 10 | $950B |
|
||
| Consumer Goods | 9 | $162B |
|
||
| Insurance | 4 | $225B |
|
||
| Telecommunications | 2 | $144B |
|
||
| Pharmaceuticals | 2 | $112B |
|
||
| Media / Entertainment | 2 | $69B |
|
||
Price history
+16011.1% since first listed8 events — show timeline
- 2026-05-13 Listed $725,000 OneKey® MLS as Distributed by MLS Grid
- 2024-12-18 Rental Removed $3,800 ONEKEY
- 2024-11-26 Listed for Rent $3,800 ONEKEY
- 2024-11-26 Rental Removed $3,800 ONEKEY
- 2024-11-13 Listed for Rent $3,800 ONEKEY
- 2024-06-18 Rental Removed $4,000 ONEKEY
- 2024-05-14 Price Changed $4,000 ONEKEY
- 2024-04-28 Listed for Rent $4,500 ONEKEY
Cash-flow waterfall
monthlySold comps — $/sqft
last 12 mo · ≤1 miLoading sold comps…