 🏗️ New Construction
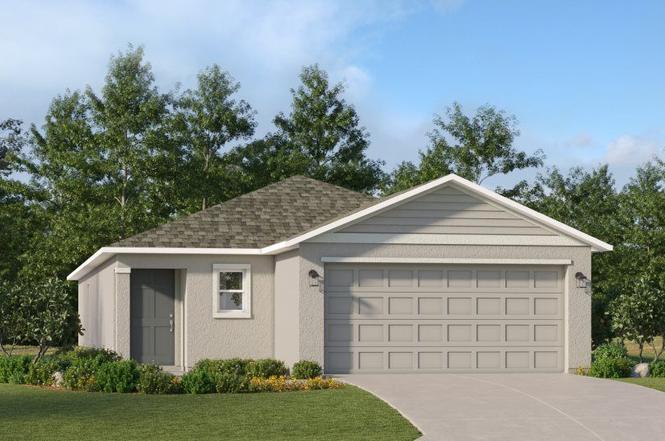
Belmont Plan · Lehigh Acres, FL
Flood risk 4/10 · Minor
- FEMA flood zone
- X (unshaded)
- Chance of flooding over 30 yrs
- 0.22%
- Est. flood insurance / yr
- $507 – $1,088
Fire risk 5/10 · Moderate
- Est. fire insurance / yr
- $947 – $1,759
Heat risk 10/10 · Severe
- Hot days now (above 108°F)
- 7 days/yr
- Hot days in 30 yrs
- 28 days/yr
Wind risk 10/10 · Severe
- Chance of severe wind over 30 yrs
- 99.0%
Air-quality risk 2/10 · Minimal
- Unhealthy air days now
- 1 days/yr
- Unhealthy air days in 30 yrs
- 2 days/yr
Risk factors via First Street. Map © Google.
Why this score? — see what drove the D+ grade
The composite is a weighted blend of 9 inputs, each scored 0–100. Each bar is that input's sub-score; the figure is the points it added to the 100-point composite (weight × sub-score).
- Cash flow +11.7/30.0
- Appreciation +10.0/10.0
- ARV discount +7.5/15.0
- Schools +4.1/10.0
- DSCR +3.5/10.0
- 1% rule +3.4/10.0
- Livability +3.0/5.0
- Condition / age +2.5/5.0
- Rent growth +1.3/5.0
$279,999
🖨 Deal sheet 📄 Offer letter ✓ Due diligence
Listing remarks
This new home is laid out on a single level for low maintenance living. Two secondary bedrooms share a bathroom in the hall at the front of the home, while the owner's suite is tucked into the back corner with an attached bathroom and walk-in closet. Down the foyer is the open-concept living area, which includes a fully equipped kitchen, an intimate dining room and family room with patio access. Completing the home is a convenient two-car garage.
Key facts
- Single level
- Patio access
- 2 garage spots
Tags
Property features AI
Finance
- Financial info: List price $279,999
Exterior
- Parking: 2-car garage / 2 total parking spaces
- Home design: Single-family plan (Belmont); Active listing
- Construction: New construction (Plan)
- Exterior features: Address: Lehigh Acres, FL (12451 Amber Waves Rd)
Interior
- Bedrooms: 3 bedrooms
- Bathrooms: 2 bathrooms (both full)
- Interior features: New construction plan (Belmont); Living area approximately 1429
Neighborhood map
What this means for you Summary
Snapshot
- This is a 3-bed/2.0-bath single-family listed at $280k.
Deal economics
- At list price, monthly cash flow is $-70 ($-840/yr) — negative.
- To cash-flow at today's rent, offer at most $236k (15.8% below list).
- To meet the 1% rule (rent ≥ 1% of price), the offer needs to be $206k (26.4% below list).
- Recommended offer: $206k (26.4% below list) — sets the bar for 1% rule.
- Cap rate 6.0% vs local median 4.7% in Lehigh Acres — meaningfully above typical; check what's discounted (condition, days-on-market, listing class) to confirm the premium yield is real.
Location & tenants
- Location reads 59/100 on livability (#826 in FL) — a working-class tenant base; expect higher turnover. Strengths: cost of living A+, housing A+; Watch: crime C-, employment D+, schools D-.
- Lee (suburban): math 47% / reading 50% proficiency, ranked #42 of 73 in FL (top 58%) — families likely to look elsewhere, expect single-tenant / working-renter base with shorter leases.
- Market conditions: Rents falling (-4.7%/yr); 2460 active listings in the ZIP; 40 comparable units currently listed for rent nearby; rentals at typical pace (median 19d on market — plan ~3-4 weeks tenant-placement turnaround); 15,411 units permitted in Lee County in 2024 (4,686 in 5+ unit buildings).
- This rent runs 34% of the median local income ($72k/yr) — at the standard rent-burdened threshold; future hikes will face affordability resistance.
Forward outlook
- In year one you build about $26k of equity ($2k loan paydown + $25k appreciation (10.0% local appreciation)).
- Lee County population projected at +44% by 2050 — long-run rental-demand tailwind backs the buy-and-hold thesis.
- At projected returns (10.0% appreciation + 0.0% rent growth), your $69k cash investment doubles in ~3 years — after that, you're playing with house money.
- By year 2, paydown + projected appreciation supports a ~$42k cash-out refi (75% LTV) — recoverable capital for the next deal without selling this one.
Negotiation context
- It's been on market 186 days — a 12% lower offer ($246k) is reasonable based on typical stale-listing flexibility.
Risks & watch-outs
- Climate carrying-cost: severe wind risk, 99% chance of damaging wind over 30y; moderate wildfire risk; extreme-heat days projected 7→28/yr by 2055 (HVAC capex compounding) — expect insurance premiums to compound above CPI over the hold.
Questions for the listing agent
- What do current leases actually rent for vs. the listed asking? Can we see a recent rent roll and the last 12 months of T-12 income?
- It's been on market 186 days. Have you received any prior offers? Is the seller open to a 26% concession, seller financing, or rate buy-down credit?
- Why hasn't it sold? Are there any deal-killer items the seller is aware of (foundation, flood, title, zoning, code violations)?
- Is there a deadline driving the sale (1031 exchange, divorce, estate, relocation)? That informs how much negotiation room exists.
- Schools are D-rated, which usually means shorter tenancies and higher turnover. Who's the typical renter profile here, and what's been the actual vacancy rate?
- The area grade is low — what's the realistic commute time and amenity access for the typical tenant pool here? Any planned neighborhood developments (good or bad) we should know about?
- What's the average days-on-market for RENTAL listings here right now (not sales)? A rising rental-DOM trend means longer vacancies and softer asking-rent achievability than the comps imply.
- What's the recent tenant-quality profile in this submarket — average credit score on applications, eviction rate, late-payment / NSF rate, and stable-employment percentage? A property-management company in the area should have these aggregated.
- How much new for-sale + rental construction is in the pipeline within 1–3 miles? Heavy new supply typically softens prices + rents 12–24 months out; constrained supply supports both.
Investment metrics
- 1% rule
- 0.84% ✗
- Cap rate
- 5.95%
- Cash-on-cash
- -1.22%
- DSCR
- 0.95
- GRM
- 9.9
CMA / ARV
- ARV (on-the-fly)
- $245,788
- Comps found
- 12
Show comp detail 12 sales within ~0.75 mi
| Address | Dist | Beds/Ba | Sqft | Sold | Price | $/sf | Match |
|---|---|---|---|---|---|---|---|
| 11905 Savanna Lakes Blvd | 0.13mi | 3/2.0 | 1,343 (-6%) | 5mo | $230,000 | $171 | 80 |
| 19741 Garden Ridge Ct | 0.33mi | 3/2.0 | 1,429 (0%) | 10mo | $241,250 | $169 | 76 |
| 19807 Garden Ridge Ct | 0.19mi | 3/2.0 | 1,450 (+2%) | 16mo | $300,000 | $207 | 76 |
| 11933 Savanna Lakes Blvd | 0.41mi | 3/2.0 | 1,487 (+4%) | 4mo | $245,000 | $165 | 70 |
| 11917 Savanna Lakes Blvd | 0.44mi | 3/2.0 | 1,487 (+4%) | 4mo | $254,000 | $171 | 70 |
| 11901 Savanna Lakes Blvd | 0.47mi | 3/2.0 | 1,487 (+4%) | 3mo | $255,597 | $172 | 69 |
| 426 Progress Ave | 0.64mi | 3/2.0 | 1,408 (-2%) | 2mo | $250,000 | $178 | 66 |
| 19611 Fairhill Ct | 0.73mi | 3/2.0 | 1,429 (0%) | 10mo | $242,597 | $170 | 58 |
| 354 Martineau Cir | 0.70mi | 3/2.0 | 1,487 (+4%) | 6mo | $269,597 | $181 | 56 |
| 19737 Garden Ridge Ct | 0.34mi | 3/2.0 | 1,263 (-12%) | 12mo | $255,000 | $202 | 55 |
| 19993 Lake Vista Cir N | 0.74mi | 3/2.0 | 1,540 (+8%) | 2mo | $250,000 | $162 | 51 |
| 414 Pinehurst Ave | 0.75mi | 3/2.0 | 1,629 (+14%) | 3mo | $365,000 | $224 | 39 |
Match score weights: distance 35% · size 25% · config 20% · recency 20%. Top-matched comps best support the ARV.
Projected returns pro-forma
10.0% appreciation · 0.0% rent growth · sell at horizon
- IRR
- 22.5%
- Equity multiple
- 2.79×
- Total profit
- $123,393
- Equity at exit
- $221,425
- IRR
- 19.5%
- Equity multiple
- 6.17×
- Total profit
- $356,123
- Equity at exit
- $477,512
Cash invested: $68,821 (down + closing). Projections, not guarantees.
Landlord ↔ Tenant lean methodology
- Overall (STATE)
- 87 Strongly Landlord-Friendly
- State Florida
- 87 Strongly Landlord-Friendly · R+3
- County
- — inherits STATE
- City
- — inherits STATE
ZIP-level market 33974
- Home prices YoY
- 5.8%
- Rents YoY
- -4.7%
- Active inventory
- 2460
- Price-to-rent
- 11.3×
Monthly cashflow live
- Estimated rent
- $2,061 high interval (Pro) →
- Mortgage (P&I)
- −$1,289
- Tax est. 1.5%
- −$307 /mo · $3,687/yr
- Insurance
- −$102
- HOA
- −$0
- Vacancy / Maint / Mgmt
- −$433
- Net cashflow
- $-70
Break-even live
UW: 25.0% down · 7.5% · 30yr · 1.5% tax · 5.0% vac · 8.0% maint · 8.0% mgmt
Financing live
Cash to close
- Down payment
- $61,447
- Closing costs
- $7,374
- Reserves months
- —
- Total cash needed
- —
Loan-product check · same deal, 3 products live
Conventional
25% down · 7.5% · 30yr
- Down + closing
- —
- Monthly P&I
- —
- Monthly cashflow
- —
- DSCR
- —
- Eligible?
- —
Personal DTI + credit; lowest rate.
DSCR
20% down · 8.5% · 30yr
- Down + closing
- —
- Monthly P&I
- —
- Monthly cashflow
- —
- DSCR
- —
- Eligible?
- —
No personal income docs; deal must DSCR.
Hard money
10% down · 12.0% · 12mo
- Down + closing
- —
- Monthly P&I
- —
- Monthly cashflow
- —
- DSCR
- —
- Eligible?
- —
Short-term bridge; refi at stabilization.
Rent comps 40 comps
| Address | Beds | Baths | Sqft | Rent | $/sqft | DOM | Units | Dist |
|---|---|---|---|---|---|---|---|---|
| 12321 Dakota Ridge Pl Lehigh Acres, FL | 3.0 | 2.0 | 1448 | $1,850 | $1.28 | 14d | 1 | 0.19mi |
| 19931 Green Pasture Rd Lehigh Acres, FL | 4.0 | 2.0 | 1817 | $2,248 | $1.24 | 23d | 1 | 0.24mi |
| 19750 Garden Ridge Ct Lehigh Acres, FL | 4.0 | 2.5 | 1400 | $2,200 | $1.57 | 23d | 1 | 0.31mi |
| 20190 Caroline Creek Pl Unit 250 Lehigh Acres, FL | 3.0 | 2.0 | 1448 | $2,200 | $1.52 | 23d | 1 | 0.32mi |
| 20190 Caroline Creek Pl Unit 250 Lehigh Acres, FL | 3.0 | 2.0 | 1448 | $1,900 | $1.31 | 3d | 1 | 0.32mi |
| 520 Creuset Ave S Lehigh Acres, FL | 2.0 | 2.0 | 1050 | $1,700 | $1.62 | 23d | 1 | 0.40mi |
| 11918 Savanna Lakes Blvd Lehigh Acres, FL | 3.0 | 2.0 | 1484 | $2,000 | $1.35 | 23d | 1 | 0.42mi |
| 20012 Petrucka Cir N Unit D Lehigh Acres, FL | 3.0 | 2.0 | 1517 | $1,750 | $1.15 | 23d | 1 | 0.46mi |
| 645 Homestead Rd S Lehigh Acres, FL | 3.0 | 2.0 | 1165 | $1,700 | $1.46 | 23d | 1 | 0.56mi |
| 19949 Lake Vista Cir N #1 Lehigh Acres, FL | 3.0 | 2.0 | 1442 | $1,800 | $1.25 | 23d | 1 | 0.66mi |
| 19949 Lake Vista Cir Unit 16C Lehigh Acres, FL | 3.0 | 2.0 | 1517 | $1,600 | $1.05 | 23d | 1 | 0.67mi |
| 510 Caywood Ave S Lehigh Acres, FL | 3.0 | 2.0 | 1582 | $2,664 | $1.68 | 23d | 1 | 0.68mi |
| 19933 Lake Vista Cir Lehigh Acres, FL | 3.0 | 2.0 | 1776 | $1,750 | $0.99 | 19d | 1 | 0.71mi |
| 20055 Lake Vista Cir N Lehigh Acres, FL | 3.0 | 2.0 | 1442 | $1,700 | $1.18 | 23d | 1 | 0.72mi |
| 463 Piedmont St Unit 463 Lehigh Acres, FL | 3.0 | 2.0 | 1200 | $1,350 | $1.12 | 3d | 1 | 0.72mi |
| 598 Aston Lake Ct Lehigh Acres, FL | 3.0 | 2.0 | 1703 | $2,395 | $1.41 | 21d | 1 | 0.74mi |
| 606 Morningmist Ln Lehigh Acres, FL | 4.0 | 2.5 | 1817 | $2,295 | $1.26 | 3d | 1 | 0.74mi |
| 515 Croydon Ave S Lehigh Acres, FL | 3.0 | 3.0 | 1253 | $2,200 | $1.76 | 3d | 1 | 0.76mi |
| 438 Poplar St Lehigh Acres, FL | 3.0 | 2.0 | 1640 | $2,150 | $1.31 | 3d | 1 | 0.77mi |
| 448 Grant Blvd Unit 1 Lehigh Acres, FL | 3.0 | 2.0 | 1244 | $1,650 | $1.33 | 21d | 1 | 0.78mi |
| 448 Grant Blvd Unit 1 Lehigh Acres, FL | 2.0 | 2.0 | 1244 | $1,595 | $1.28 | 1d | 1 | 0.78mi |
| 448 Grant Blvd Unit 1 Lehigh Acres, FL | 2.0 | 2.0 | 1244 | $1,595 | $1.28 | 1d | 1 | 0.78mi |
| 442 Grant Blvd Lehigh Acres, FL | 3.0 | 2.0 | 1199 | $1,625 | $1.36 | 13d | 1 | 0.80mi |
| 696 Homestead Rd S Lehigh Acres, FL | 4.0 | 2.0 | 1777 | $2,200 | $1.24 | 23d | 1 | 0.81mi |
| 19542 Fairhill Ct Lehigh Acres, FL | 3.0 | 2.0 | 1429 | $1,700 | $1.19 | 23d | 1 | 0.84mi |
| 351 Ranchito Ave Lehigh Acres, FL | 3.0 | 2.5 | 1500 | $2,000 | $1.33 | 23d | 1 | 0.87mi |
| 448 Reading St Lehigh Acres, FL | 3.0 | 2.0 | 1100 | $1,890 | $1.72 | 3d | 1 | 0.91mi |
| 304 Preston St Unit 304 Lehigh Acres, FL | 3.0 | 2.0 | 1519 | $2,350 | $1.55 | 23d | 1 | 0.91mi |
| 304 Preston St Lehigh Acres, FL | 3.0 | 2.0 | 1590 | $2,150 | $1.35 | 3d | 1 | 0.92mi |
| 437 Reading St Lehigh Acres, FL | 4.0 | 2.0 | 1833 | $1,795 | $0.98 | 1d | 1 | 0.92mi |
| 567 Charwood Ave S Lehigh Acres, FL | 3.0 | 2.0 | 1564 | $1,900 | $1.21 | 14d | 1 | 0.92mi |
| 337 Marabou Dr Lehigh Acres, FL | 3.0 | 2.0 | 1850 | $2,300 | $1.24 | 3d | 1 | 0.93mi |
| 546 Whispering Wind Bnd Lehigh Acres, FL | 3.0 | 2.0 | 1437 | $1,950 | $1.36 | 1d | 1 | 0.95mi |
| 363 Grant Blvd Lehigh Acres, FL | 3.0 | 2.0 | 1158 | $1,700 | $1.47 | 23d | 1 | 0.97mi |
| 532 Ilaria Ct Lehigh Acres, FL | 4.0 | 2.0 | 1598 | $2,300 | $1.44 | 15d | 1 | 0.97mi |
| 337 Rancho Ave Lehigh Acres, FL | 3.0 | 2.0 | 1723 | $2,150 | $1.25 | 23d | 1 | 0.98mi |
| 357 Grant Blvd Lehigh Acres, FL | 3.0 | 2.0 | 1200 | $1,800 | $1.50 | 15d | 1 | 0.99mi |
| 430 Petite Ave Lehigh Acres, FL | 3.0 | 2.0 | 1189 | $1,850 | $1.56 | 14d | 1 | 1.01mi |
| 334 Ranch Ave Lehigh Acres, FL | 3.0 | 2.0 | 1645 | $2,150 | $1.31 | 3d | 1 | 1.01mi |
| 397 Carrillon Ave S Lehigh Acres, FL | 3.0 | 2.0 | 1200 | $1,550 | $1.29 | 3d | 1 | 1.01mi |
Listing history 8 events
-
2026-06-17days on market $279,999 Active 186 DOM
-
2026-06-16days on market $279,999 Active 185 DOM
-
2026-06-16days on market $279,999 Active 184 DOM
-
2026-06-13days on market $279,999 Active 182 DOM
-
2026-06-09days on market $279,999 Active 178 DOM
-
2026-06-07days on market $279,999 Active 176 DOM
-
2026-06-01days on market $279,999 Active 170 DOM
-
2026-06-01days on market $279,999 Active 169 DOM
ⓘ Source: listings_history table (triggers on properties + properties_extension) + one-shot
backfill from property_details.listing_events for pre-trigger history.
Climate risk First Street
- Flood 4/10 Moderate FEMA zone X (unshaded) · 22% chance over 30 yrs
- Wildfire 5/10 Major
- Heat 10/10 Extreme 7 d/yr ≥108°F today · 28 d/yr by 30 yrs out
- Wind 10/10 Extreme 99% chance of damaging wind over 30 yrs
- Air quality 2/10 Low 1 unhealthy d/yr today · 2 by 30 yrs out
Nearby sold comps map
Loading sold comps map…
Walkable amenities ~0.75 mi
Loading nearby amenities…
Taxation est. · year 1
- Rental income
- $24,738
- − Mortgage interest
- −$13,768
- − Property taxes
- −$3,687
- − Insurance
- −$1,229
- − Repairs & maintenance
- −$1,979
- − Management
- −$1,979
- − Depreciation
- −$7,150
- Taxable loss
- −$5,054
- Est. tax savings @ 24.0%
- +$1,213
- After-tax cash flow
- $373/yr
For passive investors: Depreciation is non-cash, so a rental often shows a tax loss while cash-flowing — sheltering income. Rental losses are passive: they offset passive income freely, and up to $25,000/yr can offset ordinary (W-2) income if you actively participate and your MAGI is under $100k (phasing out to $0 by $150k); unused losses carry forward. On sale, claimed depreciation is recaptured at up to 25%, and gains may owe capital-gains tax (a 1031 exchange can defer both). Figures are a year-1 estimate at your 24.0% rate — not tax advice; consult a CPA.
Schools (NCES district)
- District
- Lee
- NCES district ID
- 1201080
- Math proficiency
- 47% ▼ -11.00%
- Reading proficiency
- 50% ▼ -4.00%
- Median HH income
- $49,518
- Composite
- 41.49/100
- National rank
- #3458
- State rank
- #42 of 73 in FL
Livability — Lehigh Acres
- Score
- 59/100
- State rank
- #826
- US rank
- #20055
Category grades
Schools grade is shown separately in the Schools card above.
Census & demographics
- Census place
- Lehigh Acres, FL
- County
- Lee County · 788,662 people
- City population
- 130,638
- Metro
- Cape Coral-Fort Myers, FL
- Population (ZIP)
- 19,927
- Household income
- $72,192
- Rent vs Own
- Severe rent burden
- 434.0
Population outlook (Lee County) Hauer SSP2
- Today (2025)
- 871,946 people
- By 2030
- 955,468 · +9.6%
- By 2040
- 1,113,587 · +27.7%
- By 2050
- 1,256,891 · +44.1%
- By 2075
- 1,560,270 · +78.9%
- By 2100
- 1,726,848 · +98.0%
Race, ethnicity, and origin ACS 2023
- Neighborhood character
- Diverse neighborhood (Simpson 0.64)
- Race & ethnicity
- Hispanic / Latino 52% Two or more races 31% White 26% Black 18%
- Hispanic origin (detail)
- Mexican 12% Puerto Rican 7% Cuban 20% Dominican 4%
- Common ancestry
- Hispanic 7% Italian 1% Portuguese 1%
- Foreign-born
- 32% · Canada, Jamaica
- Languages at home
- 48% English-only · Spanish 43% French/Haitian/Cajun 7% Other Indo-European 1%
Political lean MEDSL · Lee
- 2024 margin
- Strong R (+28.4) · D 35.5% · R 63.9%
- 2008→2024 swing
- -18.0pp toward R · 2008: -10.4pp · 2024: -28.4pp
- All cycles
- 2024: R+28.4 2020: R+19.2 2016: R+20.4 2012: R+16.6 2008: R+10.4
Not yet ingested
- Civics
- —
Market trends
- HPI YoY
- ▲ 16.53%
- Current HPI
- 303.3399
- Rent YoY
- ▼ -4.68%
- Metro
- Cape Coral-Fort Myers, FL
- State GDP YoY
- ▲ 3.28%
- F500 in state
- 36
Industry mix (Fortune 500 HQ in FL)
| Industry | F500 HQs | Revenue |
|---|---|---|
| Industrial Technology | 2 | $29B |
|
||
| Insurance | 2 | $17B |
|
||
| Retail | 1 | $60B |
|
||
| Technology Distribution | 1 | $58B |
|
||
| Homebuilding | 1 | $35B |
|
||
| Technology Manufacturing | 1 | $35B |
|
||
Cash-flow waterfall
monthlySold comps — $/sqft
last 12 mo · ≤1 miLoading sold comps…