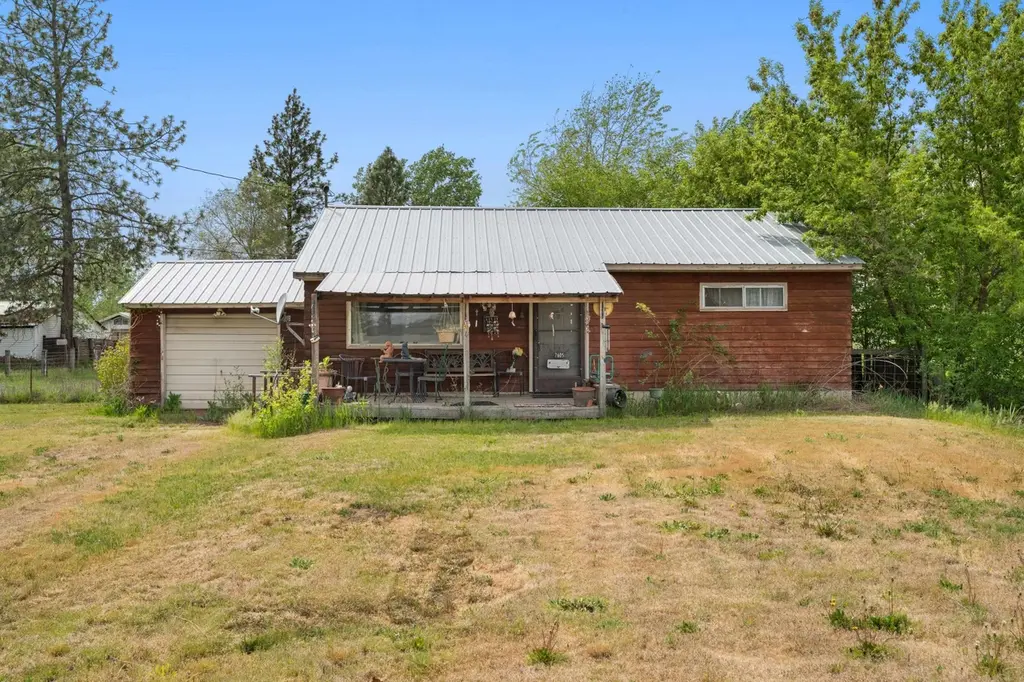
7605 N Regal St · Spokane, WA
Flood risk 1/10 · Minimal
- FEMA flood zone
- X (unshaded)
- Chance of flooding over 30 yrs
- 0.0%
- Est. flood insurance / yr
- $473 – $860
Fire risk 6/10 · Moderate
- Est. fire insurance / yr
- $604 – $1,122
Heat risk 3/10 · Minor
- Hot days now (above 94°F)
- 7 days/yr
- Hot days in 30 yrs
- 15 days/yr
Wind risk 1/10 · Minimal
- Chance of severe wind over 30 yrs
- —
Air-quality risk 10/10 · Severe
- Unhealthy air days now
- 19 days/yr
- Unhealthy air days in 30 yrs
- 21 days/yr
Risk factors via First Street. Map © Google.
Why this score? — see what drove the D grade
The composite is a weighted blend of 9 inputs, each scored 0–100. Each bar is that input's sub-score; the figure is the points it added to the 100-point composite (weight × sub-score).
- ARV discount +15.0/15.0
- Cash flow +7.0/30.0
- Rent growth +4.9/5.0
- Schools +4.6/10.0
- Livability +4.0/5.0
- Condition / age +2.5/5.0
- 1% rule +1.6/10.0
- DSCR +1.2/10.0
- Appreciation +0.0/10.0
$189,000
🖨 Deal sheet (PDF) 📄 Offer letter ✓ Due diligence
Listing remarks
ATTENTION INVESTORS! Opportunity awaits with this 2-bedroom, 1-bath home situated on a spacious 1/2 acre lot. Featuring a full basement with potential to add additional bedroom(s), a bathroom, or expanded living space, this property offers plenty of upside for investors, flippers, or buyers looking to build equity. With room to customize and improve, the large lot provides added flexibility for outdoor space, parking, or future possibilities. Bring your vision and unlock the potential this property has to offer!
Key facts
- Full basement
- Spacious lot
- 0.51 acre lot
Tags
Property features AI
Exterior
- Parking: Attached garage (1 car)
- Utilities: High-speed internet available
- Home design: Single family residence; One-story structure; Residential property
- Construction: Wood siding exterior; Metal roof; Below-grade finished area of 792 sq ft
- Exterior features: Level, oversized lot with fencing; Paved road and city street frontage
Interior
- Bedrooms: 2 bedrooms
- Heating & cooling: Electric heating
- Interior features: Full unfinished basement (792 sq ft below grade finished area listed separately)
Neighborhood map
What this means for you Summary
Snapshot
- This is a 2-bed/1.0-bath single-family listed at $189k.
Deal economics
- At list price, monthly cash flow is $-280 ($-3k/yr) — negative.
- To cash-flow at today's rent, offer at most $140k (26.2% below list).
- To meet the 1% rule (rent ≥ 1% of price), the offer needs to be $125k (33.6% below list).
- Recommended offer: $125k (33.6% below list) — sets the bar for 1% rule.
- Cap rate 4.5% vs local median 3.2% in Spokane — top-decile yield for the area; either an underpriced asset or a hidden risk that comps aren't pricing in. Stress-test before assuming the spread holds.
Location & tenants
- Location reads 80/100 on livability (#93 in WA, #1,822 nationally) — a professional / high-income tenant draw. Strengths: amenities A+, commute A+, housing A+; Watch: crime F.
- Spokane School District (urban): math 47% / reading 58% proficiency, ranked #136 of 291 in WA (top 47%) — acceptable for families but not a draw, mixed tenant base, ~2y average lease.
- Zoned schools: Arlington Elementary (399 students, 84% FRL); Rogers High School (1,536 students, 83% FRL) — zoned schools average 84% FRL vs 50% district-wide (34 pts higher); higher-poverty schools than district average — tighter screening recommended.
- Market conditions: Rents rising fast (+9.5%/yr); 207 active listings in the ZIP; 23 comparable units currently listed for rent nearby; rentals at typical pace (median 24d on market — plan ~3-4 weeks tenant-placement turnaround); 3,608 units permitted in Spokane County in 2024 (1,792 in 5+ unit buildings).
Forward outlook
- Local home prices are declining (-3.0%/yr); year-one equity from $1k of loan paydown is wiped out by about $6k of value loss. Plan a longer hold.
- Spokane County population projected at +13% by 2050 — modest demand growth; plan on rents tracking national, not racing it.
Negotiation context
- Only 1 days on market — expect competitive offers; lowballing is unlikely to land.
Risks & watch-outs
- Watch-outs: built in 1958 — expect roof / HVAC / electrical / plumbing capex.
- Climate carrying-cost: major wildfire risk — expect insurance premiums to compound above CPI over the hold.
Questions for the listing agent
- What do current leases actually rent for vs. the listed asking? Can we see a recent rent roll and the last 12 months of T-12 income?
- Built in 1958 — when were the roof, HVAC, electrical panel, plumbing, and water heater last replaced?
- Is there a deadline driving the sale (1031 exchange, divorce, estate, relocation)? That informs how much negotiation room exists.
- Schools are B-rated — typically a magnet for longer-tenancy family renters. What's the average tenant stay here, and is there a school-zone premium baked into asking?
- Crime grade is F in this area — have there been break-ins, vandalism, or insurance claims at this property in the last 3 years? What carrier currently insures it and at what premium?
- The area grade is low — what's the realistic commute time and amenity access for the typical tenant pool here? Any planned neighborhood developments (good or bad) we should know about?
- What's the average days-on-market for RENTAL listings here right now (not sales)? A rising rental-DOM trend means longer vacancies and softer asking-rent achievability than the comps imply.
- What's the recent tenant-quality profile in this submarket — average credit score on applications, eviction rate, late-payment / NSF rate, and stable-employment percentage? A property-management company in the area should have these aggregated.
- How much new for-sale + rental construction is in the pipeline within 1–3 miles? Heavy new supply typically softens prices + rents 12–24 months out; constrained supply supports both.
Investment metrics
- 1% rule
- 0.66% ✗
- Cap rate
- 4.52%
- Cash-on-cash
- -6.34%
- DSCR
- 0.72
- GRM
- 12.6
CMA / ARV
- ARV (on-the-fly)
- $286,704
- Comps found
- 2
Show comp detail 2 sales within ~0.75 mi
| Address | Dist | Beds/Ba | Sqft | Sold | Price | $/sf | Match |
|---|---|---|---|---|---|---|---|
| 2728 E Weile Ave | 0.33mi | 2/1.0 | 814 (+3%) | 15mo | $265,000 | $326 | 67 |
| 2223 E Weile Ave | 0.45mi | 3/1.0 (+1) | 704 (-11%) | 11mo | $255,000 | $362 | 46 |
Match score weights: distance 35% · size 25% · config 20% · recency 20%. Top-matched comps best support the ARV.
Projected returns pro-forma
-3.0% appreciation · 8.0% rent growth · sell at horizon
- IRR
- -22.0%
- Equity multiple
- 0.21×
- Total profit
- $-41,819
- Equity at exit
- $28,181
- IRR
- -7.2%
- Equity multiple
- 0.45×
- Total profit
- $-29,193
- Equity at exit
- $16,341
Cash invested: $52,920 (down + closing). Projections, not guarantees.
Landlord ↔ Tenant lean methodology
- Overall (STATE)
- 28 Tenant-Leaning
- State Washington
- 28 Tenant-Leaning · D+8
- County
- — inherits STATE
- City
- — inherits STATE
ZIP-level market 99217
- Home prices YoY
- -30.7%
- Rents YoY
- 9.5%
- Active inventory
- 207
- Price-to-rent
- 12.6×
Monthly cashflow live
- Estimated rent
- $1,255 high interval (Pro) →
- Mortgage (P&I)
- −$991
- Tax from tax record
- −$201 /mo · $2,414/yr
- Insurance
- −$79
- HOA
- −$0
- Vacancy / Maint / Mgmt
- −$263
- Net cashflow
- $-280
Break-even live
Sensitivity live
| Price | -10% $-173 | -5% $-226 | +0% $-280 | +5% $-333 | +10% $-387 |
|---|---|---|---|---|---|
| Rent | -10% $-379 | -5% $-329 | +0% $-280 | +5% $-230 | +10% $-181 |
| Rate | -1.0pp $-185 | -0.5pp $-232 | base $-280 | +0.5pp $-329 | +1.0pp $-379 |
UW: 25.0% down · 7.5% · 30yr · 1.5% tax · 5.0% vac · 8.0% maint · 8.0% mgmt
Financing live
Cash to close
- Down payment
- $47,250
- Closing costs
- $5,670
- Reserves months
- —
- Total cash needed
- —
Loan-product check · same deal, 3 products live
Conventional
25% down · 7.5% · 30yr
- Down + closing
- —
- Monthly P&I
- —
- Monthly cashflow
- —
- DSCR
- —
- Eligible?
- —
Personal DTI + credit; lowest rate.
DSCR
20% down · 8.5% · 30yr
- Down + closing
- —
- Monthly P&I
- —
- Monthly cashflow
- —
- DSCR
- —
- Eligible?
- —
No personal income docs; deal must DSCR.
Hard money
10% down · 12.0% · 12mo
- Down + closing
- —
- Monthly P&I
- —
- Monthly cashflow
- —
- DSCR
- —
- Eligible?
- —
Short-term bridge; refi at stabilization.
Rent comps 23 comps
| Address | Beds | Baths | Sqft | Rent | $/sqft | DOM | Units | Dist |
|---|---|---|---|---|---|---|---|---|
| 6229 N Regal St Unit B Spokane, WA | 2.0 | 1.0 | 822 | $1,150 | $1.40 | 24d | 1 | 0.79mi |
| 1718 E Lincoln Rd Spokane, WA | 1.0–2.0 | 1.0–2.0 | 975 | $1,795 | $1.84 | 14d | 10 | 0.82mi |
| 2414 E Francis Ave Unit 1 Spokane, WA | 2.0 | 1.0 | 800 | $1,200 | $1.50 | 14d | 1 | 0.82mi |
| 6105 N Regal St Unit B Spokane, WA | 2.0 | 1.5 | 600 | $1,295 | $2.16 | 14d | 1 | 0.87mi |
| 3015 E Central Ave Apt 1 Spokane, WA | 2.0 | 1.0 | 736 | $1,000 | $1.36 | 24d | 1 | 1.02mi |
| 7808 N Morton St Unit 631 Spokane, WA | 1.0 | 1.0 | 660 | $1,050 | $1.59 | 24d | 1 | 1.04mi |
| 1011 E Sharpsburg Ave Unit 574 Spokane, WA | 1.0 | 1.0 | 660 | $1,065 | $1.61 | 24d | 1 | 1.11mi |
| 1015 E Cozza Dr Unit 165 Spokane, WA | 1.0 | 1.0 | 660 | $1,010 | $1.53 | 14d | 1 | 1.13mi |
| 1015 E Cozza Dr Unit 41 Spokane, WA | 1.0 | 1.0 | 660 | $1,065 | $1.61 | 24d | 1 | 1.14mi |
| 1015 E Cozza Dr Unit 14 Spokane, WA | 2.0 | 1.0 | 902 | $1,110 | $1.23 | 24d | 1 | 1.14mi |
| 1015 E Cozza Dr Unit 65 Spokane, WA | 1.0 | 1.0 | 660 | $1,065 | $1.61 | 14d | 1 | 1.14mi |
| 1011 E Sharpsburg Ave Unit 494 Spokane, WA | 2.0 | 1.0 | 902 | $1,150 | $1.27 | 24d | 1 | 1.14mi |
| 1015 E Cozza Dr Unit 160 Spokane, WA | 1.0 | 1.0 | 660 | $1,010 | $1.53 | 24d | 1 | 1.15mi |
| 1015 E Cozza Dr Unit 167 Spokane, WA | 1.0 | 1.0 | 660 | $1,050 | $1.59 | 24d | 1 | 1.15mi |
| 8424 N Nevada St Unit 308 Spokane, WA | 1.0 | 1.0 | 660 | $1,065 | $1.61 | 24d | 1 | 1.17mi |
| 6980 N Nevada St Spokane, WA | 1.0–2.0 | 1.0 | 622 | $1,383 | $2.22 | 24d | 1 | 1.23mi |
| 8424 N Nevada St Unit 54 Spokane, WA | 1.0 | 1.0 | 660 | $1,050 | $1.59 | 24d | 1 | 1.27mi |
| 8424 N Nevada St Unit 412 Spokane, WA | 1.0 | 1.0 | 660 | $1,010 | $1.53 | 44d | 1 | 1.27mi |
| 8424 N Nevada St Apt 314 Spokane, WA | 1.0 | 1.0 | 660 | $1,065 | $1.61 | 44d | 1 | 1.27mi |
| 2506 E Rowan Ave Unit 2508 Spokane, WA | 2.0 | 1.0 | 760 | $1,350 | $1.78 | 24d | 1 | 1.30mi |
| 901 E Holyoke Ave Spokane, WA | 1.0 | 1.0 | 588 | $1,075 | $1.83 | 24d | 3 | 1.39mi |
| 3018 E Everett Ave Unit B101 Spokane, WA | 1.0 | 1.0 | 600 | $1,100 | $1.83 | 14d | 1 | 1.40mi |
| 910 E Holyoke Ave Spokane, WA | 1.0–2.0 | 1.0 | 755 | $1,425 | $1.89 | 14d | 4 | 1.41mi |
Listing history 2 events
-
2026-05-09status Pending
-
2026-05-07$189,000 Active
ⓘ Source: listings_history table (triggers on properties + properties_extension) + one-shot
backfill from property_details.listing_events for pre-trigger history.
Tax reassessment forecast WA · Resets to sale price
- Current annual tax
- $2,414 · $201/mo
- Projected year-2 tax
- $2,414 · $201/mo
- Expected delta
- $0/yr ($0/mo · 0.0%)
ⓘ Screening estimate from a state-policy table — verify with the county assessor before closing.
Climate risk First Street
- Flood 1/10 Low FEMA zone X (unshaded) · 0% chance over 30 yrs
- Wildfire 6/10 Major
- Heat 3/10 Moderate 7 d/yr ≥94°F today · 15 d/yr by 30 yrs out
- Wind 1/10 Low
- Air quality 10/10 Extreme 19 unhealthy d/yr today · 21 by 30 yrs out
Nearby sold comps map
Loading sold comps map…
Walkable amenities ~0.75 mi
Loading nearby amenities…
Taxation est. · year 1
- Rental income
- $15,057
- − Mortgage interest
- −$10,587
- − Property taxes
- −$2,414
- − Insurance
- −$945
- − Repairs & maintenance
- −$1,205
- − Management
- −$1,205
- − Depreciation
- −$5,498
- Taxable loss
- −$6,796
- Est. tax savings @ 24.0%
- +$1,631
- After-tax cash flow
- $-1,727/yr
For passive investors: Depreciation is non-cash, so a rental often shows a tax loss while cash-flowing — sheltering income. Rental losses are passive: they offset passive income freely, and up to $25,000/yr can offset ordinary (W-2) income if you actively participate and your MAGI is under $100k (phasing out to $0 by $150k); unused losses carry forward. On sale, claimed depreciation is recaptured at up to 25%, and gains may owe capital-gains tax (a 1031 exchange can defer both). Figures are a year-1 estimate at your 24.0% rate — not tax advice; consult a CPA.
Schools (NCES district)
- District
- Spokane School District
- NCES district ID
- 5308250
- Math proficiency
- 47% ▲ 1.00%
- Reading proficiency
- 58% ▲ 1.00%
- Median HH income
- $43,187
- Composite
- 46.1/100
- National rank
- #5477
- State rank
- #136 of 291 in WA
Livability — Spokane
- Score
- 80/100
- State rank
- #93
- US rank
- #1822
Category grades
Schools grade is shown separately in the Schools card above.
Census & demographics
- County
- Spokane County · 496,401 people
- City population
- 298,820
- Metro
- Spokane-Spokane Valley, WA
- Population (ZIP)
- 21,441
- Household income
- $73,620
- Rent vs Own
- Severe rent burden
- 630.0
Population outlook (Spokane County) Hauer SSP2
- Today (2025)
- 531,314 people
- By 2030
- 549,278 · +3.4%
- By 2040
- 577,822 · +8.8%
- By 2050
- 598,188 · +12.6%
- By 2075
- 630,744 · +18.7%
- By 2100
- 622,360 · +17.1%
Race, ethnicity, and origin ACS 2023
- Neighborhood character
- Predominantly White (79%)
- Race & ethnicity
- White 79% Two or more races 10% Hispanic / Latino 8% Asian 4% Pacific Islander 1% Native American 1%
- Hispanic origin (detail)
- Mexican 6%
- Common ancestry
- Portuguese 4% Scotch-Irish 4% Iranian 3%
- Foreign-born
- 12% · Canada, Vietnam
- Languages at home
- 85% English-only · Russian/Polish/Slavic 6% Spanish 3% Other Asian/Pacific 2%
Political lean MEDSL · Spokane
- 2024 margin
- Toss-up / Even · D 46.0% · R 51.0% · Other 3.0%
- 2008→2024 swing
- -3.8pp toward R · 2008: -1.1pp · 2024: -5.0pp
- All cycles
- 2024: R+5.0 2020: R+4.3 2016: R+8.3 2012: R+6.3 2008: R+1.1
Not yet ingested
- Civics
- —
Market trends
- HPI YoY
- ▼ -152.19%
- Current HPI
- 343.0283
- Rent YoY
- ▲ 9.52%
- Metro
- Spokane-Spokane Valley, WA
- State GDP YoY
- ▲ 4.65%
- F500 in state
- 22
Industry mix (Fortune 500 HQ in WA)
| Industry | F500 HQs | Revenue |
|---|---|---|
| Retail | 2 | $269B |
|
||
| Technology / Retail | 1 | $638B |
|
||
| Technology | 1 | $245B |
|
||
| Telecommunications | 1 | $38B |
|
||
| Food / Beverage | 1 | $36B |
|
||
| Automotive / Trucks | 1 | $34B |
|
||
Price history
2 events — show timeline
- 2026-05-09 Pending — SPOKANEMLS as Distributed by MLS Grid
- 2026-05-07 Listed $189,000 SPOKANEMLS as Distributed by MLS Grid
Property tax history
+34.3%/yrLatest (2026): $2,414 · +2213.0% YoY. Source: county tax records.
Cash-flow waterfall
monthlySold comps — $/sqft
last 12 mo · ≤1 miLoading sold comps…