10201 Neptune Ct · Waco, TX
Flood risk 1/10 · Minimal
- FEMA flood zone
- X (unshaded)
- Chance of flooding over 30 yrs
- 0.0%
- Est. flood insurance / yr
- $507 – $1,088
Fire risk 6/10 · Moderate
- Est. fire insurance / yr
- $1,222 – $2,270
Heat risk 7/10 · Major
- Hot days now (above 109°F)
- 7 days/yr
- Hot days in 30 yrs
- 23 days/yr
Wind risk 6/10 · Moderate
- Chance of severe wind over 30 yrs
- 61.0%
Air-quality risk 2/10 · Minimal
- Unhealthy air days now
- 0 days/yr
- Unhealthy air days in 30 yrs
- 1 days/yr
Risk factors via First Street. Map © Google.
Why this score? — see what drove the D grade
The composite is a weighted blend of 9 inputs, each scored 0–100. Each bar is that input's sub-score; the figure is the points it added to the 100-point composite (weight × sub-score).
- Cash flow +11.2/30.0
- ARV discount +11.0/15.0
- Schools +5.1/10.0
- Condition / age +4.0/5.0
- Livability +3.7/5.0
- 1% rule +3.3/10.0
- DSCR +3.3/10.0
- Rent growth +2.3/5.0
- Appreciation +0.0/10.0
$290,530
🖨 Deal sheet 📄 Offer letter ✓ Due diligence
Listing remarks
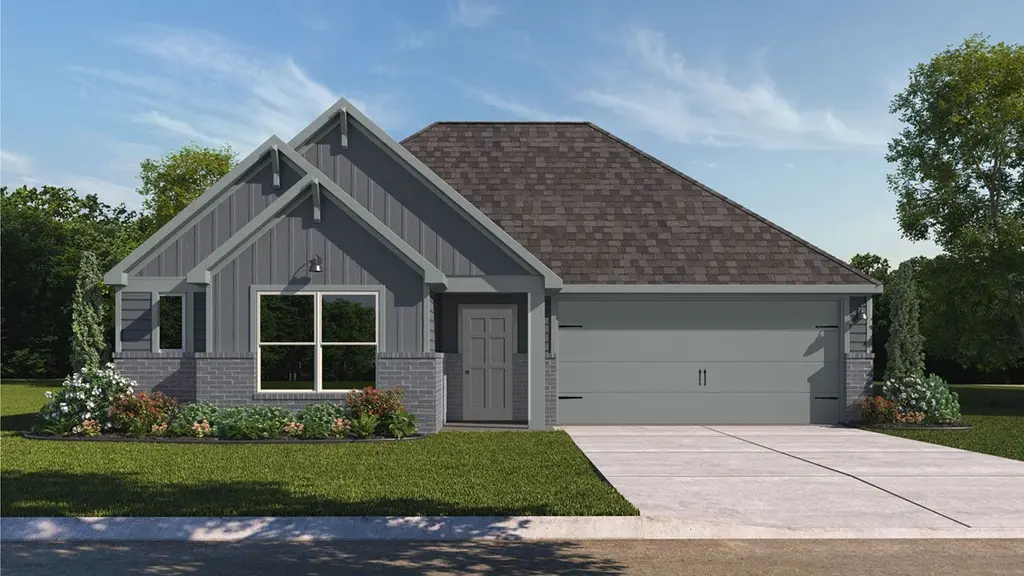
Introducing the Fargo floorplan at Eagles Landing in China Spring, Texas, where every square foot is put-to-use with sophistication and comfort. You'll be calling the approximately 1,665 square foot, single-story, 2-car garage, and covered patio your new home. The 4-bedroom, 2-bathroom floorplan is perfect for you with the open concept living area. The kitchen, dining area, and living area creates a spacious environment. You'll find flat panel birch cabinetry and granite countertops in the kitchen. The kitchen includes a breakfast bar and corner pantry. The secondary bedrooms are cozy and carpeted, with plenty of closet space. The laundry room and a secondary bathroom are perfectly place ne
Key facts
- 2 garage spots
- Built 2026
- Listed 26 days
Property features AI
Finance
- Financial info: List price $290,530
Exterior
- Home design: Single-family home, Fargo plan; Active listing
- Construction: Living area approximately 1665; Built as a new construction (spec)
Interior
- Bedrooms: 4 bedrooms
- Bathrooms: 2 full bathrooms
- Interior features: Spec home (Fargo plan)
Neighborhood map
What this means for you Summary
Snapshot
- This is a 4-bed/2.0-bath single-family listed at $291k. Condition is rated good.
Deal economics
- At list price, monthly cash flow is $-110 ($-1k/yr) — negative.
- To cash-flow at today's rent, offer at most $275k (5.5% below list).
- To meet the 1% rule (rent ≥ 1% of price), the offer needs to be $240k (17.3% below list).
- Recommended offer: $240k (17.3% below list) — sets the bar for 1% rule.
- Cap rate 5.8% vs local median 3.9% in Waco — top-decile yield for the area; either an underpriced asset or a hidden risk that comps aren't pricing in. Stress-test before assuming the spread holds.
Location & tenants
- Location reads 74/100 on livability (#166 in TX, #4,378 nationally) — a middle-class / working-renter tenant base. Strengths: cost of living A+, housing A+, health & safety A+; Watch: schools D, crime D, commute F.
- China Spring ISD (rural): math 58% / reading 56% proficiency, ranked #70 of 826 in TX (top 8%) — acceptable for families but not a draw, mixed tenant base, ~2y average lease.
- Market conditions: Rents soft (-0.8%/yr); 376 active listings in the ZIP; 4 comparable units currently listed for rent nearby; rentals at typical pace (median 21d on market — plan ~3-4 weeks tenant-placement turnaround); 1,014 units permitted in McLennan County in 2024 (200 in 5+ unit buildings).
- This rent runs 42% of the median local income ($69k/yr) — at the standard rent-burdened threshold; future hikes will face affordability resistance.
Forward outlook
- Local home prices are declining (-3.0%/yr); year-one equity from $2k of loan paydown is wiped out by about $9k of value loss. Plan a longer hold.
- McLennan County population projected at +17% by 2050 — long-run rental-demand tailwind backs the buy-and-hold thesis.
Negotiation context
- It's been on market 27 days — a 2% lower offer ($286k) is reasonable based on typical stale-listing flexibility.
Risks & watch-outs
- Climate carrying-cost: major wind risk, 61% chance of damaging wind over 30y; major wildfire risk; extreme-heat days projected 7→23/yr by 2055 (HVAC capex compounding) — expect insurance premiums to compound above CPI over the hold.
Questions for the listing agent
- What do current leases actually rent for vs. the listed asking? Can we see a recent rent roll and the last 12 months of T-12 income?
- Is there a deadline driving the sale (1031 exchange, divorce, estate, relocation)? That informs how much negotiation room exists.
- Schools are D-rated, which usually means shorter tenancies and higher turnover. Who's the typical renter profile here, and what's been the actual vacancy rate?
- Crime grade is D in this area — have there been break-ins, vandalism, or insurance claims at this property in the last 3 years? What carrier currently insures it and at what premium?
- The area grade is low — what's the realistic commute time and amenity access for the typical tenant pool here? Any planned neighborhood developments (good or bad) we should know about?
- What's the average days-on-market for RENTAL listings here right now (not sales)? A rising rental-DOM trend means longer vacancies and softer asking-rent achievability than the comps imply.
- What's the recent tenant-quality profile in this submarket — average credit score on applications, eviction rate, late-payment / NSF rate, and stable-employment percentage? A property-management company in the area should have these aggregated.
- How much new for-sale + rental construction is in the pipeline within 1–3 miles? Heavy new supply typically softens prices + rents 12–24 months out; constrained supply supports both.
Investment metrics
- 1% rule
- 0.83% ✗
- Cap rate
- 5.84%
- Cash-on-cash
- -1.62%
- DSCR
- 0.93
- GRM
- 10.1
CMA / ARV
- ARV (on-the-fly)
- $314,685
- Comps found
- 12
Show comp detail 12 sales within ~0.75 mi
| Address | Dist | Beds/Ba | Sqft | Sold | Price | $/sf | Match |
|---|---|---|---|---|---|---|---|
| 5500 Black Horse | 0.40mi | 4/2.0 | 1,640 (-2%) | 10mo | $325,000 | $198 | 71 |
| 10601 T Bury Ln | 0.52mi | 4/2.0 | 1,683 (+1%) | 7mo | $295,000 | $175 | 68 |
| 10212 Neptune Ct | 0.04mi | 3/2.0 (-1) | 1,415 (-15%) | 1mo | $254,180 | $180 | 67 |
| 5813 Foggy Lagoon Dr | 0.40mi | 4/2.0 | 1,568 (-6%) | 6mo | $301,065 | $192 | 67 |
| 10616 Whitney Trce | 0.40mi | 4/3.0 | 1,795 (+8%) | 4mo | $329,999 | $184 | 61 |
| 5807 Foggy Lagoon Dr | 0.40mi | 3/2.0 (-1) | 1,783 (+7%) | 6mo | $322,090 | $181 | 60 |
| 10517 Rayburn Way | 0.32mi | 3/2.0 (-1) | 1,851 (+11%) | 5mo | $349,900 | $189 | 57 |
| 5501 Stillhouse Holw | 0.47mi | 3/2.0 (-1) | 1,765 (+6%) | 8mo | $325,000 | $184 | 56 |
| 5613 Foggy Lagoon Dr | 0.41mi | 3/2.0 (-1) | 1,508 (-9%) | 5mo | $300,735 | $199 | 56 |
| 9428 Centennial Dr | 0.60mi | 3/2.0 (-1) | 1,610 (-3%) | 10mo | $275,000 | $171 | 53 |
| 10421 T Bury Ln | 0.49mi | 3/2.5 (-1) | 1,779 (+7%) | 10mo | $365,000 | $205 | 51 |
| 10309 T Bury Ln | 0.46mi | 3/2.0 (-1) | 1,902 (+14%) | 10mo | $390,000 | $205 | 42 |
Match score weights: distance 35% · size 25% · config 20% · recency 20%. Top-matched comps best support the ARV.
Projected returns pro-forma
-3.0% appreciation · 0.0% rent growth · sell at horizon
- IRR
- -22.4%
- Equity multiple
- 0.25×
- Total profit
- $-61,097
- Equity at exit
- $43,319
- IRR
- -26.6%
- Equity multiple
- -0.10×
- Total profit
- $-89,293
- Equity at exit
- $25,120
Cash invested: $81,348 (down + closing). Projections, not guarantees.
Landlord ↔ Tenant lean methodology
- Overall (STATE)
- 87 Strongly Landlord-Friendly
- State Texas
- 87 Strongly Landlord-Friendly · R+5
- County
- — inherits STATE
- City
- — inherits STATE
ZIP-level market 76708
- Home prices YoY
- -26.5%
- Rents YoY
- -0.8%
- Active inventory
- 376
- Price-to-rent
- 10.1×
Monthly cashflow live
- Estimated rent
- $2,402 medium interval (Pro) →
- Mortgage (P&I)
- −$1,524
- Tax est. 1.5%
- −$363 /mo · $4,358/yr
- Insurance
- −$121
- HOA
- −$0
- Vacancy / Maint / Mgmt
- −$504
- Net cashflow
- $-110
Break-even live
UW: 25.0% down · 7.5% · 30yr · 1.5% tax · 5.0% vac · 8.0% maint · 8.0% mgmt
Financing live
Cash to close
- Down payment
- $72,632
- Closing costs
- $8,716
- Reserves months
- —
- Total cash needed
- —
Loan-product check · same deal, 3 products live
Conventional
25% down · 7.5% · 30yr
- Down + closing
- —
- Monthly P&I
- —
- Monthly cashflow
- —
- DSCR
- —
- Eligible?
- —
Personal DTI + credit; lowest rate.
DSCR
20% down · 8.5% · 30yr
- Down + closing
- —
- Monthly P&I
- —
- Monthly cashflow
- —
- DSCR
- —
- Eligible?
- —
No personal income docs; deal must DSCR.
Hard money
10% down · 12.0% · 12mo
- Down + closing
- —
- Monthly P&I
- —
- Monthly cashflow
- —
- DSCR
- —
- Eligible?
- —
Short-term bridge; refi at stabilization.
Rent comps 4 comps
| Address | Beds | Baths | Sqft | Rent | $/sqft | DOM | Units | Dist |
|---|---|---|---|---|---|---|---|---|
| 10201 Altair Dr Waco, TX | 4.0 | 2.0 | 2032 | $2,600 | $1.28 | 21d | 1 | 0.06mi |
| 5516 Pinery Dr Waco, TX | 3.0 | 2.5 | 2124 | $2,600 | $1.22 | 13d | 1 | 0.53mi |
| 10220 Lilac Waco, TX | 3.0 | 2.0 | 1500 | $1,695 | $1.13 | 43d | 1 | 0.87mi |
| 9836 Salem Way Waco, TX | 3.0 | 2.0 | 1600 | $1,795 | $1.12 | 13d | 1 | 1.47mi |
Listing history 12 events
-
2026-06-16days on market $290,530 Active 27 DOM
-
2026-06-15days on market $290,530 Active 26 DOM
-
2026-06-14days on market $290,530 Active 24 DOM
-
2026-06-13days on market $290,530 Active 23 DOM
-
2026-06-10days on market $290,530 Active 21 DOM
-
2026-06-09days on market $290,530 Active 20 DOM
-
2026-06-08days on market $290,530 Active 19 DOM
-
2026-06-07days on market $290,530 Active 18 DOM
-
2026-06-02days on market $290,530 Active 13 DOM
-
2026-06-01days on market $290,530 Active 12 DOM
-
2026-05-31days on market $290,530 Active 11 DOM
-
2026-05-30days on market $290,530 Active 10 DOM
ⓘ Source: listings_history table (triggers on properties + properties_extension) + one-shot
backfill from property_details.listing_events for pre-trigger history.
Climate risk First Street
- Flood 1/10 Low FEMA zone X (unshaded) · 0% chance over 30 yrs
- Wildfire 6/10 Major
- Heat 7/10 Severe 7 d/yr ≥109°F today · 23 d/yr by 30 yrs out
- Wind 6/10 Major 61% chance of damaging wind over 30 yrs
- Air quality 2/10 Low 0 unhealthy d/yr today · 1 by 30 yrs out
Nearby sold comps map
Loading sold comps map…
Walkable amenities ~0.75 mi
Loading nearby amenities…
Taxation est. · year 1
- Rental income
- $28,825
- − Mortgage interest
- −$16,274
- − Property taxes
- −$4,358
- − Insurance
- −$1,453
- − Repairs & maintenance
- −$2,306
- − Management
- −$2,306
- − Depreciation
- −$8,452
- Taxable loss
- −$6,324
- Est. tax savings @ 24.0%
- +$1,518
- After-tax cash flow
- $196/yr
For passive investors: Depreciation is non-cash, so a rental often shows a tax loss while cash-flowing — sheltering income. Rental losses are passive: they offset passive income freely, and up to $25,000/yr can offset ordinary (W-2) income if you actively participate and your MAGI is under $100k (phasing out to $0 by $150k); unused losses carry forward. On sale, claimed depreciation is recaptured at up to 25%, and gains may owe capital-gains tax (a 1031 exchange can defer both). Figures are a year-1 estimate at your 24.0% rate — not tax advice; consult a CPA.
Condition & rehab AI · 12 photos
This single-story home with 4 bedrooms and 2 bathrooms is in excellent condition, featuring a spacious open concept floor plan, granite countertops, hardwood floors, and a well-maintained exterior. Smart home integration and energy-efficient updates would further enhance its value.
Value-add opportunities
- Both Smart home integration — Enhances convenience and security
- Both Smart thermostat — Improves energy efficiency and comfort
- Both Smart lighting — Enhances ambiance and energy savings
Renovation cost estimate screening
Value-add ROI direction
- Both Smart home integration — Enhances convenience and security ↑
- Both Smart thermostat — Improves energy efficiency and comfort ↑
- Both Smart lighting — Enhances ambiance and energy savings ↑
ⓘ Cost ranges are severity-bucket heuristics (US national rule-of-thumb). Get contractor quotes + a written scope before underwriting a rehab budget.
Schools (NCES district)
- District
- China Spring ISD
- NCES district ID
- 4813960
- Math proficiency
- 58% ▼ -2.00%
- Reading proficiency
- 56% ▼ -1.00%
- Median HH income
- $71,314
- Composite
- 50.64/100
- National rank
- #1837
- State rank
- #70 of 826 in TX
Livability — Waco
- Score
- 74/100
- State rank
- #166
- US rank
- #4378
Category grades
Schools grade is shown separately in the Schools card above.
Census & demographics
- Census place
- Waco, TX
- County
- McLennan County · 213,088 people
- City population
- 125,319
- Metro
- Waco, TX
- Population (ZIP)
- 27,790
- Household income
- $68,856
- Rent vs Own
- Severe rent burden
- 583.0
Population outlook (McLennan County) Hauer SSP2
- Today (2025)
- 264,191 people
- By 2030
- 273,578 · +3.6%
- By 2040
- 291,506 · +10.3%
- By 2050
- 308,044 · +16.6%
- By 2075
- 349,648 · +32.3%
- By 2100
- 364,779 · +38.1%
Race, ethnicity, and origin ACS 2023
- Neighborhood character
- Diverse neighborhood (Simpson 0.63)
- Race & ethnicity
- White 50% Hispanic / Latino 31% Two or more races 20% Black 13% Asian 2%
- Hispanic origin (detail)
- Mexican 28%
- Common ancestry
- Slovak 2% Lithuanian 1% Italian 1%
- Foreign-born
- 11% · Canada, Vietnam
- Languages at home
- 76% English-only · Spanish 21% Other Asian/Pacific 1%
Political lean MEDSL · McLennan
- 2024 margin
- Solid R (+30.9) · D 34.0% · R 64.9% · Other 1.0%
- 2008→2024 swing
- -7.0pp toward R · 2008: -23.9pp · 2024: -30.9pp
- All cycles
- 2024: R+30.9 2020: R+23.4 2016: R+27.1 2012: R+29.8 2008: R+23.9
Not yet ingested
- Civics
- —
Market trends
- HPI YoY
- ▼ -78.80%
- Current HPI
- 218.9643
- Rent YoY
- ▼ -0.80%
- Metro
- Waco, TX
- State GDP YoY
- ▲ 3.95%
- F500 in state
- 110
Industry mix (Fortune 500 HQ in TX)
| Industry | F500 HQs | Revenue |
|---|---|---|
| Energy | 16 | $1,198B |
|
||
| Technology | 5 | $198B |
|
||
| Engineering / Construction | 4 | $72B |
|
||
| Energy Services | 3 | $60B |
|
||
| Utilities | 3 | $41B |
|
||
| Healthcare | 2 | $330B |
|
||
Cash-flow waterfall
monthlySold comps — $/sqft
last 12 mo · ≤1 miLoading sold comps…