425 S Villa San Marco Dr #307 · St. Augustine South, FL
Flood risk 1/10 · Minimal
- FEMA flood zone
- X (unshaded)
- Chance of flooding over 30 yrs
- 0.0%
- Est. flood insurance / yr
- $507 – $1,088
Fire risk 4/10 · Minor
- Est. fire insurance / yr
- $947 – $1,759
Heat risk 10/10 · Severe
- Hot days now (above 106°F)
- 7 days/yr
- Hot days in 30 yrs
- 21 days/yr
Wind risk 9/10 · Severe
- Chance of severe wind over 30 yrs
- 99.0%
Air-quality risk 3/10 · Minor
- Unhealthy air days now
- 3 days/yr
- Unhealthy air days in 30 yrs
- 3 days/yr
Risk factors via First Street. Map © Google.
Why this score? — see what drove the C grade
The composite is a weighted blend of 9 inputs, each scored 0–100. Each bar is that input's sub-score; the figure is the points it added to the 100-point composite (weight × sub-score).
- Cash flow +20.1/30.0
- ARV discount +7.5/15.0
- 1% rule +7.4/10.0
- DSCR +6.4/10.0
- Schools +6.4/10.0
- Rent growth +2.7/5.0
- Livability +2.5/5.0
- Condition / age +2.5/5.0
- Appreciation +0.0/10.0
$170,000
🖨 Deal sheet 📄 Offer letter ✓ Due diligence
Listing remarks
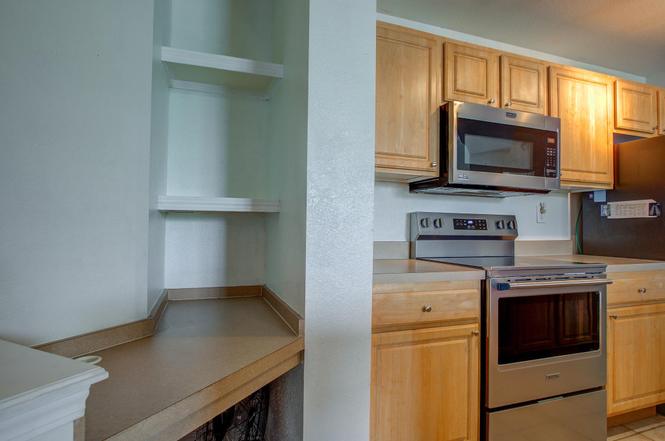
Don't miss this opportunity to own a well-maintained 2 bedroom, 2 bath condo located on the third floor in a highly desirable location. Freshly painted throughout, this inviting home features attractive vinyl plank flooring, creating a modern look that's both stylish and easy to maintain. Enjoy your morning coffee or unwind after a long day on the private screened lanai, offering a comfortable outdoor living space with added privacy and protection from the elements. Conveniently situated near shopping, dining, entertainment, major roadways, and everyday conveniences, this condo combines comfort, value, and location. Whether you're a first-time buyer, downsizing, or looking for an investment
Key facts
- Fitness center
- Car wash area
- Pool
Tags
Property features AI
Finance
- Other: Directions: US 1 to west on SR 312, left on Old Moultrie Rd, right into Villa San Marco, left at Clubhouse to building 425.
- HOA & community: Monthly HOA fee of $293
Exterior
- Home design: Unit entry on the 3rd story
- Exterior features: Screened porch
Interior
- Bedrooms: Primary bedroom located on the 1st floor
- Bathrooms: 2 bathrooms
- Interior features: Dining area in a combo layout
Neighborhood map
What this means for you Summary
Snapshot
- This is a 2-bed/2.0-bath condo listed at $170k.
Deal economics
- At list price, monthly cash flow is $212 ($3k/yr) — positive.
- The deal already cash-flows at list — no discount required.
- Meets the 1% rule at list price ($2k rent vs $170k).
- Cap rate 7.8% vs local median 4.1% in St. Augustine South — top-decile yield for the area; either an underpriced asset or a hidden risk that comps aren't pricing in. Stress-test before assuming the spread holds.
Location & tenants
- Location reads: area grade C — affects rentability + tenant quality, not the cash-flow math above.
- St. Johns (rural): math 75% / reading 73% proficiency, ranked #2 of 73 in FL (top 3%) — strong family-tenant draw, lease renewals of 3-5y typical; only 20% free/reduced lunch — higher-income household profile.
- Market conditions: Rents flat; 400 active listings in the ZIP; 16 comparable units currently listed for rent nearby; rentals at typical pace (median 24d on market — plan ~3-4 weeks tenant-placement turnaround); solid renter incomes; 5,575 units permitted in St. Johns County in 2024 (584 in 5+ unit buildings).
- This rent runs 33% of the median local income ($77k/yr) — at the standard rent-burdened threshold; future hikes will face affordability resistance.
Forward outlook
- Local home prices are declining (-3.0%/yr); year-one equity from $1k of loan paydown is wiped out by about $5k of value loss. Plan a longer hold.
- St. Johns County population projected at +60% by 2050 — long-run rental-demand tailwind backs the buy-and-hold thesis.
Negotiation context
- Only 7 days on market — expect competitive offers; lowballing is unlikely to land.
- 2 sale attempts since 19y ago with the ask held roughly flat each time — persistent listings suggest the price (not the market) is what's stuck; bring a comps-based counter.
- Current owner paid $136k; 25% above their basis — modest negotiation headroom, anchor on the comps not their cost.
Risks & watch-outs
- Climate carrying-cost: severe wind risk, 99% chance of damaging wind over 30y; extreme-heat days projected 7→21/yr by 2055 (HVAC capex compounding) — expect insurance premiums to compound above CPI over the hold.
Questions for the listing agent
- What does the HOA fee cover, when was the last increase, and are there any pending special assessments or reserve-fund shortfalls?
- Any open or pending special assessments — roof, HVAC, plumbing, elevator, façade? What's the per-unit balance and payoff schedule, and is the seller paying it off at close or rolling it to the buyer?
- Is there a deadline driving the sale (1031 exchange, divorce, estate, relocation)? That informs how much negotiation room exists.
- What's the average days-on-market for RENTAL listings here right now (not sales)? A rising rental-DOM trend means longer vacancies and softer asking-rent achievability than the comps imply.
- What's the recent tenant-quality profile in this submarket — average credit score on applications, eviction rate, late-payment / NSF rate, and stable-employment percentage? A property-management company in the area should have these aggregated.
- How much new apartment / multifamily construction is in the pipeline within 1–3 miles? Heavy new supply (>2% of stock underway) typically softens rents 12–24 months out; light construction supports rent growth.
Investment metrics
- 1% rule
- 1.24% ✓
- Cap rate
- 7.79%
- Cash-on-cash
- 5.36%
- DSCR
- 1.24
- GRM
- 6.7
CMA / ARV
No comps found within radius.
Projected returns pro-forma
-3.0% appreciation · 0.85% rent growth · sell at horizon
- IRR
- -10.8%
- Equity multiple
- 0.62×
- Total profit
- $-18,279
- Equity at exit
- $25,348
- IRR
- -5.6%
- Equity multiple
- 0.68×
- Total profit
- $-15,222
- Equity at exit
- $14,698
Cash invested: $47,600 (down + closing). Projections, not guarantees.
Landlord ↔ Tenant lean methodology
- Overall (STATE)
- 87 Strongly Landlord-Friendly
- State Florida
- 87 Strongly Landlord-Friendly · R+3
- County
- — inherits STATE
- City
- — inherits STATE
ZIP-level market 32086
- Rents YoY
- 0.8%
- Active inventory
- 400
- Price-to-rent
- 6.7×
Monthly cashflow live
- Estimated rent
- $2,109 high interval (Pro) →
- Mortgage (P&I)
- −$891
- Tax from tax record
- −$198 /mo · $2,380/yr
- Insurance
- −$71
- HOA
- −$293
- Vacancy / Maint / Mgmt
- −$443
- Net cashflow
- $212
Break-even live
UW: 25.0% down · 7.5% · 30yr · 1.5% tax · 5.0% vac · 8.0% maint · 8.0% mgmt
Financing live
Cash to close
- Down payment
- $42,500
- Closing costs
- $5,100
- Reserves months
- —
- Total cash needed
- —
Loan-product check · same deal, 3 products live
Conventional
25% down · 7.5% · 30yr
- Down + closing
- —
- Monthly P&I
- —
- Monthly cashflow
- —
- DSCR
- —
- Eligible?
- —
Personal DTI + credit; lowest rate.
DSCR
20% down · 8.5% · 30yr
- Down + closing
- —
- Monthly P&I
- —
- Monthly cashflow
- —
- DSCR
- —
- Eligible?
- —
No personal income docs; deal must DSCR.
Hard money
10% down · 12.0% · 12mo
- Down + closing
- —
- Monthly P&I
- —
- Monthly cashflow
- —
- DSCR
- —
- Eligible?
- —
Short-term bridge; refi at stabilization.
Rent comps 16 comps
| Address | Beds | Baths | Sqft | Rent | $/sqft | DOM | Units | Dist |
|---|---|---|---|---|---|---|---|---|
| 117 Ridge Lake Rd Saint Augustine, FL | 3.0 | 2.5 | 1471 | $2,200 | $1.50 | 7d | 1 | 0.30mi |
| 70 Ridge Lake Rd Saint Augustine, FL | 3.0 | 2.5 | 1470 | $2,025 | $1.38 | 23d | 1 | 0.35mi |
| 421 S Hidden Tree Dr Saint Augustine, FL | 3.0 | 2.0 | 1344 | $2,100 | $1.56 | 23d | 1 | 0.51mi |
| 29 Buckley Ct Saint Augustine, FL | 2.0 | 2.5 | 1211 | $2,300 | $1.90 | 23d | 1 | 0.54mi |
| 129 Moultrie Village Ln Saint Augustine, FL | 2.0 | 2.5 | 1384 | $1,750 | $1.26 | 19d | 1 | 0.55mi |
| 105 Whitland Way Unit 1 St. Augustine, FL | 3.0 | 2.5 | 1499 | $2,300 | $1.53 | 3d | 1 | 0.61mi |
| 1845 Old Moultrie Rd #32 Saint Augustine, FL | 2.0 | 1.0 | 870 | $1,650 | $1.90 | 23d | 1 | 0.66mi |
| 253 Cowry Rd Saint Augustine, FL | 3.0 | 2.5 | 1375 | $1,995 | $1.45 | 23d | 1 | 0.90mi |
| 100 Inspire Way St. Augustine, FL | 2.0–3.0 | 2.0 | 1393 | $2,355 | $1.69 | 23d | 120 | 0.92mi |
| 1419 San Juline Cir Saint Augustine, FL | 2.0 | 1.5 | 804 | $1,649 | $2.05 | 13d | 1 | 1.15mi |
| 93 Palma Dr Saint Augustine, FL | 2.0–4.0 | 2.5 | 1506 | $1,995 | $1.32 | 2d | 18 | 1.26mi |
| 130 Shipyard Way St. Augustine, FL | 1.0–3.0 | 1.0–2.0 | 1137 | $2,612 | $2.30 | 1d | 68 | 1.38mi |
| 113 Pamplona Dr Saint Augustine, FL | 2.0 | 2.5 | 1273 | $2,095 | $1.65 | 23d | 1 | 1.38mi |
| 890 Poinsettia Rd Unit B St. Augustine, FL | 2.0 | 2.0 | 1032 | $1,590 | $1.54 | 23d | 1 | 1.39mi |
| 350 Laurel Dr , FL | 1.0–3.0 | 1.0–2.0 | 1003 | $1,852 | $1.85 | 1d | 13 | 1.41mi |
| 909 S Ponce de Leon Blvd Saint Augustine, FL | 2.0 | 2.0 | 1120 | $3,150 | $2.81 | 3d | 1 | 1.45mi |
HOA detail condo
- Monthly dues
- $293 · $3,516/yr
- Assessments
- None detected in remarks — confirm with the listing agent.
Listing history 7 events
-
2026-06-18days on market $170,000 Active 7 DOM
-
2026-06-17days on market $170,000 Active 6 DOM
-
2026-06-16days on market $170,000 Active 5 DOM
-
2026-06-15days on market $170,000 Active 4 DOM
-
2026-06-13days on market $170,000 Active 2 DOM
-
2026-06-13remarks 699-char remark
-
2026-06-13$170,000 Active 1 DOM
ⓘ Source: listings_history table (triggers on properties + properties_extension) + one-shot
backfill from property_details.listing_events for pre-trigger history.
Tax reassessment forecast FL · Resets to sale price
- Current annual tax
- $2,380 · $198/mo
- Projected year-2 tax
- $2,380 · $198/mo
- Expected delta
- $0/yr ($0/mo · 0.0%)
ⓘ Screening estimate from a state-policy table — verify with the county assessor before closing.
Climate risk First Street
- Flood 1/10 Low FEMA zone X (unshaded) · 0% chance over 30 yrs
- Wildfire 4/10 Moderate
- Heat 10/10 Extreme 7 d/yr ≥106°F today · 21 d/yr by 30 yrs out
- Wind 9/10 Extreme 99% chance of damaging wind over 30 yrs
- Air quality 3/10 Moderate 3 unhealthy d/yr today · 3 by 30 yrs out
Nearby sold comps map
Loading sold comps map…
Walkable amenities ~0.75 mi
Loading nearby amenities…
Taxation est. · year 1
- Rental income
- $25,309
- − Mortgage interest
- −$9,523
- − Property taxes
- −$2,380
- − Insurance
- −$850
- − Repairs & maintenance
- −$2,025
- − Management
- −$2,025
- − HOA
- −$3,516
- − Depreciation
- −$4,945
- Taxable income
- $45
- Est. tax owed @ 24.0%
- −$11
- After-tax cash flow
- $2,539/yr
For passive investors: Depreciation is non-cash, so a rental often shows a tax loss while cash-flowing — sheltering income. Rental losses are passive: they offset passive income freely, and up to $25,000/yr can offset ordinary (W-2) income if you actively participate and your MAGI is under $100k (phasing out to $0 by $150k); unused losses carry forward. On sale, claimed depreciation is recaptured at up to 25%, and gains may owe capital-gains tax (a 1031 exchange can defer both). Figures are a year-1 estimate at your 24.0% rate — not tax advice; consult a CPA.
Schools (NCES district)
- District
- St. Johns
- NCES district ID
- 1201740
- Math proficiency
- 75% ▼ -5.00%
- Reading proficiency
- 73% ▼ -2.00%
- Median HH income
- $66,842
- Composite
- 64.31/100
- National rank
- #556
- State rank
- #2 of 73 in FL
Livability — St. Augustine South
No livability data for this city. (Only ~50 U.S. cities are tracked.)
Census & demographics
- County
- Saint Johns County · 301,599 people
- Metro
- Jacksonville, FL
- Population (ZIP)
- 34,855
- Household income
- $76,512
- Rent vs Own
- Severe rent burden
- 634.0
Population outlook (St. Johns County) Hauer SSP2
- Today (2025)
- 303,941 people
- By 2030
- 342,590 · +12.7%
- By 2040
- 417,328 · +37.3%
- By 2050
- 487,011 · +60.2%
- By 2075
- 635,395 · +109.1%
- By 2100
- 717,469 · +136.1%
Race, ethnicity, and origin ACS 2023
- Neighborhood character
- Predominantly White (84%)
- Race & ethnicity
- White 84% Hispanic / Latino 8% Two or more races 5% Black 3% Asian 1%
- Hispanic origin (detail)
- Puerto Rican 2% Dominican 1%
- Common ancestry
- Romanian 3% Lithuanian 3% Italian 2%
- Foreign-born
- 7% · Canada, Jamaica, Guatemala
- Languages at home
- 91% English-only · Spanish 5% German/W. Germanic 1% Other Indo-European 1%
Political lean MEDSL · St. Johns
- 2024 margin
- Solid R (+31.4) · D 33.9% · R 65.2%
- 2008→2024 swing
- +0.2pp no change · 2008: -31.6pp · 2024: -31.4pp
- All cycles
- 2024: R+31.4 2020: R+26.7 2016: R+33.4 2012: R+37.8 2008: R+31.6
Not yet ingested
- Civics
- —
Market trends
- HPI YoY
- ▼ -278.21%
- Current HPI
- 306.2813
- Rent YoY
- ▲ 0.85%
- Metro
- Jacksonville, FL
- State GDP YoY
- ▲ 3.28%
- F500 in state
- 36
Industry mix (Fortune 500 HQ in FL)
| Industry | F500 HQs | Revenue |
|---|---|---|
| Industrial Technology | 2 | $29B |
|
||
| Insurance | 2 | $17B |
|
||
| Retail | 1 | $60B |
|
||
| Technology Distribution | 1 | $58B |
|
||
| Homebuilding | 1 | $35B |
|
||
| Technology Manufacturing | 1 | $35B |
|
||
Price history
-1.7% since first listed7 events — show timeline
- 2026-06-10 Listed $170,000 St. Augustine and St. Johns County Board of REALTORS®
- 2019-07-31 Sold (Public Records) $136,000 Public Records
- 2007-08-30 Sold (Public Records) $170,000 Public Records
- 2007-08-29 Listing Removed — realMLS
- 2007-08-27 Sold (MLS) $170,000 realMLS
- 2007-07-05 Listed $184,900 realMLS
- 2005-08-12 Sold (Public Records) $172,900 Public Records
Property tax history
+8.6%/yrLatest (2025): $2,380 · +10.7% YoY. Source: county tax records.
Cash-flow waterfall
monthlySold comps — $/sqft
last 12 mo · ≤1 miLoading sold comps…