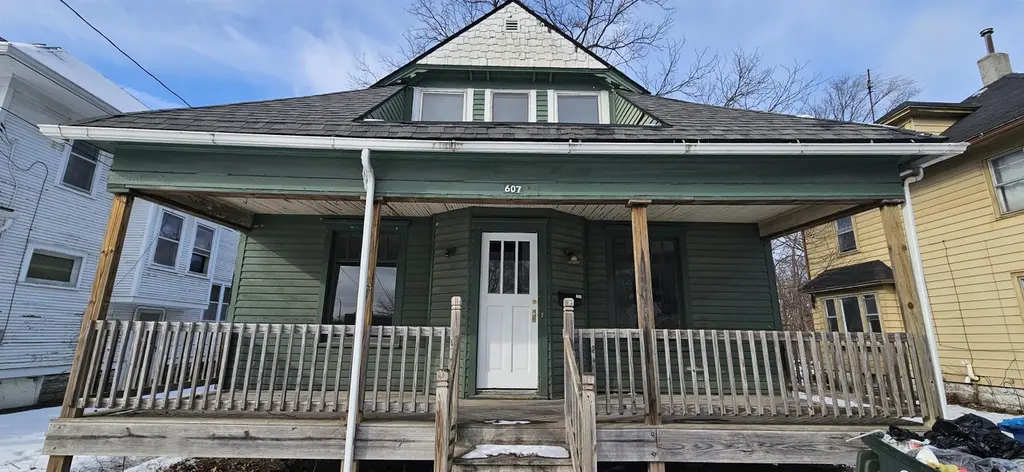
607 Logan Ave · Waterloo, IA
Flood risk 4/10 · Minor
- FEMA flood zone
- AE
- Chance of flooding over 30 yrs
- 0.22%
- Est. flood insurance / yr
- $2,026 – $9,024
Fire risk 1/10 · Minimal
- Est. fire insurance / yr
- $902 – $1,676
Heat risk 3/10 · Minor
- Hot days now (above 101°F)
- 7 days/yr
- Hot days in 30 yrs
- 16 days/yr
Wind risk 2/10 · Minimal
- Chance of severe wind over 30 yrs
- —
Air-quality risk 1/10 · Minimal
- Unhealthy air days now
- 0 days/yr
- Unhealthy air days in 30 yrs
- 0 days/yr
Risk factors via First Street. Map © Google.
Why this score? — see what drove the A- grade
The composite is a weighted blend of 9 inputs, each scored 0–100. Each bar is that input's sub-score; the figure is the points it added to the 100-point composite (weight × sub-score).
- Cash flow +30.0/30.0
- ARV discount +15.0/15.0
- 1% rule +10.0/10.0
- DSCR +10.0/10.0
- Schools +4.4/10.0
- Rent growth +4.2/5.0
- Livability +4.0/5.0
- Condition / age +2.5/5.0
- Appreciation +0.0/10.0
$62,500
🖨 Deal sheet 📄 Offer letter ✓ Due diligence
Listing remarks MLS
Home buyers eager to create their dream home or investors looking for a renovation project four bedrooms 2.5 baths and approximately 2000 sq. feet of living space make this home your today
Key facts
- 4,400 sq ft lot
- Built 1914
- Listed 314 days
Neighborhood map
What this means for you Summary
Snapshot
- This is a 3-bed/2.0-bath single-family listed at $62k.
Deal economics
- At list price, monthly cash flow is $80 ($965/yr) — positive.
- The deal already cash-flows at list — no discount required.
- Meets the 1% rule at list price ($1k rent vs $62k).
- Recommended offer: $55k (12.0% below list) — sets the bar for market timing.
- Cap rate 16.7% vs local median 4.2% in Waterloo — top-decile yield for the area; either an underpriced asset or a hidden risk that comps aren't pricing in. Stress-test before assuming the spread holds.
Location & tenants
- Location reads 81/100 on livability (#74 in IA, #1,589 nationally) — a professional / high-income tenant draw. Strengths: commute A+, cost of living A+, housing A+; Watch: schools C-, crime F, employment D-.
- Waterloo Community School District (urban): math 50% / reading 54% proficiency, ranked #276 of 289 in IA (top 96%) — acceptable for families but not a draw, mixed tenant base, ~2y average lease.
- Market conditions: Rents rising fast (+6.7%/yr); 98 active listings in the ZIP; 7 comparable units currently listed for rent nearby; rentals at typical pace (median 21d on market — plan ~3-4 weeks tenant-placement turnaround); 43% of comp listings sitting > 30 days — soft ceiling on asking rent; 287 units permitted in Black Hawk County in 2024 (67 in 5+ unit buildings).
Forward outlook
- Local home prices are declining (-3.0%/yr); year-one equity from $432 of loan paydown is wiped out by about $2k of value loss. Plan a longer hold.
- Black Hawk County population projected at +10% by 2050 — modest demand growth; plan on rents tracking national, not racing it.
- At projected returns (-3.0% appreciation + 6.7% rent growth), your $18k cash investment doubles in ~8 years — after that, you're playing with house money.
Negotiation context
- It's been on market 315 days — a 12% lower offer ($55k) is reasonable based on typical stale-listing flexibility.
- 2 sale attempts since 10y ago; this cycle's ask has dropped $8k (11%) from the opening price — seller is motivated, your offer sets the floor, not the list.
- Current owner paid $14k; list at $62k implies a 363% gain — meaningful room to come down on a strong offer.
Risks & watch-outs
- Watch-outs: flood insurance adds $460/mo; built in 1914 — expect roof / HVAC / electrical / plumbing capex.
- Climate carrying-cost: in FEMA flood zone AE (mandatory federal flood insurance) — expect insurance premiums to compound above CPI over the hold.
Questions for the listing agent
- It's been on market 315 days. Have you received any prior offers? Is the seller open to a 12% concession, seller financing, or rate buy-down credit?
- Built in 1914 — when were the roof, HVAC, electrical panel, plumbing, and water heater last replaced?
- What's the actual annual flood-insurance premium (NFIP or private), and is the property in a SFHA with mandatory coverage?
- Why hasn't it sold? Are there any deal-killer items the seller is aware of (foundation, flood, title, zoning, code violations)?
- Is there a deadline driving the sale (1031 exchange, divorce, estate, relocation)? That informs how much negotiation room exists.
- Crime grade is F in this area — have there been break-ins, vandalism, or insurance claims at this property in the last 3 years? What carrier currently insures it and at what premium?
- What's the average days-on-market for RENTAL listings here right now (not sales)? A rising rental-DOM trend means longer vacancies and softer asking-rent achievability than the comps imply.
- What's the recent tenant-quality profile in this submarket — average credit score on applications, eviction rate, late-payment / NSF rate, and stable-employment percentage? A property-management company in the area should have these aggregated.
- How much new for-sale + rental construction is in the pipeline within 1–3 miles? Heavy new supply typically softens prices + rents 12–24 months out; constrained supply supports both.
Investment metrics
- 1% rule
- 1.94% ✓
- Cap rate
- 16.68%
- Cash-on-cash
- 37.09%
- DSCR
- 2.65
- GRM
- 4.3
CMA / ARV
- ARV (median comp)
- $92,989
- List price
- $62,500
- Delta
- -32.79%
- Verdict
- UNDERPRICED
- Comps
- 20 within 1.0 mi
Show comp detail 6 sales within ~0.75 mi
| Address | Dist | Beds/Ba | Sqft | Sold | Price | $/sf | Match |
|---|---|---|---|---|---|---|---|
| 431 Wendell Ct | 0.30mi | 3/1.5 | 2,060 (+4%) | 6mo | $135,500 | $66 | 73 |
| 119 Reed St | 0.35mi | 4/1.5 (+1) | 1,794 (-10%) | 0mo | $120,000 | $67 | 60 |
| 326 Conger St | 0.32mi | 4/2.0 (+1) | 2,162 (+9%) | 22mo | $133,900 | $62 | 47 |
| 217 E 1st St | 0.51mi | 3/2.0 | 1,698 (-15%) | 9mo | $65,000 | $38 | 44 |
| 412 Reed St | 0.57mi | 4/1.5 (+1) | 2,136 (+7%) | 17mo | $69,900 | $33 | 40 |
| 401 Oliver St | 0.67mi | 2/1.0 (-1) | 1,888 (-5%) | 24mo | $61,000 | $32 | 32 |
Match score weights: distance 35% · size 25% · config 20% · recency 20%. Top-matched comps best support the ARV.
Projected returns pro-forma
-3.0% appreciation · 6.67% rent growth · sell at horizon
- IRR
- -0.1%
- Equity multiple
- 1.00×
- Total profit
- $-67
- Equity at exit
- $9,319
- IRR
- 15.3%
- Equity multiple
- 2.62×
- Total profit
- $28,288
- Equity at exit
- $5,404
Cash invested: $17,500 (down + closing). Projections, not guarantees.
Landlord ↔ Tenant lean methodology
- Overall (STATE)
- 83 Strongly Landlord-Friendly
- State Iowa
- 83 Strongly Landlord-Friendly · R+6
- County
- — inherits STATE
- City
- — inherits STATE
ZIP-level market 50703
- Rents YoY
- 6.7%
- Active inventory
- 98
- Price-to-rent
- 4.3×
Monthly cashflow live
- Estimated rent
- $1,213 high interval (Pro) →
- Mortgage (P&I)
- −$328
- Tax from tax record
- −$64 /mo · $768/yr
- Insurance
- −$26
- Flood insurance flood zone
- −$460 /mo · $5,525/yr
- HOA
- −$0
- Vacancy / Maint / Mgmt
- −$255
- Net cashflow
- $80
Break-even live
UW: 25.0% down · 7.5% · 30yr · 1.5% tax · 5.0% vac · 8.0% maint · 8.0% mgmt
Financing live
Cash to close
- Down payment
- $15,625
- Closing costs
- $1,875
- Reserves months
- —
- Total cash needed
- —
Loan-product check · same deal, 3 products live
Conventional
25% down · 7.5% · 30yr
- Down + closing
- —
- Monthly P&I
- —
- Monthly cashflow
- —
- DSCR
- —
- Eligible?
- —
Personal DTI + credit; lowest rate.
DSCR
20% down · 8.5% · 30yr
- Down + closing
- —
- Monthly P&I
- —
- Monthly cashflow
- —
- DSCR
- —
- Eligible?
- —
No personal income docs; deal must DSCR.
Hard money
10% down · 12.0% · 12mo
- Down + closing
- —
- Monthly P&I
- —
- Monthly cashflow
- —
- DSCR
- —
- Eligible?
- —
Short-term bridge; refi at stabilization.
Rent comps 7 comps
| Address | Beds | Baths | Sqft | Rent | $/sqft | DOM | Units | Dist |
|---|---|---|---|---|---|---|---|---|
| 824 Logan Ave Waterloo, IA | 4.0 | 2.0 | 1572 | $1,425 | $0.91 | 20d | 1 | 0.21mi |
| 203 Reed St Waterloo, IA | 3.0 | 1.5 | 1492 | $1,200 | $0.80 | 20d | 1 | 0.38mi |
| 440 Cutler St Waterloo, IA | 3.0 | 1.5 | 1566 | $1,200 | $0.77 | 20d | 1 | 0.62mi |
| 401 Charles St Waterloo, IA | 3.0 | 1.0 | 1276 | $995 | $0.78 | 43d | 1 | 0.73mi |
| 1107 Mulberry St Waterloo, IA | 3.0 | 1.0 | 1248 | $950 | $0.76 | 20d | 1 | 1.01mi |
| 223 W 4th St Ste 203 Waterloo, IA | 2.0 | 1.5 | 1466 | $1,250 | $0.85 | 43d | 1 | 1.01mi |
| 1720 Franklin St Waterloo, IA | 4.0 | 1.5 | 1392 | $1,000 | $0.72 | 43d | 1 | 1.33mi |
Listing history 22 events
-
2026-06-19days on market $62,500 Active 315 DOM
-
2026-06-18days on market $62,500 Active 314 DOM
-
2026-06-17days on market $62,500 Active 313 DOM
-
2026-06-16days on market $62,500 Active 312 DOM
-
2026-06-15days on market $62,500 Active 311 DOM
-
2026-06-14days on market $62,500 Active 309 DOM
-
2026-06-13days on market $62,500 Active 308 DOM
-
2026-06-10days on market $62,500 Active 306 DOM
-
2026-06-09days on market $62,500 Active 305 DOM
-
2026-06-08days on market $62,500 Active 304 DOM
-
2026-06-07days on market $62,500 Active 303 DOM
-
2026-06-05days on market $62,500 Active 300 DOM
-
2026-06-03days on market $62,500 Active 299 DOM
-
2026-06-02days on market $62,500 Active 298 DOM
-
2026-06-01days on market $62,500 Active 297 DOM
-
2026-05-31days on market $62,500 Active 296 DOM
-
2026-05-30days on market $62,500 Active 295 DOM
-
2026-02-05price $62,500 189-char remark
Show marketing remark (189 chars)
Home buyers eager to create their dream home or investors looking for a renovation project four bedrooms 2.5 baths and approximately 2000 sq. feet of living space make this home your today
-
2025-09-08price $65,000 189-char remark
Show marketing remark (189 chars)
Home buyers eager to create their dream home or investors looking for a renovation project four bedrooms 2.5 baths and approximately 2000 sq. feet of living space make this home your today
-
2025-08-07$70,000 Active 189-char remark
Show marketing remark (189 chars)
Home buyers eager to create their dream home or investors looking for a renovation project four bedrooms 2.5 baths and approximately 2000 sq. feet of living space make this home your today
-
2017-04-18soldstatus $13,500 532-char remark
Show marketing remark (532 chars)
4 bedroom home with bath on each on 1 1/2 levels. Offers formal dining room, front porch, and single stall garage See attachment for PAS requirements and WFHM offer submittal information in MLS document section. Please submit all offers to the listing broker/agent. To report any concerns with a listing broker/agent, or to report any property condition or other concern needing escalation (including concerns related to a previously submitted offer), please call: 1-877-617-5274 Al information deemed reliable but not guaranteed
-
2016-11-28$14,000 532-char remark
Show marketing remark (532 chars)
4 bedroom home with bath on each on 1 1/2 levels. Offers formal dining room, front porch, and single stall garage See attachment for PAS requirements and WFHM offer submittal information in MLS document section. Please submit all offers to the listing broker/agent. To report any concerns with a listing broker/agent, or to report any property condition or other concern needing escalation (including concerns related to a previously submitted offer), please call: 1-877-617-5274 Al information deemed reliable but not guaranteed
ⓘ Source: listings_history table (triggers on properties + properties_extension) + one-shot
backfill from property_details.listing_events for pre-trigger history.
Tax reassessment forecast IA · Partial reset (capped growth)
- Current annual tax
- $768 · $64/mo
- Projected year-2 tax
- $875 · $73/mo
- Expected delta
- +$107/yr (+$9/mo · 13.9%)
ⓘ Screening estimate from a state-policy table — verify with the county assessor before closing.
Climate risk First Street
- Flood 4/10 Moderate FEMA zone AE · 22% chance over 30 yrs
- Wildfire 1/10 Low
- Heat 3/10 Moderate 7 d/yr ≥101°F today · 16 d/yr by 30 yrs out
- Wind 2/10 Low
- Air quality 1/10 Low 0 unhealthy d/yr today · 0 by 30 yrs out
Nearby sold comps map
Loading sold comps map…
Walkable amenities ~0.75 mi
Loading nearby amenities…
Taxation est. · year 1
- Rental income
- $14,562
- − Mortgage interest
- −$3,501
- − Property taxes
- −$768
- − Insurance
- −$5,838
- − Repairs & maintenance
- −$1,165
- − Management
- −$1,165
- − Depreciation
- −$1,818
- Taxable income
- $307
- Est. tax owed @ 24.0%
- −$74
- After-tax cash flow
- $891/yr
For passive investors: Depreciation is non-cash, so a rental often shows a tax loss while cash-flowing — sheltering income. Rental losses are passive: they offset passive income freely, and up to $25,000/yr can offset ordinary (W-2) income if you actively participate and your MAGI is under $100k (phasing out to $0 by $150k); unused losses carry forward. On sale, claimed depreciation is recaptured at up to 25%, and gains may owe capital-gains tax (a 1031 exchange can defer both). Figures are a year-1 estimate at your 24.0% rate — not tax advice; consult a CPA.
Schools (NCES district)
- District
- Waterloo Community School District
- NCES district ID
- 1930480
- Math proficiency
- 50% ▼ -4.00%
- Reading proficiency
- 54% ▲ 1.00%
- Median HH income
- $42,545
- Composite
- 43.72/100
- National rank
- #2950
- State rank
- #276 of 289 in IA
Livability — Waterloo
- Score
- 81/100
- State rank
- #74
- US rank
- #1589
Category grades
Schools grade is shown separately in the Schools card above.
Census & demographics
- Census place
- Waterloo, IA
- County
- Black Hawk County · 112,933 people
- City population
- 69,066
- Metro
- Waterloo-Cedar Falls, IA
- Population (ZIP)
- 17,952
- Household income
- $50,060
- Rent vs Own
- Severe rent burden
- 871.0
Population outlook (Black Hawk County) Hauer SSP2
- Today (2025)
- 139,716 people
- By 2030
- 142,853 · +2.2%
- By 2040
- 147,843 · +5.8%
- By 2050
- 153,247 · +9.7%
- By 2075
- 167,977 · +20.2%
- By 2100
- 177,320 · +26.9%
Race, ethnicity, and origin ACS 2023
- Neighborhood character
- Diverse neighborhood (Simpson 0.62)
- Race & ethnicity
- White 55% Black 26% Hispanic / Latino 10% Two or more races 7% Asian 2%
- Hispanic origin (detail)
- Mexican 6%
- Common ancestry
- Iranian 1% Portuguese 1% Lithuanian 1%
- Foreign-born
- 7% · Canada, Philippines, China
- Languages at home
- 89% English-only · Spanish 7% Other Asian/Pacific 2% Russian/Polish/Slavic 1%
Political lean MEDSL · Black Hawk
- 2024 margin
- Toss-up / Even · D 50.0% · R 48.8% · Other 1.2%
- 2008→2024 swing
- -21.3pp toward R · 2008: 22.4pp · 2024: 1.2pp
- All cycles
- 2024: D+1.2 2020: D+9.0 2016: D+7.3 2012: D+20.0 2008: D+22.4
Not yet ingested
- Civics
- —
Market trends
- HPI YoY
- ▼ -117.18%
- Current HPI
- 132.9478
- Rent YoY
- ▲ 6.67%
- Metro
- Waterloo-Cedar Falls, IA
- State GDP YoY
- ▲ 2.48%
- F500 in state
- 4
Industry mix (Fortune 500 HQ in IA)
| Industry | F500 HQs | Revenue |
|---|---|---|
| Financial Services | 1 | $16B |
|
||
| Retail / Convenience | 1 | $15B |
|
||
Price history
+346.4% since first listed5 events — show timeline
- 2026-02-05 Price Changed $62,500 NEIRBR as distributed by MLS GRID
- 2025-09-08 Price Changed $65,000 NEIRBR as distributed by MLS GRID
- 2025-08-07 Listed $70,000 NEIRBR as distributed by MLS GRID
- 2017-04-18 Sold (MLS) $13,500 NEIRBR as distributed by MLS GRID
- 2016-11-28 Listed $14,000 NEIRBR as distributed by MLS GRID
Property tax history
+0.2%/yrLatest (2025): $768 · +8.8% YoY. Source: county tax records.
Cash-flow waterfall
monthlySold comps — $/sqft
last 12 mo · ≤1 miLoading sold comps…