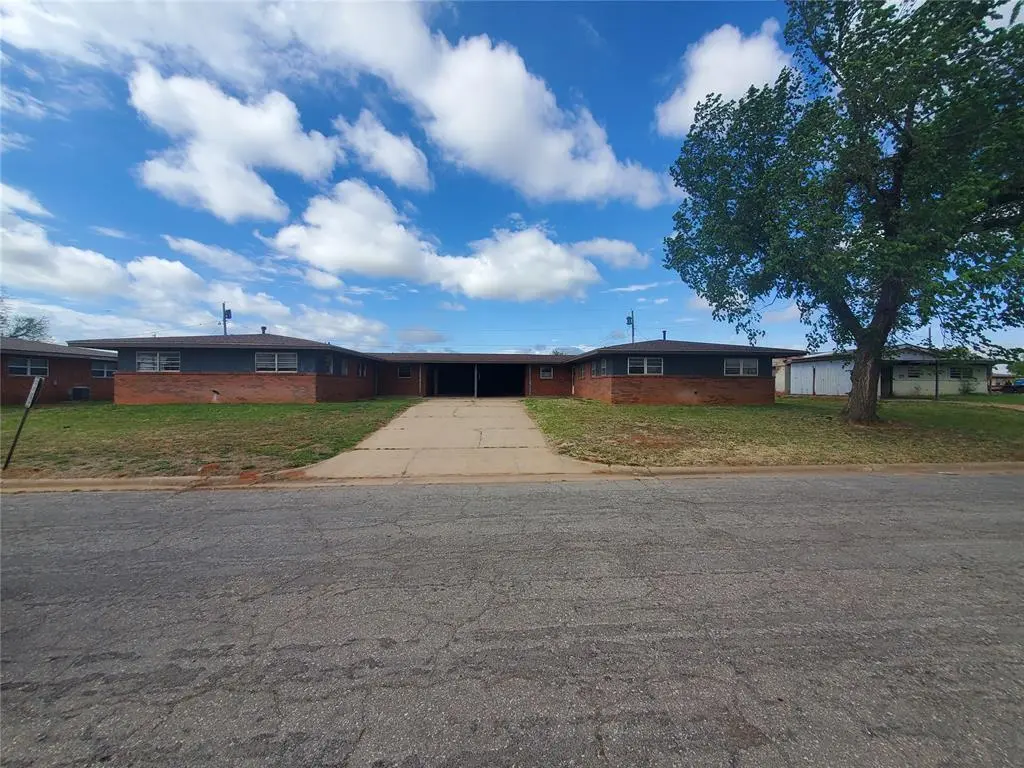
 Duplex
407 Iroquois Trl · Burns Flat, OK
Flood risk 1/10 · Minimal
- FEMA flood zone
- X (unshaded)
- Chance of flooding over 30 yrs
- 0.0%
- Est. flood insurance / yr
- $507 – $1,088
Fire risk 3/10 · Minor
- Est. fire insurance / yr
- $2,463 – $4,575
Heat risk 6/10 · Moderate
- Hot days now (above 105°F)
- 7 days/yr
- Hot days in 30 yrs
- 19 days/yr
Wind risk 2/10 · Minimal
- Chance of severe wind over 30 yrs
- 3.0%
Air-quality risk 1/10 · Minimal
- Unhealthy air days now
- 0 days/yr
- Unhealthy air days in 30 yrs
- 0 days/yr
Risk factors via First Street. Map © Google.
Why this score? — see what drove the B grade
The composite is a weighted blend of 9 inputs, each scored 0–100. Each bar is that input's sub-score; the figure is the points it added to the 100-point composite (weight × sub-score).
- Cash flow +30.0/30.0
- 1% rule +10.0/10.0
- DSCR +10.0/10.0
- ARV discount +7.5/15.0
- Appreciation +5.0/10.0
- Livability +3.3/5.0
- Rent growth +2.5/5.0
- Condition / age +2.2/5.0
- Schools +1.6/10.0
$98,999
🖨 Deal sheet (PDF) 📄 Offer letter ✓ Due diligence
Multi-family units
County records classify this as Multi-Family (2-4 Unit). Listing-text estimate: 2 units. confirmed
Listing remarks
Great investor opportunity! A large 4 bedroom 2 bath Duplex in Burns Flat, home of the Oklahoma Spaceport. This is a sought after duplex plan. This duplex just got a brand new roof. The home needs some interior work. Buyer could rent out both units, or live in both units, or live on one side and rent out the other unit. Renting could offset your monthly mortgage payment. Don't miss out on this opportunity.
Key facts
- Duplex plan
- New roof
- 0.33 acre lot
Tags
Property features AI
Finance
- Other: Residential income property with 2 units; Living area reported as 2,872 (assessor); No flood insurance required (per listing); Located in Indian Trails addition; Listing is Active
- Financial info: Sold/Offered as-is; Not assumable
- HOA & community: No mandatory association dues
Exterior
- Parking: 2 parking spaces (total)
- Utilities: No utility details listed
- Home design: Residential income property (Duplex); Existing property
- Construction: Brick and frame construction; Composition roof; Aluminum frame windows; Built on slab foundation
- Exterior features: Other lot features
Interior
- Kitchen: No appliances listed
- Bedrooms: 8 bedrooms (total)
- Bathrooms: 4 full bathrooms
- Heating & cooling: No heating or cooling details listed
- Interior features: Vacant; Yard
- Laundry & utility: No laundry appliances listed; Slab foundation
Neighborhood map
What this means for you Summary
Snapshot
- This is a 2 × 4-bed/2.0-bath units multifamily listed at $99k. Condition is rated fair.
Deal economics
- At list price, monthly cash flow is $1k ($16k/yr) — positive. Per door: $657/mo.
- The deal already cash-flows at list — no discount required.
- Meets the 1% rule at list price ($3k rent vs $99k).
- Recommended offer: $93k (6.0% below list) — sets the bar for market timing.
Location & tenants
- Location reads 66/100 on livability (#122 in OK) — a middle-class / working-renter tenant base. Strengths: crime A+, cost of living A+, housing A+; Watch: employment D, amenities F, commute F.
- Burns Flat-Dill City (rural): math 15% / reading 22% proficiency, ranked #183 of 270 in OK (top 68%) — low school quality limits family demand, transient renter base, plan for 1-2y turnover; 65% free/reduced lunch — lower-income household profile, screen leases tightly.
- Zoned schools: Will Rogers Es (math 13% / reading 19%, grade F, #582 of 845 statewide, top 69%, 366 students, 0% FRL); Burns Flat-Dill City Hs (math 24% / reading 44%, grade F, #48 of 447 statewide, top 14%, 127 students, 0% FRL) — zoned schools average 0% FRL vs 65% district-wide (65 pts lower); this property's tenant base skews higher-income than the district average.
- Market conditions: 3 active listings in the ZIP; 1 units permitted in Washita County in 2024 (0 in 5+ unit buildings).
Forward outlook
- In year one you build about $4k of equity ($684 loan paydown + $3k appreciation (3.0% local appreciation)).
- Washita County population projected at +5% by 2050 — modest demand growth; plan on rents tracking national, not racing it.
- At projected returns (3.0% appreciation + 3.0% rent growth), your $28k cash investment doubles in ~2 years — after that, you're playing with house money.
- By year 9, paydown + projected appreciation supports a ~$31k cash-out refi (75% LTV) — recoverable capital for the next deal without selling this one.
Negotiation context
- It's been on market 72 days — a 6% lower offer ($93k) is reasonable based on typical stale-listing flexibility.
Risks & watch-outs
- Watch-outs: built in 1958 — expect roof / HVAC / electrical / plumbing capex.
- Climate carrying-cost: extreme-heat days projected 7→19/yr by 2055 (HVAC capex compounding) — expect insurance premiums to compound above CPI over the hold.
Questions for the listing agent
- It's been on market 72 days. Have you received any prior offers? Is the seller open to a 6% concession, seller financing, or rate buy-down credit?
- Can we see the unit-by-unit rent roll, current vacancy, and any below-market leases? What's the average tenancy length?
- What capital expenditures (roof, boiler, parking lot, exteriors) have been made in the last 5 years, and what's planned in the next 2?
- Have any recent inspections been done? Can we get a copy of the seller's disclosures and any deferred-maintenance estimates?
- Built in 1958 — when were the roof, HVAC, electrical panel, plumbing, and water heater last replaced?
- Why hasn't it sold? Are there any deal-killer items the seller is aware of (foundation, flood, title, zoning, code violations)?
- Is there a deadline driving the sale (1031 exchange, divorce, estate, relocation)? That informs how much negotiation room exists.
- Schools are F-rated, which usually means shorter tenancies and higher turnover. Who's the typical renter profile here, and what's been the actual vacancy rate?
- What's the average days-on-market for RENTAL listings here right now (not sales)? A rising rental-DOM trend means longer vacancies and softer asking-rent achievability than the comps imply.
- What's the recent tenant-quality profile in this submarket — average credit score on applications, eviction rate, late-payment / NSF rate, and stable-employment percentage? A property-management company in the area should have these aggregated.
- How much new apartment / multifamily construction is in the pipeline within 1–3 miles? Heavy new supply (>2% of stock underway) typically softens rents 12–24 months out; light construction supports rent growth.
Investment metrics
- 1% rule
- 2.55% ✓
- Cap rate
- 22.22%
- Cash-on-cash
- 56.87%
- DSCR
- 3.53
- GRM
- 3.3
CMA / ARV
No comps found within radius.
Projected returns pro-forma
3.0% appreciation · 3.0% rent growth · sell at horizon
- IRR
- 61.8%
- Equity multiple
- 4.45×
- Total profit
- $95,637
- Equity at exit
- $44,514
- IRR
- 61.4%
- Equity multiple
- 9.05×
- Total profit
- $223,263
- Equity at exit
- $68,602
Cash invested: $27,720 (down + closing). Projections, not guarantees.
Landlord ↔ Tenant lean methodology
- Overall (STATE)
- 83 Strongly Landlord-Friendly
- State Oklahoma
- 83 Strongly Landlord-Friendly · R+20
- County
- — inherits STATE
- City
- — inherits STATE
ZIP-level market 73624
- Active inventory
- 3
- Price-to-rent
- 6.5×
Monthly cashflow live
- Estimated rent
- $2,529 medium interval (Pro) →
- Mortgage (P&I)
- −$519
- Tax est. 1.5%
- −$124 /mo · $1,485/yr
- Insurance
- −$41
- HOA
- −$0
- Vacancy / Maint / Mgmt
- −$531
- Net cashflow
- $1,314
Break-even live
Sensitivity live
| Price | -10% $1,382 | -5% $1,348 | +0% $1,314 | +5% $1,280 | +10% $1,245 |
|---|---|---|---|---|---|
| Rent | -10% $1,114 | -5% $1,214 | +0% $1,314 | +5% $1,414 | +10% $1,514 |
| Rate | -1.0pp $1,364 | -0.5pp $1,339 | base $1,314 | +0.5pp $1,288 | +1.0pp $1,262 |
2-unit breakdown (identical units grouped — click to expand)
| Units | Beds | Baths | Est. rent |
|---|---|---|---|
| 2× units | 4 | 2 | $2,528 |
| #1 | 4 | 2 | $1,264 |
| #2 | 4 | 2 | $1,264 |
| Total (2 units) | $2,529 | ||
UW: 25.0% down · 7.5% · 30yr · 1.5% tax · 5.0% vac · 8.0% maint · 8.0% mgmt
Financing live
Cash to close
- Down payment
- $24,750
- Closing costs
- $2,970
- Reserves months
- —
- Total cash needed
- —
Loan-product check · same deal, 3 products live
Conventional
25% down · 7.5% · 30yr
- Down + closing
- —
- Monthly P&I
- —
- Monthly cashflow
- —
- DSCR
- —
- Eligible?
- —
Personal DTI + credit; lowest rate.
DSCR
20% down · 8.5% · 30yr
- Down + closing
- —
- Monthly P&I
- —
- Monthly cashflow
- —
- DSCR
- —
- Eligible?
- —
No personal income docs; deal must DSCR.
Hard money
10% down · 12.0% · 12mo
- Down + closing
- —
- Monthly P&I
- —
- Monthly cashflow
- —
- DSCR
- —
- Eligible?
- —
Short-term bridge; refi at stabilization.
Listing history 17 events
-
2026-06-21days on market $98,999 Active 72 DOM
-
2026-06-21days on market $98,999 Active 71 DOM
-
2026-06-18days on market $98,999 Active 69 DOM
-
2026-06-17days on market $98,999 Active 68 DOM
-
2026-06-16days on market $98,999 Active 67 DOM
-
2026-06-15days on market $98,999 Active 66 DOM
-
2026-06-13days on market $98,999 Active 64 DOM
-
2026-06-12days on market $98,999 Active 63 DOM
-
2026-06-09days on market $98,999 Active 60 DOM
-
2026-06-08days on market $98,999 Active 59 DOM
-
2026-06-08days on market $98,999 Active 58 DOM
-
2026-06-05days on market $98,999 Active 56 DOM
-
2026-06-04days on market $98,999 Active 54 DOM
-
2026-06-02days on market $98,999 Active 53 DOM
-
2026-06-01days on market $98,999 Active 52 DOM
-
2026-05-31days on market $98,999 Active 51 DOM
-
2026-04-09$98,999 Active
ⓘ Source: listings_history table (triggers on properties + properties_extension) + one-shot
backfill from property_details.listing_events for pre-trigger history.
Climate risk First Street
- Flood 1/10 Low FEMA zone X (unshaded) · 0% chance over 30 yrs
- Wildfire 3/10 Moderate
- Heat 6/10 Major 7 d/yr ≥105°F today · 19 d/yr by 30 yrs out
- Wind 2/10 Low 3% chance of damaging wind over 30 yrs
- Air quality 1/10 Low 0 unhealthy d/yr today · 0 by 30 yrs out
Nearby sold comps map
Loading sold comps map…
Walkable amenities ~0.75 mi
Loading nearby amenities…
Taxation est. · year 1
- Rental income
- $30,348
- − Mortgage interest
- −$5,545
- − Property taxes
- −$1,485
- − Insurance
- −$495
- − Repairs & maintenance
- −$2,428
- − Management
- −$2,428
- − Depreciation
- −$2,880
- Taxable income
- $15,087
- Est. tax owed @ 24.0%
- −$3,621
- After-tax cash flow
- $12,144/yr
For passive investors: Depreciation is non-cash, so a rental often shows a tax loss while cash-flowing — sheltering income. Rental losses are passive: they offset passive income freely, and up to $25,000/yr can offset ordinary (W-2) income if you actively participate and your MAGI is under $100k (phasing out to $0 by $150k); unused losses carry forward. On sale, claimed depreciation is recaptured at up to 25%, and gains may owe capital-gains tax (a 1031 exchange can defer both). Figures are a year-1 estimate at your 24.0% rate — not tax advice; consult a CPA.
Condition & rehab AI · 13 photos
This multi-family property requires moderate renovations, including new carpet, paint, bathroom fixtures, and kitchen cabinets, to improve its condition and value.
Repairs flagged
- Major Carpet — Severe wear and tear, needs replacement.
- Major Paint — Worn paint on walls, needs repainting.
- Major Bathroom Fixtures — Worn and outdated fixtures, needs replacement.
- Major Kitchen Cabinets — Old and worn cabinets, needs replacement.
Value-add opportunities
- Resale New carpet — Fresh carpet will improve the home's appearance and appeal to potential buyers.
- Resale Paint job — Fresh paint will make the home look more appealing and modern.
- Resale New bathroom fixtures — Upgraded fixtures will enhance the home's value and appeal to potential buyers.
- Resale New kitchen cabinets — Fresh cabinets will improve the home's functionality and aesthetic appeal.
Renovation cost estimate screening
| Repair item | Severity | Est. cost |
|---|---|---|
| Carpet · Severe wear and tear, needs replacement. | Major | $15,000–50,000 |
| Paint · Worn paint on walls, needs repainting. | Major | $15,000–50,000 |
| Bathroom Fixtures · Worn and outdated fixtures, needs replacement. | Major | $15,000–50,000 |
| Kitchen Cabinets · Old and worn cabinets, needs replacement. | Major | $15,000–50,000 |
| Total estimated repair cost · 4 items | $60,000–200,000 |
Value-add ROI direction
- Resale New carpet — Fresh carpet will improve the home's appearance and appeal to potential buyers. ↑
- Resale Paint job — Fresh paint will make the home look more appealing and modern. ↑
- Resale New bathroom fixtures — Upgraded fixtures will enhance the home's value and appeal to potential buyers. ↑
- Resale New kitchen cabinets — Fresh cabinets will improve the home's functionality and aesthetic appeal. ↑
ⓘ Cost ranges are severity-bucket heuristics (US national rule-of-thumb). Get contractor quotes + a written scope before underwriting a rehab budget.
Schools (NCES district)
- District
- Burns Flat-Dill City
- NCES district ID
- 4000014
- Math proficiency
- 15% ▼ -2.00%
- Reading proficiency
- 22% ▲ 4.00%
- Median HH income
- $45,907
- Composite
- 16.25/100
- National rank
- #9221
- State rank
- #183 of 270 in OK
Livability — Burns Flat
- Score
- 66/100
- State rank
- #122
- US rank
- #12117
Category grades
Schools grade is shown separately in the Schools card above.
Census & demographics
- Census place
- Burns Flat, OK
- City population
- 1,968
- Population (ZIP)
- 1,968
Population outlook (Washita County) Hauer SSP2
- Today (2025)
- 12,143 people
- By 2030
- 12,276 · +1.1%
- By 2040
- 12,522 · +3.1%
- By 2050
- 12,740 · +4.9%
- By 2075
- 13,198 · +8.7%
- By 2100
- 13,189 · +8.6%
Race, ethnicity, and origin ACS 2023
- Neighborhood character
- Predominantly White (76%)
- Race & ethnicity
- White 76% Hispanic / Latino 12% Two or more races 12% Native American 3% Black 1%
- Hispanic origin (detail)
- Mexican 10%
- Common ancestry
- Italian 2% Serbian 1% Iranian 1%
- Foreign-born
- 2% · Canada
- Languages at home
- 95% English-only · Spanish 4% German/W. Germanic 1%
Political lean MEDSL · Washita
- 2024 margin
- Solid R (+74.8) · D 11.8% · R 86.6% · Other 1.5%
- 2008→2024 swing
- -18.9pp toward R · 2008: -55.9pp · 2024: -74.8pp
- All cycles
- 2024: R+74.8 2020: R+73.0 2016: R+70.5 2012: R+61.8 2008: R+55.9
Not yet ingested
- Civics
- —
Market trends
- HPI YoY
- —
- Current HPI
- —
- Rent YoY
- —
- Metro
- —
- State GDP YoY
- ▲ 1.55%
- F500 in state
- 6
Industry mix (Fortune 500 HQ in OK)
| Industry | F500 HQs | Revenue |
|---|---|---|
| Energy | 3 | $48B |
|
||
Price history
1 event — show timeline
- 2026-04-09 Listed $98,999 MLSOK
Cash-flow waterfall
monthlySold comps — $/sqft
last 12 mo · ≤1 miLoading sold comps…