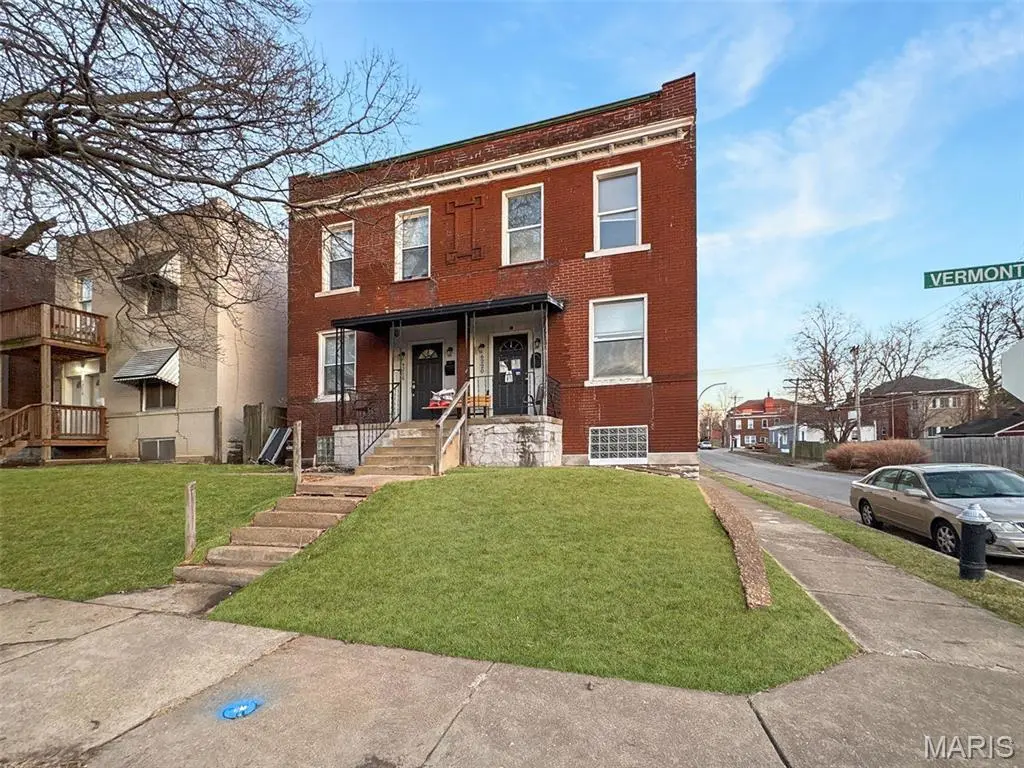
6220 Vermont Ave · St. Louis, MO
Flood risk 1/10 · Minimal
- FEMA flood zone
- X (unshaded)
- Chance of flooding over 30 yrs
- 0.0%
- Est. flood insurance / yr
- $473 – $860
Fire risk 1/10 · Minimal
- Est. fire insurance / yr
- $1,054 – $1,958
Heat risk 5/10 · Moderate
- Hot days now (above 109°F)
- 7 days/yr
- Hot days in 30 yrs
- 21 days/yr
Wind risk 2/10 · Minimal
- Chance of severe wind over 30 yrs
- 1.0%
Air-quality risk 3/10 · Minor
- Unhealthy air days now
- 3 days/yr
- Unhealthy air days in 30 yrs
- 4 days/yr
Risk factors via First Street. Map © Google.
Why this score? — see what drove the B- grade
The composite is a weighted blend of 9 inputs, each scored 0–100. Each bar is that input's sub-score; the figure is the points it added to the 100-point composite (weight × sub-score).
- Cash flow +30.0/30.0
- DSCR +10.0/10.0
- 1% rule +8.2/10.0
- ARV discount +7.5/15.0
- Rent growth +3.3/5.0
- Livability +2.5/5.0
- Condition / age +2.5/5.0
- Schools +1.2/10.0
- Appreciation +0.0/10.0
$94,900
🖨 Deal sheet 📄 Offer letter ✓ Due diligence
Listing remarks MLS
Check out this adorable 3 bed 2 bath townhome! This property is offering a comfortable and functional layout. Thoughtfully designed living spaces provide flexibility for everyday living and entertaining. A great opportunity to make this home your own. An excellent option for buyers seeking a balanced and efficient layout.
Key facts
- Built 1908
- Listed 154 days
Neighborhood map
What this means for you Summary
Snapshot
- This is a 3-bed/2.0-bath townhouse listed at $95k.
Deal economics
- At list price, monthly cash flow is $376 ($5k/yr) — positive.
- The deal already cash-flows at list — no discount required.
- Meets the 1% rule at list price ($1k rent vs $95k).
- Recommended offer: $84k (12.0% below list) — sets the bar for market timing.
- Cap rate 11.1% vs local median 5.0% in St. Louis — top-decile yield for the area; either an underpriced asset or a hidden risk that comps aren't pricing in. Stress-test before assuming the spread holds.
Location & tenants
- Location reads: area grade B — affects rentability + tenant quality, not the cash-flow math above.
- St. Louis City (urban): math 10% / reading 18% proficiency, ranked #312 of 324 in MO (top 96%) — low school quality limits family demand, transient renter base, plan for 1-2y turnover; 80% free/reduced lunch — lower-income household profile, screen leases tightly.
- Market conditions: Rents rising (+3.3%/yr); 125 active listings in the ZIP; 31 comparable units currently listed for rent nearby; rentals at typical pace (median 22d on market — plan ~3-4 weeks tenant-placement turnaround); 42% of comp listings sitting > 30 days — soft ceiling on asking rent; 294 units permitted in St. Louis city in 2024 (227 in 5+ unit buildings).
- This rent runs 32% of the median local income ($47k/yr) — at the standard rent-burdened threshold; future hikes will face affordability resistance.
Forward outlook
- Local home prices are declining (-3.0%/yr); year-one equity from $656 of loan paydown is wiped out by about $3k of value loss. Plan a longer hold.
- St. Louis County population projected to shrink 6% by 2050 — rents likely to lag national; underwrite the cash flow, not the appreciation.
- At projected returns (-3.0% appreciation + 3.3% rent growth), your $27k cash investment doubles in ~7 years — after that, you're playing with house money.
Negotiation context
- It's been on market 154 days — a 12% lower offer ($84k) is reasonable based on typical stale-listing flexibility.
- 2 sale attempts since 3y ago; this cycle's ask has dropped $35k (27%) from the opening price — seller is motivated, your offer sets the floor, not the list.
Risks & watch-outs
- Watch-outs: built in 1908 — expect roof / HVAC / electrical / plumbing capex.
- Climate carrying-cost: extreme-heat days projected 7→21/yr by 2055 (HVAC capex compounding) — expect insurance premiums to compound above CPI over the hold.
Questions for the listing agent
- It's been on market 154 days. Have you received any prior offers? Is the seller open to a 12% concession, seller financing, or rate buy-down credit?
- Built in 1908 — when were the roof, HVAC, electrical panel, plumbing, and water heater last replaced?
- Why hasn't it sold? Are there any deal-killer items the seller is aware of (foundation, flood, title, zoning, code violations)?
- Is there a deadline driving the sale (1031 exchange, divorce, estate, relocation)? That informs how much negotiation room exists.
- What's the average days-on-market for RENTAL listings here right now (not sales)? A rising rental-DOM trend means longer vacancies and softer asking-rent achievability than the comps imply.
- What's the recent tenant-quality profile in this submarket — average credit score on applications, eviction rate, late-payment / NSF rate, and stable-employment percentage? A property-management company in the area should have these aggregated.
- How much new for-sale + rental construction is in the pipeline within 1–3 miles? Heavy new supply typically softens prices + rents 12–24 months out; constrained supply supports both.
Investment metrics
- 1% rule
- 1.32% ✓
- Cap rate
- 11.05%
- Cash-on-cash
- 16.99%
- DSCR
- 1.76
- GRM
- 6.3
CMA / ARV
- ARV (median comp)
- $198,591
- List price
- $94,900
- Delta
- -52.21%
- Verdict
- UNDERPRICED
- Comps
- 3 within 1.0 mi
Show comp detail 1 sale within ~0.75 mi
| Address | Dist | Beds/Ba | Sqft | Sold | Price | $/sf | Match |
|---|---|---|---|---|---|---|---|
| 5310 Chouteaus Bluff Dr #5310 | 0.71mi | 2/3.0 (-1) | 1,760 (+9%) | 1mo | $365,000 | $207 | 43 |
Match score weights: distance 35% · size 25% · config 20% · recency 20%. Top-matched comps best support the ARV.
Projected returns pro-forma
-3.0% appreciation · 3.27% rent growth · sell at horizon
- IRR
- 8.5%
- Equity multiple
- 1.34×
- Total profit
- $8,926
- Equity at exit
- $14,150
- IRR
- 18.0%
- Equity multiple
- 2.51×
- Total profit
- $40,023
- Equity at exit
- $8,205
Cash invested: $26,572 (down + closing). Projections, not guarantees.
Landlord ↔ Tenant lean methodology
- Overall (STATE)
- 81 Strongly Landlord-Friendly
- State Missouri
- 81 Strongly Landlord-Friendly · R+10
- County
- — inherits STATE
- City
- — inherits STATE
ZIP-level market 63111
- Rents YoY
- 3.3%
- Active inventory
- 125
- Price-to-rent
- 6.3×
Monthly cashflow live
- Estimated rent
- $1,256 high interval (Pro) →
- Mortgage (P&I)
- −$498
- Tax from tax record
- −$79 /mo · $946/yr
- Insurance
- −$40
- HOA
- −$0
- Vacancy / Maint / Mgmt
- −$264
- Net cashflow
- $376
Break-even live
UW: 25.0% down · 7.5% · 30yr · 1.5% tax · 5.0% vac · 8.0% maint · 8.0% mgmt
Financing live
Cash to close
- Down payment
- $23,725
- Closing costs
- $2,847
- Reserves months
- —
- Total cash needed
- —
Loan-product check · same deal, 3 products live
Conventional
25% down · 7.5% · 30yr
- Down + closing
- —
- Monthly P&I
- —
- Monthly cashflow
- —
- DSCR
- —
- Eligible?
- —
Personal DTI + credit; lowest rate.
DSCR
20% down · 8.5% · 30yr
- Down + closing
- —
- Monthly P&I
- —
- Monthly cashflow
- —
- DSCR
- —
- Eligible?
- —
No personal income docs; deal must DSCR.
Hard money
10% down · 12.0% · 12mo
- Down + closing
- —
- Monthly P&I
- —
- Monthly cashflow
- —
- DSCR
- —
- Eligible?
- —
Short-term bridge; refi at stabilization.
Rent comps 31 comps
| Address | Beds | Baths | Sqft | Rent | $/sqft | DOM | Units | Dist |
|---|---|---|---|---|---|---|---|---|
| 6436 Idaho Ave Saint Louis, MO | 2.0 | 1.0 | 1050 | $995 | $0.95 | 43d | 1 | 0.20mi |
| 711 Wilmington Ave Unit NA St. Louis, MO | 2.0 | 1.0 | 1051 | $1,300 | $1.24 | 43d | 1 | 0.24mi |
| 712 Dover Pl Saint Louis, MO | 2.0 | 1.0 | 1100 | $900 | $0.82 | 43d | 1 | 0.27mi |
| 712 Dover Pl Unit 1FL St. Louis, MO | 2.0 | 1.0 | 1100 | $1,000 | $0.91 | 43d | 1 | 0.27mi |
| 736 Dover Pl Unit 1F St. Louis, MO | 2.0 | 1.0 | 1200 | $1,395 | $1.16 | 43d | 1 | 0.29mi |
| 6800 Virginia Ave Unit 1 St. Louis, MO | 3.0 | 1.0 | 1500 | $1,475 | $0.98 | 17d | 1 | 0.35mi |
| 6730 Vermont Ave Saint Louis, MO | 3.0 | 2.0 | 1534 | $1,600 | $1.04 | 14d | 1 | 0.35mi |
| 6915 Alabama Ave Unit 1st Floor St. Louis, MO | 2.0 | 1.0 | 1248 | $1,200 | $0.96 | 43d | 1 | 0.46mi |
| 3641 Wilmington Ave Saint Louis, MO | 2.0 | 1.0 | 1175 | $1,050 | $0.89 | 43d | 1 | 0.56mi |
| 7024 Pennsylvania Ave Unit F St. Louis, MO | 2.0 | 1.0 | 1081 | $930 | $0.86 | 16d | 1 | 0.59mi |
| 3668 Wilmington Ave Saint Louis, MO | 2.0 | 1.0 | 1214 | $1,350 | $1.11 | 43d | 1 | 0.60mi |
| 3668a Wilmington Ave St. Louis, MO | 2.0 | 1.0 | 1212 | $1,295 | $1.07 | 14d | 1 | 0.60mi |
| 7417 Vermont Ave St. Louis, MO | 1.0–2.0 | 1.0–2.0 | 1144 | $1,600 | $1.40 | 1d | 8 | 0.77mi |
| 7417 Vermont Ave Unit 103 St. Louis, MO | 2.0 | 2.0 | 1069 | $1,500 | $1.40 | 14d | 1 | 0.78mi |
| 5028 Louisiana Ave Saint Louis, MO | 2.0 | 1.0 | 1200 | $1,100 | $0.92 | 43d | 1 | 0.78mi |
| 3243 Delor St Unit 3243 St. Louis, MO | 3.0 | 1.0 | 1100 | $1,250 | $1.14 | 22d | 1 | 0.83mi |
| 3324 Liberty St Saint Louis, MO | 2.0 | 1.0 | 1100 | $950 | $0.86 | 16d | 1 | 0.86mi |
| 4716 Louisiana Ave Unit 2F St. Louis, MO | 2.0 | 1.0 | 1200 | $995 | $0.83 | 43d | 1 | 0.92mi |
| 4657 Idaho Ave Unit 4659 St. Louis, MO | 2.0 | 2.0 | 1668 | $1,295 | $0.78 | 23d | 1 | 1.00mi |
| 3857 Boulevard Heights Ct Saint Louis, MO | 3.0 | 2.5 | 1697 | $2,250 | $1.33 | 1d | 1 | 1.02mi |
| 4637 Louisiana Ave Saint Louis, MO | 2.0 | 1.0 | 1104 | $1,175 | $1.06 | 12d | 1 | 1.07mi |
| 3635 Marceline Ter Unit 2ND St. Louis, MO | 3.0 | 1.0 | 1250 | $1,275 | $1.02 | 43d | 1 | 1.11mi |
| 7924 Michigan Ave Unit 2F St. Louis, MO | 3.0 | 2.0 | 1250 | $1,195 | $0.96 | 3d | 1 | 1.13mi |
| 4075 Bowen St Saint Louis, MO | 2.0 | 1.0 | 1200 | $1,200 | $1.00 | 43d | 1 | 1.13mi |
| 4000 Schiller Pl Saint Louis, MO | 2.0 | 2.5 | 1448 | $1,618 | $1.12 | 7d | 1 | 1.16mi |
| 4114 Alma Ave Saint Louis, MO | 3.0 | 1.5 | 1269 | $2,065 | $1.63 | 1d | 1 | 1.29mi |
| 4450 Pennsylvania Ave Saint Louis, MO | 3.0 | 1.0 | 1500 | $1,100 | $0.73 | 4d | 1 | 1.30mi |
| 4177 Schiller Pl Saint Louis, MO | 2.0 | 1.0 | 1200 | $1,150 | $0.96 | 23d | 1 | 1.44mi |
| 4217 S Grand Blvd Unit 1 St. Louis, MO | 3.0 | 1.0 | 1250 | $1,400 | $1.12 | 4d | 1 | 1.46mi |
| 3945 Crosby Dr Saint Louis, MO | 2.0 | 1.0 | 1100 | $2,083 | $1.89 | 1d | 1 | 1.47mi |
| 4250 Michigan Ave Saint Louis, MO | 2.0 | 1.0 | 2184 | $1,200 | $0.55 | 43d | 1 | 1.48mi |
Listing history 22 events
-
2026-06-18days on market $94,900 Active 154 DOM
-
2026-06-17days on market $94,900 Active 153 DOM
-
2026-06-16days on market $94,900 Active 152 DOM
-
2026-06-15days on market $94,900 Active 151 DOM
-
2026-06-13pricedays on market $94,900 Active 149 DOM
-
2026-06-09days on market $104,900 Active 145 DOM
-
2026-06-08days on market $104,900 Active 144 DOM
-
2026-06-08days on market $104,900 Active 143 DOM
-
2026-06-05days on market $104,900 Active 140 DOM
-
2026-06-03days on market $104,900 Active 139 DOM
-
2026-06-02days on market $104,900 Active 138 DOM
-
2026-06-01days on market $104,900 Active 137 DOM
-
2026-05-31days on market $104,900 Active 136 DOM
-
2026-05-08price $104,900 323-char remark
Show marketing remark (323 chars)
Check out this adorable 3 bed 2 bath townhome! This property is offering a comfortable and functional layout. Thoughtfully designed living spaces provide flexibility for everyday living and entertaining. A great opportunity to make this home your own. An excellent option for buyers seeking a balanced and efficient layout.
-
2026-04-01price $109,900 323-char remark
Show marketing remark (323 chars)
Check out this adorable 3 bed 2 bath townhome! This property is offering a comfortable and functional layout. Thoughtfully designed living spaces provide flexibility for everyday living and entertaining. A great opportunity to make this home your own. An excellent option for buyers seeking a balanced and efficient layout.
-
2026-02-23price $119,900 323-char remark
Show marketing remark (323 chars)
Check out this adorable 3 bed 2 bath townhome! This property is offering a comfortable and functional layout. Thoughtfully designed living spaces provide flexibility for everyday living and entertaining. A great opportunity to make this home your own. An excellent option for buyers seeking a balanced and efficient layout.
-
2026-01-15$129,900 Active 323-char remark
Show marketing remark (323 chars)
Check out this adorable 3 bed 2 bath townhome! This property is offering a comfortable and functional layout. Thoughtfully designed living spaces provide flexibility for everyday living and entertaining. A great opportunity to make this home your own. An excellent option for buyers seeking a balanced and efficient layout.
-
2023-08-30historical
-
2023-08-19$190,000 Active
-
2020-12-04soldstatus $669,375
-
2007-06-04soldstatus $30,250
-
2004-04-07soldstatus
ⓘ Source: listings_history table (triggers on properties + properties_extension) + one-shot
backfill from property_details.listing_events for pre-trigger history.
Tax reassessment forecast MO · Resets to sale price
- Current annual tax
- $946 · $79/mo
- Projected year-2 tax
- $946 · $79/mo
- Expected delta
- $0/yr ($0/mo · -0.0%)
ⓘ Screening estimate from a state-policy table — verify with the county assessor before closing.
Climate risk First Street
- Flood 1/10 Low FEMA zone X (unshaded) · 0% chance over 30 yrs
- Wildfire 1/10 Low
- Heat 5/10 Major 7 d/yr ≥109°F today · 21 d/yr by 30 yrs out
- Wind 2/10 Low 100% chance of damaging wind over 30 yrs
- Air quality 3/10 Moderate 3 unhealthy d/yr today · 4 by 30 yrs out
Nearby sold comps map
Loading sold comps map…
Walkable amenities ~0.75 mi
Loading nearby amenities…
Taxation est. · year 1
- Rental income
- $15,074
- − Mortgage interest
- −$5,316
- − Property taxes
- −$946
- − Insurance
- −$474
- − Repairs & maintenance
- −$1,206
- − Management
- −$1,206
- − Depreciation
- −$2,761
- Taxable income
- $3,165
- Est. tax owed @ 24.0%
- −$760
- After-tax cash flow
- $3,756/yr
For passive investors: Depreciation is non-cash, so a rental often shows a tax loss while cash-flowing — sheltering income. Rental losses are passive: they offset passive income freely, and up to $25,000/yr can offset ordinary (W-2) income if you actively participate and your MAGI is under $100k (phasing out to $0 by $150k); unused losses carry forward. On sale, claimed depreciation is recaptured at up to 25%, and gains may owe capital-gains tax (a 1031 exchange can defer both). Figures are a year-1 estimate at your 24.0% rate — not tax advice; consult a CPA.
Schools (NCES district)
- District
- St. Louis City
- NCES district ID
- 2929280
- Math proficiency
- 10% ▼ -6.00%
- Reading proficiency
- 18% ▼ -3.00%
- Median HH income
- $35,685
- Composite
- 11.54/100
- National rank
- #9699
- State rank
- #312 of 324 in MO
Livability — St. Louis
No livability data for this city. (Only ~50 U.S. cities are tracked.)
Census & demographics
- Census place
- St. Louis, MO
- County
- Saint Louis City · 254,015 people
- City population
- 283,259
- Metro
- St. Louis, MO-IL
- Population (ZIP)
- 18,851
- Household income
- $47,039
- Rent vs Own
- Severe rent burden
- 1364.0
Population outlook (St. Louis County) Hauer SSP2
- Today (2025)
- 315,737 people
- By 2030
- 313,865 · -0.6%
- By 2040
- 305,439 · -3.3%
- By 2050
- 296,529 · -6.1%
- By 2075
- 271,028 · -14.2%
- By 2100
- 255,359 · -19.1%
Race, ethnicity, and origin ACS 2023
- Neighborhood character
- Diverse neighborhood (Simpson 0.65)
- Race & ethnicity
- Black 42% White 41% Two or more races 11% Hispanic / Latino 9% Asian 1%
- Hispanic origin (detail)
- Mexican 6%
- Common ancestry
- Lithuanian 3% Slovak 1% Romanian 1%
- Foreign-born
- 7% · Canada, India
- Languages at home
- 90% English-only · Spanish 7% Other Indo-European 1%
Political lean MEDSL · St. Louis
- 2024 margin
- Solid D (+64.7) · D 81.4% · R 16.7% · Other 2.0%
- 2008→2024 swing
- -3.5pp toward R · 2008: 68.2pp · 2024: 64.7pp
- All cycles
- 2024: D+64.7 2020: D+66.2 2016: D+63.7 2012: D+66.6 2008: D+68.2
Not yet ingested
- Civics
- —
Market trends
- HPI YoY
- ▼ -92.80%
- Current HPI
- 169.4644
- Rent YoY
- ▲ 3.27%
- Metro
- St. Louis, MO-IL
- State GDP YoY
- ▲ 1.84%
- F500 in state
- 20
Industry mix (Fortune 500 HQ in MO)
| Industry | F500 HQs | Revenue |
|---|---|---|
| Healthcare | 1 | $163B |
|
||
| Insurance | 1 | $21B |
|
||
| Industrial Technology | 1 | $17B |
|
||
| Retail | 1 | $16B |
|
||
| Industrial Distribution | 1 | $10B |
|
||
| Utilities | 1 | $9B |
|
||
Price history
+246.8% since first listed9 events — show timeline
- 2026-05-08 Price Changed $104,900 MARIS as Distributed by MLS Grid
- 2026-04-01 Price Changed $109,900 MARIS as Distributed by MLS Grid
- 2026-02-23 Price Changed $119,900 MARIS as Distributed by MLS Grid
- 2026-01-15 Listed $129,900 MARIS as Distributed by MLS Grid
- 2023-08-30 Delisted — MARIS as Distributed by MLS Grid
- 2023-08-19 Listed $190,000 MARIS as Distributed by MLS Grid
- 2020-12-04 Sold (Public Records) $669,375 Public Records
- 2007-06-04 Sold (Public Records) $30,250 Public Records
- 2004-04-07 Sold (Public Records) — Public Records
Property tax history
+6.5%/yrLatest (2024): $946 · +5.0% YoY. Source: county tax records.
Cash-flow waterfall
monthlySold comps — $/sqft
last 12 mo · ≤1 miLoading sold comps…