 Duplex
🌊 Lakefront
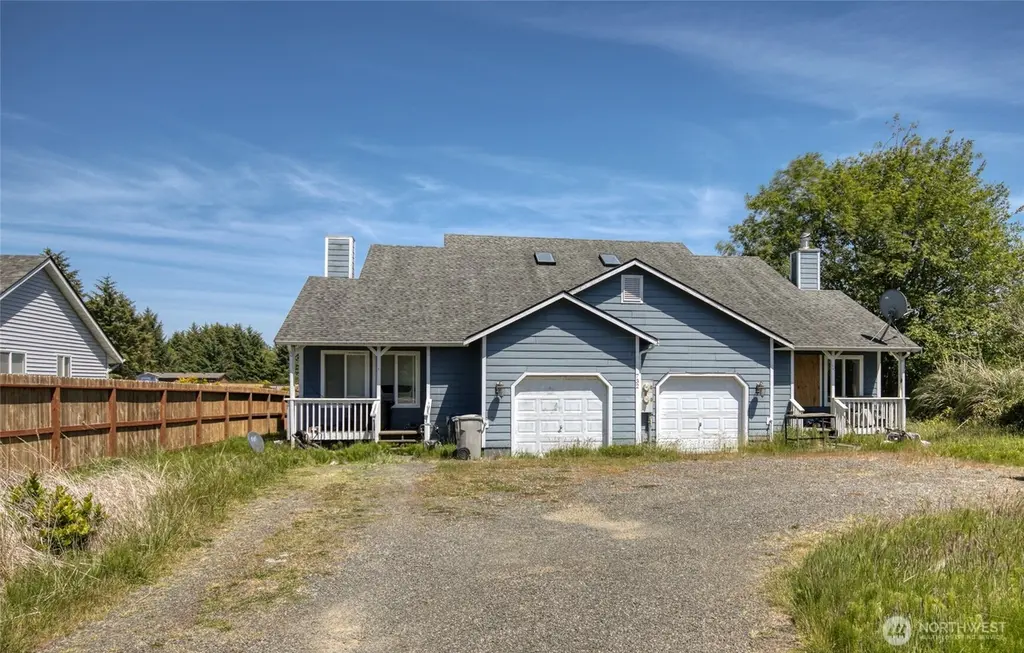
Duplex
🌊 Lakefront
732 Point Brown Ave SE · Ocean Shores, WA
Flood risk 1/10 · Minimal
- FEMA flood zone
- X (unshaded)
- Chance of flooding over 30 yrs
- 0.0%
- Est. flood insurance / yr
- $507 – $1,088
Fire risk 1/10 · Minimal
- Est. fire insurance / yr
- $604 – $1,122
Heat risk 1/10 · Minimal
- Hot days now (above 72°F)
- 7 days/yr
- Hot days in 30 yrs
- 17 days/yr
Wind risk 1/10 · Minimal
- Chance of severe wind over 30 yrs
- —
Air-quality risk 5/10 · Moderate
- Unhealthy air days now
- 6 days/yr
- Unhealthy air days in 30 yrs
- 6 days/yr
Risk factors via First Street. Map © Google.
Why this score? — see what drove the C- grade
The composite is a weighted blend of 9 inputs, each scored 0–100. Each bar is that input's sub-score; the figure is the points it added to the 100-point composite (weight × sub-score).
- Cash flow +22.1/30.0
- ARV discount +7.5/15.0
- DSCR +7.1/10.0
- 1% rule +4.9/10.0
- Schools +3.4/10.0
- Livability +3.1/5.0
- Rent growth +2.5/5.0
- Condition / age +2.5/5.0
- Appreciation +0.0/10.0
$425,000
🖨 Deal sheet 📄 Offer letter ✓ Due diligence
Multi-family units
County records classify this as Multi-Family (2-4 Unit). Listing-text estimate: 2 units. confirmed
Listing remarks
Tons of Potential, Investor Special! Waterfront Townhome style Duplex on the Canal. 3 Bedroom 2 Full Bath Per Side 1424sqft per side with an oversized one car garage per side, gorgeous views - complete with your own private dock. Rent's estimated at $2,000 Per Month Per Side That's $48,000 Per Year and a 9% CAP Rate after renovation! Bring your toolbelt and add this great investment to your portfolio. Come view today!
Key facts
- Duplex on the canal
- Waterfront townhome
- Private dock
Tags
Property features AI
Finance
- Other: Vacancy rate reported at 50%; Total building area: 2,848 square feet; Each unit listed at approximately 1,424 square feet; Water/sewer/garbage combined: 1800
- Financial info: Gross scheduled income: $48,000/year; Total monthly income: $4,000; Actual rent: $2,000/month for each unit; Gross adjusted income: $48,000; Net operating income: $42,031; Total annual expenses: $5,969; Electric expense: $1,200; Gross rent multiplier: 12.6; Listing terms: Cash or Conventional
Exterior
- Parking: Uncovered parking for about 10 vehicles; 2 covered parking spaces; 2-car garage; RV parking
- Utilities: Public water (City of Ocean Shores); Sewer connected (City of Ocean Shores); Electric power (Grays Harbor PUD); Electric energy source
- Home design: Duplex (Residential income, multi-family); Two stories; Has a view
- Construction: Wood construction; Composition roof; Poured concrete foundation; Built as a duplex
- Exterior features: Wood products exterior; Deck; Dock; RV parking; Paved lot
Interior
- Kitchen: Range/oven in each unit; Refrigerator in each unit; Dishwasher in each unit
- Bedrooms: Two 3-bedroom units (Unit A: 3 bedrooms; Unit B: 3 bedrooms)
- Flooring: Laminate; Carpet
- Bathrooms: Two 2-bath units (Unit A: 2 bathrooms; Unit B: 2 bathrooms)
- Heating & cooling: Forced air heating; Wall furnace; No cooling
- Interior features: Laminate and carpet flooring; Fireplaces in each unit; Has heating (Forced air and wall furnace)
- Laundry & utility: Washer and dryer in each unit
Neighborhood map
What this means for you Summary
Snapshot
- This is a 2 × 3-bed/2.0-bath units multifamily listed at $425k.
Deal economics
- At list price, monthly cash flow is $684 ($8k/yr) — positive. Per door: $342/mo.
- The deal already cash-flows at list — no discount required.
- To meet the 1% rule (rent ≥ 1% of price), the offer needs to be $422k (0.7% below list).
- Recommended offer: $419k (1.5% below list) — sets the bar for market timing.
- Cap rate 8.2% vs local median 3.1% in Ocean Shores — top-decile yield for the area; either an underpriced asset or a hidden risk that comps aren't pricing in. Stress-test before assuming the spread holds.
Location & tenants
- Location reads 62/100 on livability (#424 in WA) — a middle-class / working-renter tenant base. Strengths: housing A; Watch: schools C-, crime C-, health & safety C-.
- North Beach School District (rural): math 32% / reading 44% proficiency, ranked #236 of 291 in WA (top 81%) — families likely to look elsewhere, expect single-tenant / working-renter base with shorter leases; 63% free/reduced lunch — lower-income household profile, screen leases tightly.
- Market conditions: 653 active listings in the ZIP; 297 units permitted in Grays Harbor County in 2024 (17 in 5+ unit buildings).
- At $4,219/mo this rent would consume 87% of the median local household income ($58k/yr) (locally 172% of renters already pay >50% of income on rent) — very limited rent-growth headroom before tenants either downsize or default.
Forward outlook
- Local home prices are declining (-3.0%/yr); year-one equity from $3k of loan paydown is wiped out by about $13k of value loss. Plan a longer hold.
- Grays Harbor County population projected at -24% by 2050 — secular population decline; favor cash flow + early exit over multi-decade hold.
Negotiation context
- It's been on market 15 days — a 2% lower offer ($419k) is reasonable based on typical stale-listing flexibility.
- 3 sale attempts since 10y ago with the ask held roughly flat each time — persistent listings suggest the price (not the market) is what's stuck; bring a comps-based counter.
Questions for the listing agent
- Can we see the unit-by-unit rent roll, current vacancy, and any below-market leases? What's the average tenancy length?
- What capital expenditures (roof, boiler, parking lot, exteriors) have been made in the last 5 years, and what's planned in the next 2?
- Is there a deadline driving the sale (1031 exchange, divorce, estate, relocation)? That informs how much negotiation room exists.
- This sits on a lake — are riparian / water-frontage rights deeded with the parcel? Any dock permits, shoreline easements, or HOA water-use restrictions?
- What's the documented flood / surge / shoreline-erosion history here (FEMA AND non-FEMA — e.g., storm surge, creek backup, septic-field saturation)?
- Any water-quality or seasonal algae-bloom issues that affect tenant satisfaction or short-term-rental demand?
- What's the average days-on-market for RENTAL listings here right now (not sales)? A rising rental-DOM trend means longer vacancies and softer asking-rent achievability than the comps imply.
- What's the recent tenant-quality profile in this submarket — average credit score on applications, eviction rate, late-payment / NSF rate, and stable-employment percentage? A property-management company in the area should have these aggregated.
- How much new apartment / multifamily construction is in the pipeline within 1–3 miles? Heavy new supply (>2% of stock underway) typically softens rents 12–24 months out; light construction supports rent growth.
Investment metrics
- 1% rule
- 0.99% ✗
- Cap rate
- 8.22%
- Cash-on-cash
- 6.89%
- DSCR
- 1.31
- GRM
- 8.4
CMA / ARV
No comps found within radius.
Projected returns pro-forma
-3.0% appreciation · 3.0% rent growth · sell at horizon
- IRR
- -5.8%
- Equity multiple
- 0.79×
- Total profit
- $-25,447
- Equity at exit
- $63,369
- IRR
- 3.9%
- Equity multiple
- 1.28×
- Total profit
- $33,438
- Equity at exit
- $36,746
Cash invested: $119,000 (down + closing). Projections, not guarantees.
Landlord ↔ Tenant lean methodology
- Overall (STATE)
- 28 Tenant-Leaning
- State Washington
- 28 Tenant-Leaning · D+8
- County
- — inherits STATE
- City
- — inherits STATE
ZIP-level market 98569
- Home prices YoY
- -3.4%
- Active inventory
- 653
- Price-to-rent
- 16.8×
Monthly cashflow live
- Estimated rent
- $4,219 medium interval (Pro) →
- Mortgage (P&I)
- −$2,229
- Tax from tax record
- −$244 /mo · $2,924/yr
- Insurance
- −$177
- HOA
- −$0
- Vacancy / Maint / Mgmt
- −$886
- Net cashflow
- $684
Break-even live
2-unit breakdown (identical units grouped — click to expand)
| Units | Beds | Baths | Est. rent |
|---|---|---|---|
| 2× units | 3 | 2 | $4,220 |
| #1 | 3 | 2 | $2,110 |
| #2 | 3 | 2 | $2,110 |
| Total (2 units) | $4,219 | ||
UW: 25.0% down · 7.5% · 30yr · 1.5% tax · 5.0% vac · 8.0% maint · 8.0% mgmt
Financing live
Cash to close
- Down payment
- $106,250
- Closing costs
- $12,750
- Reserves months
- —
- Total cash needed
- —
Loan-product check · same deal, 3 products live
Conventional
25% down · 7.5% · 30yr
- Down + closing
- —
- Monthly P&I
- —
- Monthly cashflow
- —
- DSCR
- —
- Eligible?
- —
Personal DTI + credit; lowest rate.
DSCR
20% down · 8.5% · 30yr
- Down + closing
- —
- Monthly P&I
- —
- Monthly cashflow
- —
- DSCR
- —
- Eligible?
- —
No personal income docs; deal must DSCR.
Hard money
10% down · 12.0% · 12mo
- Down + closing
- —
- Monthly P&I
- —
- Monthly cashflow
- —
- DSCR
- —
- Eligible?
- —
Short-term bridge; refi at stabilization.
Listing history 12 events
-
2026-06-19days on market $425,000 Active 15 DOM
-
2026-06-18days on market $425,000 Active 14 DOM
-
2026-06-17days on market $425,000 Active 13 DOM
-
2026-06-16days on market $425,000 Active 12 DOM
-
2026-06-15days on market $425,000 Active 11 DOM
-
2026-06-14days on market $425,000 Active 9 DOM
-
2026-06-12days on market $425,000 Active 8 DOM
-
2026-06-09days on market $425,000 Active 5 DOM
-
2026-06-08days on market $425,000 Active 4 DOM
-
2026-06-07days on market $425,000 Active 3 DOM
-
2026-06-05remarks 421-char remark
-
2026-06-05$425,000 Active 1 DOM
ⓘ Source: listings_history table (triggers on properties + properties_extension) + one-shot
backfill from property_details.listing_events for pre-trigger history.
Tax reassessment forecast WA · Resets to sale price
- Current annual tax
- $2,924 · $244/mo
- Projected year-2 tax
- $4,165 · $347/mo
- Expected delta
- +$1,241/yr (+$103/mo · 42.4%)
ⓘ Screening estimate from a state-policy table — verify with the county assessor before closing.
Climate risk First Street
- Flood 1/10 Low FEMA zone X (unshaded) · 0% chance over 30 yrs
- Wildfire 1/10 Low
- Heat 1/10 Low 7 d/yr ≥72°F today · 17 d/yr by 30 yrs out
- Wind 1/10 Low
- Air quality 5/10 Major 6 unhealthy d/yr today · 6 by 30 yrs out
Nearby sold comps map
Loading sold comps map…
Walkable amenities ~0.75 mi
Loading nearby amenities…
Taxation est. · year 1
- Rental income
- $50,628
- − Mortgage interest
- −$23,807
- − Property taxes
- −$2,924
- − Insurance
- −$2,125
- − Repairs & maintenance
- −$4,050
- − Management
- −$4,050
- − Depreciation
- −$12,364
- Taxable income
- $1,308
- Est. tax owed @ 24.0%
- −$314
- After-tax cash flow
- $7,888/yr
For passive investors: Depreciation is non-cash, so a rental often shows a tax loss while cash-flowing — sheltering income. Rental losses are passive: they offset passive income freely, and up to $25,000/yr can offset ordinary (W-2) income if you actively participate and your MAGI is under $100k (phasing out to $0 by $150k); unused losses carry forward. On sale, claimed depreciation is recaptured at up to 25%, and gains may owe capital-gains tax (a 1031 exchange can defer both). Figures are a year-1 estimate at your 24.0% rate — not tax advice; consult a CPA.
Schools (NCES district)
- District
- North Beach School District
- NCES district ID
- 5305700
- Math proficiency
- 32% ▼ -4.00%
- Reading proficiency
- 44% ▬ 0.00%
- Median HH income
- $40,966
- Composite
- 34.46/100
- National rank
- #10153
- State rank
- #236 of 291 in WA
Livability — Ocean Shores
- Score
- 62/100
- State rank
- #424
- US rank
- #16852
Category grades
Schools grade is shown separately in the Schools card above.
Census & demographics
- Census place
- Ocean Shores, WA
- County
- Grays Harbor County · 44,693 people
- City population
- 7,187
- Metro
- Aberdeen, WA
- Population (ZIP)
- 7,489
- Household income
- $58,378
- Rent vs Own
- Severe rent burden
- 172.0
Population outlook (Grays Harbor County) Hauer SSP2
- Today (2025)
- 66,443 people
- By 2030
- 63,255 · -4.8%
- By 2040
- 56,466 · -15.0%
- By 2050
- 50,516 · -24.0%
- By 2075
- 39,296 · -40.9%
- By 2100
- 31,142 · -53.1%
Race, ethnicity, and origin ACS 2023
- Neighborhood character
- Predominantly White (86%)
- Race & ethnicity
- White 86% Two or more races 5% Hispanic / Latino 4% Asian 3% Native American 3%
- Common ancestry
- Portuguese 8% Iranian 5% Lithuanian 4%
- Foreign-born
- 5% · Canada
- Languages at home
- 92% English-only · Spanish 3% Tagalog/Filipino 2% German/W. Germanic 2%
Political lean MEDSL · Grays Harbor
- 2024 margin
- Lean R (+6.0) · D 45.6% · R 51.6% · Other 2.8%
- 2008→2024 swing
- -20.6pp toward R · 2008: 14.6pp · 2024: -6.0pp
- All cycles
- 2024: R+6.0 2020: R+6.6 2016: R+7.1 2012: D+14.0 2008: D+14.6
Not yet ingested
- Civics
- —
Market trends
- HPI YoY
- ▼ -13.33%
- Current HPI
- 380.05
- Rent YoY
- —
- Metro
- Aberdeen, WA
- State GDP YoY
- ▲ 4.65%
- F500 in state
- 22
Industry mix (Fortune 500 HQ in WA)
| Industry | F500 HQs | Revenue |
|---|---|---|
| Retail | 2 | $269B |
|
||
| Technology / Retail | 1 | $638B |
|
||
| Technology | 1 | $245B |
|
||
| Telecommunications | 1 | $38B |
|
||
| Food / Beverage | 1 | $36B |
|
||
| Automotive / Trucks | 1 | $34B |
|
||
Price history
+184.3% since first listed9 events — show timeline
- 2026-06-04 Listed $425,000 NWMLS as Distributed by MLS Grid
- 2020-12-28 Sold (MLS) $395,000 NWMLS as Distributed by MLS Grid
- 2020-11-20 Pending — NWMLS as Distributed by MLS Grid
- 2020-10-24 Price Changed $399,000 NWMLS as Distributed by MLS Grid
- 2020-09-26 Listed $439,000 NWMLS as Distributed by MLS Grid
- 2016-03-28 Sold (MLS) $131,250 NWMLS as Distributed by MLS Grid
- 2016-03-09 Pending — NWMLS as Distributed by MLS Grid
- 2016-02-27 Listed $135,000 NWMLS as Distributed by MLS Grid
- 1998-05-27 Sold (Public Records) $149,500 Public Records
Property tax history
+1.9%/yrLatest (2026): $2,924 · -1.5% YoY. Source: county tax records.
Cash-flow waterfall
monthlySold comps — $/sqft
last 12 mo · ≤1 miLoading sold comps…