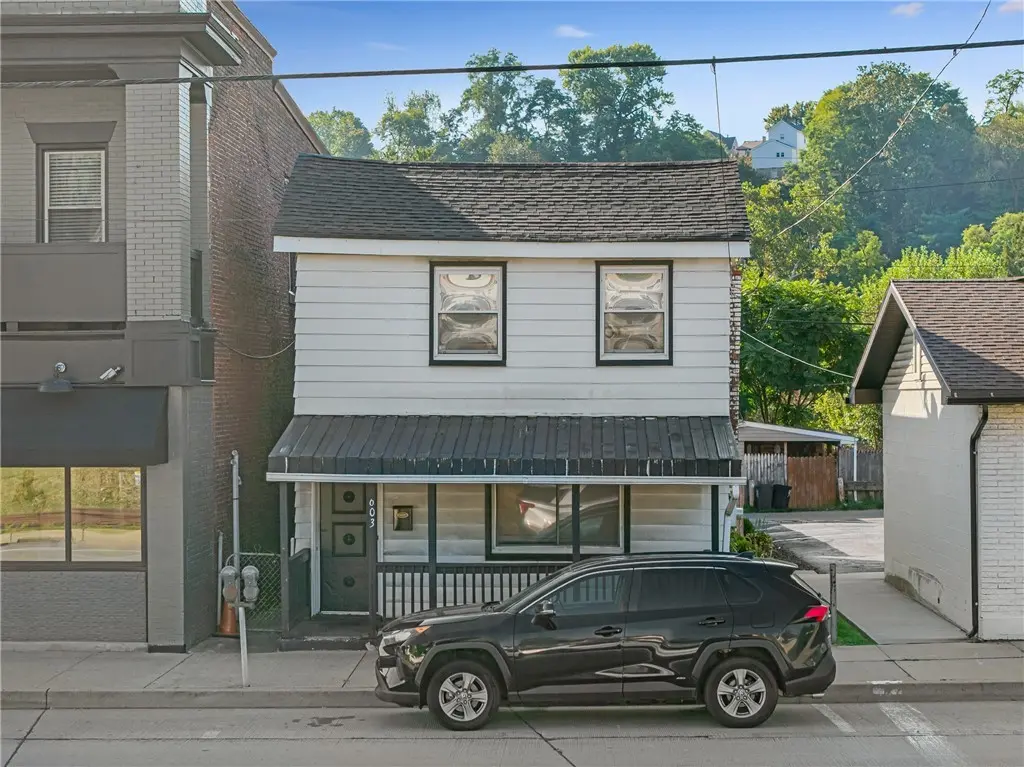
603 W Main St · Carnegie, PA
Flood risk 9/10 · Severe
- FEMA flood zone
- X (shaded)
- Chance of flooding over 30 yrs
- 0.99%
- Est. flood insurance / yr
- $473 – $860
Fire risk 1/10 · Minimal
- Est. fire insurance / yr
- $511 – $949
Heat risk 4/10 · Minor
- Hot days now (above 97°F)
- 7 days/yr
- Hot days in 30 yrs
- 18 days/yr
Wind risk 2/10 · Minimal
- Chance of severe wind over 30 yrs
- —
Air-quality risk 2/10 · Minimal
- Unhealthy air days now
- 0 days/yr
- Unhealthy air days in 30 yrs
- 3 days/yr
Risk factors via First Street. Map © Google.
Why this score? — see what drove the C+ grade
The composite is a weighted blend of 9 inputs, each scored 0–100. Each bar is that input's sub-score; the figure is the points it added to the 100-point composite (weight × sub-score).
- Cash flow +22.6/30.0
- ARV discount +15.0/15.0
- DSCR +7.3/10.0
- 1% rule +5.5/10.0
- Livability +4.3/5.0
- Rent growth +3.9/5.0
- Schools +3.4/10.0
- Condition / age +2.5/5.0
- Appreciation +0.0/10.0
$165,000
🖨 Deal sheet 📄 Offer letter ✓ Due diligence
Listing remarks MLS
This 4-bedroom, 1.5-bath home offers plenty of space and potential. Located in the heart of Carnegie, it’s just minutes from the business district, local shops, dining, public transportation, and major highways, giving you easy access to everything you need. Inside, you’ll find generously sized rooms, including a living area, dining room, eat-in kitchen, and a convenient half bath on the main floor. Upstairs, four bedrooms and a full bath provide the flexibility for family, guests, or home office space. This property can be a wonderful place to call home, an investment opportunity, or a versatile space to fit your lifestyle.
Key facts
- Living area
- Business district
- Local shops
Tags
Neighborhood map
What this means for you Summary
Snapshot
- This is a 3-bed/1.5-bath single-family listed at $165k.
Deal economics
- At list price, monthly cash flow is $226 ($3k/yr) — positive.
- The deal already cash-flows at list — no discount required.
- Meets the 1% rule at list price ($2k rent vs $165k).
- Recommended offer: $145k (12.0% below list) — sets the bar for market timing.
- Cap rate 8.3% vs local median 5.1% in Carnegie — top-decile yield for the area; either an underpriced asset or a hidden risk that comps aren't pricing in. Stress-test before assuming the spread holds.
Location & tenants
- Location reads 86/100 on livability (#55 in PA, #344 nationally) — a professional / high-income tenant draw. Strengths: crime A+, commute A+, cost of living A+; Watch: amenities D.
- Carlynton SD (suburban): math 29% / reading 52% proficiency, ranked #352 of 539 in PA (top 65%) — families likely to look elsewhere, expect single-tenant / working-renter base with shorter leases.
- Market conditions: Rents rising fast (+5.5%/yr); 67 active listings in the ZIP; 10 comparable units currently listed for rent nearby; rentals at typical pace (median 24d on market — plan ~3-4 weeks tenant-placement turnaround); solid renter incomes; 2,996 units permitted in Allegheny County in 2024 (1,588 in 5+ unit buildings).
Forward outlook
- Local home prices are declining (-3.0%/yr); year-one equity from $1k of loan paydown is wiped out by about $5k of value loss. Plan a longer hold.
Negotiation context
- It's been on market 273 days — a 12% lower offer ($145k) is reasonable based on typical stale-listing flexibility.
- Current owner paid $25k; list at $165k implies a 559% gain — meaningful room to come down on a strong offer.
Risks & watch-outs
- Watch-outs: flood insurance adds $56/mo; built in 1930 — expect roof / HVAC / electrical / plumbing capex.
- Climate carrying-cost: severe flood risk — expect insurance premiums to compound above CPI over the hold.
Questions for the listing agent
- It's been on market 273 days. Have you received any prior offers? Is the seller open to a 12% concession, seller financing, or rate buy-down credit?
- Built in 1930 — when were the roof, HVAC, electrical panel, plumbing, and water heater last replaced?
- What's the actual annual flood-insurance premium (NFIP or private), and is the property in a SFHA with mandatory coverage?
- Why hasn't it sold? Are there any deal-killer items the seller is aware of (foundation, flood, title, zoning, code violations)?
- Is there a deadline driving the sale (1031 exchange, divorce, estate, relocation)? That informs how much negotiation room exists.
- What's the average days-on-market for RENTAL listings here right now (not sales)? A rising rental-DOM trend means longer vacancies and softer asking-rent achievability than the comps imply.
- What's the recent tenant-quality profile in this submarket — average credit score on applications, eviction rate, late-payment / NSF rate, and stable-employment percentage? A property-management company in the area should have these aggregated.
- How much new for-sale + rental construction is in the pipeline within 1–3 miles? Heavy new supply typically softens prices + rents 12–24 months out; constrained supply supports both.
Investment metrics
- 1% rule
- 1.05% ✓
- Cap rate
- 8.34%
- Cash-on-cash
- 7.31%
- DSCR
- 1.33
- GRM
- 7.9
CMA / ARV
- ARV (median comp)
- $213,674
- List price
- $165,000
- Delta
- -22.78%
- Verdict
- UNDERPRICED
- Comps
- 20 within 1.0 mi
Show comp detail 12 sales within ~0.75 mi
| Address | Dist | Beds/Ba | Sqft | Sold | Price | $/sf | Match |
|---|---|---|---|---|---|---|---|
| 409 Cubbage St | 0.07mi | 3/2.0 | 1,772 (+10%) | 0mo | $225,000 | $127 | 78 |
| 311 Magazine St | 0.28mi | 2/1.0 (-1) | 1,620 (+1%) | 2mo | $61,700 | $38 | 77 |
| 709 Logan St | 0.07mi | 3/2.0 | 1,440 (-10%) | 2mo | $71,000 | $49 | 75 |
| 815 W Main St | 0.11mi | 2/1.5 (-1) | 1,494 (-7%) | 7mo | $147,500 | $99 | 72 |
| 323 Glenn Ave | 0.43mi | 3/1.5 | 1,657 (+3%) | 6mo | $113,000 | $68 | 70 |
| 431 Torrence Ave | 0.37mi | 3/1.5 | 1,497 (-7%) | 5mo | $260,000 | $174 | 67 |
| 319 Glenn Ave | 0.44mi | 4/2.0 (+1) | 1,536 (-4%) | 1mo | $225,000 | $146 | 65 |
| 115 Locust St | 0.42mi | 4/2.0 (+1) | 1,692 (+5%) | 1mo | $244,900 | $145 | 64 |
| 210 Marshall Ave | 0.53mi | 3/2.5 | 1,690 (+5%) | 3mo | $200,000 | $118 | 61 |
| 613 Doolittle Ave | 0.29mi | 4/2.0 (+1) | 1,788 (+11%) | 0mo | $190,000 | $106 | 60 |
| 810 Collier | 0.32mi | 3/2.0 | 1,368 (-15%) | 1mo | $225,000 | $164 | 58 |
| 519 Highland Ave | 0.44mi | 3/1.5 | 1,806 (+12%) | 4mo | $225,000 | $125 | 55 |
Match score weights: distance 35% · size 25% · config 20% · recency 20%. Top-matched comps best support the ARV.
Projected returns pro-forma
-3.0% appreciation · 5.45% rent growth · sell at horizon
- IRR
- -4.5%
- Equity multiple
- 0.83×
- Total profit
- $-7,958
- Equity at exit
- $24,602
- IRR
- 7.8%
- Equity multiple
- 1.66×
- Total profit
- $30,567
- Equity at exit
- $14,266
Cash invested: $46,200 (down + closing). Projections, not guarantees.
Landlord ↔ Tenant lean methodology
- Overall (STATE)
- 62 Landlord-Friendly
- State Pennsylvania
- 62 Landlord-Friendly · EVEN
- County
- — inherits STATE
- City
- — inherits STATE
ZIP-level market 15106
- Home prices YoY
- -31.9%
- Rents YoY
- 5.5%
- Active inventory
- 67
- Price-to-rent
- 7.9×
Monthly cashflow live
- Estimated rent
- $1,732 high interval (Pro) →
- Mortgage (P&I)
- −$865
- Tax from tax record
- −$153 /mo · $1,833/yr
- Insurance
- −$69
- Flood insurance flood zone
- −$56 /mo · $666/yr
- HOA
- −$0
- Vacancy / Maint / Mgmt
- −$364
- Net cashflow
- $226
Break-even live
UW: 25.0% down · 7.5% · 30yr · 1.5% tax · 5.0% vac · 8.0% maint · 8.0% mgmt
Financing live
Cash to close
- Down payment
- $41,250
- Closing costs
- $4,950
- Reserves months
- —
- Total cash needed
- —
Loan-product check · same deal, 3 products live
Conventional
25% down · 7.5% · 30yr
- Down + closing
- —
- Monthly P&I
- —
- Monthly cashflow
- —
- DSCR
- —
- Eligible?
- —
Personal DTI + credit; lowest rate.
DSCR
20% down · 8.5% · 30yr
- Down + closing
- —
- Monthly P&I
- —
- Monthly cashflow
- —
- DSCR
- —
- Eligible?
- —
No personal income docs; deal must DSCR.
Hard money
10% down · 12.0% · 12mo
- Down + closing
- —
- Monthly P&I
- —
- Monthly cashflow
- —
- DSCR
- —
- Eligible?
- —
Short-term bridge; refi at stabilization.
Rent comps 10 comps
| Address | Beds | Baths | Sqft | Rent | $/sqft | DOM | Units | Dist |
|---|---|---|---|---|---|---|---|---|
| 230 Magazine St Unit 2 Carnegie, PA | 2.0 | 1.0 | 1200 | $1,295 | $1.08 | 43d | 1 | 0.26mi |
| 312 Midland Ave Carnegie, PA | 3.0 | 1.0 | 1332 | $1,400 | $1.05 | 43d | 1 | 0.36mi |
| 525 Carothers Ave Ste 2 Carnegie, PA | 3.0 | 1.0 | 1600 | $1,000 | $0.62 | 23d | 1 | 0.38mi |
| 851 Kennedy St Carnegie, PA | 3.0 | 1.0 | 1100 | $1,800 | $1.64 | 23d | 1 | 0.42mi |
| 100 Branch St Carnegie, PA | 3.0 | 1.0 | 1606 | $1,590 | $0.99 | 23d | 1 | 0.52mi |
| 834 Washington Ave Carnegie, PA | 1.0–2.0 | 1.0–2.0 | 1026 | $1,638 | $1.60 | 2d | 11 | 0.55mi |
| 303 Lexington Ct Carnegie, PA | 2.0 | 1.0 | 1144 | $1,200 | $1.05 | 10d | 1 | 0.58mi |
| 356 Sunrise Dr Carnegie, PA | 3.0 | 2.5 | 1728 | $2,500 | $1.45 | 23d | 1 | 0.63mi |
| 312 Sunrise Dr Carnegie, PA | 3.0 | 2.5 | 2112 | $3,200 | $1.52 | 1d | 1 | 0.70mi |
| 1900 Tee Ct Presto, PA | 1.0–3.0 | 1.0–2.0 | 981 | $2,128 | $2.17 | 1d | 9 | 0.81mi |
Listing history 14 events
-
2026-06-13days on market $165,000 Active 273 DOM
-
2026-06-09days on market $165,000 Active 269 DOM
-
2026-06-08days on market $165,000 Active 268 DOM
-
2026-06-07days on market $165,000 Active 267 DOM
-
2026-06-05days on market $165,000 Active 264 DOM
-
2026-06-03days on market $165,000 Active 263 DOM
-
2026-06-02days on market $165,000 Active 262 DOM
-
2026-06-01days on market $165,000 Active 261 DOM
-
2026-05-31days on market $165,000 Active 260 DOM
-
2026-02-21price $165,000 644-char remark
Show marketing remark (644 chars)
This 4-bedroom, 1.5-bath home offers plenty of space and potential. Located in the heart of Carnegie, it’s just minutes from the business district, local shops, dining, public transportation, and major highways, giving you easy access to everything you need. Inside, you’ll find generously sized rooms, including a living area, dining room, eat-in kitchen, and a convenient half bath on the main floor. Upstairs, four bedrooms and a full bath provide the flexibility for family, guests, or home office space. This property can be a wonderful place to call home, an investment opportunity, or a versatile space to fit your lifestyle.
-
2025-09-13$175,000 Active 644-char remark
Show marketing remark (644 chars)
This 4-bedroom, 1.5-bath home offers plenty of space and potential. Located in the heart of Carnegie, it’s just minutes from the business district, local shops, dining, public transportation, and major highways, giving you easy access to everything you need. Inside, you’ll find generously sized rooms, including a living area, dining room, eat-in kitchen, and a convenient half bath on the main floor. Upstairs, four bedrooms and a full bath provide the flexibility for family, guests, or home office space. This property can be a wonderful place to call home, an investment opportunity, or a versatile space to fit your lifestyle.
-
2022-06-03price $1,375
-
2004-03-22soldstatus $25,050
-
1978-08-23soldstatus $30,000
ⓘ Source: listings_history table (triggers on properties + properties_extension) + one-shot
backfill from property_details.listing_events for pre-trigger history.
Tax reassessment forecast PA · Partial reset (capped growth)
- Current annual tax
- $1,833 · $153/mo
- Projected year-2 tax
- $2,220 · $185/mo
- Expected delta
- +$387/yr (+$32/mo · 21.1%)
ⓘ Screening estimate from a state-policy table — verify with the county assessor before closing.
Climate risk First Street
- Flood 9/10 Extreme FEMA zone X (shaded) · 99% chance over 30 yrs
- Wildfire 1/10 Low
- Heat 4/10 Moderate 7 d/yr ≥97°F today · 18 d/yr by 30 yrs out
- Wind 2/10 Low
- Air quality 2/10 Low 0 unhealthy d/yr today · 3 by 30 yrs out
Nearby sold comps map
Loading sold comps map…
Walkable amenities ~0.75 mi
Loading nearby amenities…
Taxation est. · year 1
- Rental income
- $20,781
- − Mortgage interest
- −$9,243
- − Property taxes
- −$1,833
- − Insurance
- −$1,492
- − Repairs & maintenance
- −$1,662
- − Management
- −$1,662
- − Depreciation
- −$4,800
- Taxable income
- $89
- Est. tax owed @ 24.0%
- −$21
- After-tax cash flow
- $2,688/yr
For passive investors: Depreciation is non-cash, so a rental often shows a tax loss while cash-flowing — sheltering income. Rental losses are passive: they offset passive income freely, and up to $25,000/yr can offset ordinary (W-2) income if you actively participate and your MAGI is under $100k (phasing out to $0 by $150k); unused losses carry forward. On sale, claimed depreciation is recaptured at up to 25%, and gains may owe capital-gains tax (a 1031 exchange can defer both). Figures are a year-1 estimate at your 24.0% rate — not tax advice; consult a CPA.
Schools (NCES district)
- District
- Carlynton SD
- NCES district ID
- 4205040
- Math proficiency
- 29% ▼ -15.00%
- Reading proficiency
- 52% ▼ -11.00%
- Median HH income
- $46,249
- Composite
- 34.46/100
- National rank
- #5192
- State rank
- #352 of 539 in PA
Livability — Carnegie
- Score
- 86/100
- State rank
- #55
- US rank
- #344
Category grades
Schools grade is shown separately in the Schools card above.
Census & demographics
- Census place
- Carnegie, PA
- County
- Allegheny County · 1,022,028 people
- City population
- 19,244
- Metro
- Pittsburgh, PA
- Population (ZIP)
- 19,244
- Household income
- $77,247
- Rent vs Own
- Severe rent burden
- 410.0
Population outlook (Allegheny County) Hauer SSP2
- Today (2025)
- 1,250,282 people
- By 2030
- 1,256,482 · +0.5%
- By 2040
- 1,256,318 · +0.5%
- By 2050
- 1,244,169 · -0.5%
- By 2075
- 1,197,693 · -4.2%
- By 2100
- 1,093,187 · -12.6%
Race, ethnicity, and origin ACS 2023
- Neighborhood character
- Predominantly White (82%)
- Race & ethnicity
- White 82% Black 8% Two or more races 6% Asian 2% Hispanic / Latino 2%
- Common ancestry
- Romanian 11% Lithuanian 2% Subsaharan African 2%
- Foreign-born
- 5%
- Languages at home
- 94% English-only · Other Indo-European 2% Arabic 1% Russian/Polish/Slavic 1%
Political lean MEDSL · Allegheny
- 2024 margin
- Strong D (+20.3) · D 59.7% · R 39.4%
- 2008→2024 swing
- +4.8pp toward D · 2008: 15.5pp · 2024: 20.3pp
- All cycles
- 2024: D+20.3 2020: D+20.4 2016: D+16.4 2012: D+14.4 2008: D+15.5
Not yet ingested
- Civics
- —
Market trends
- HPI YoY
- ▼ -119.52%
- Current HPI
- 255.0295
- Rent YoY
- ▲ 5.45%
- Metro
- Pittsburgh, PA
- State GDP YoY
- ▲ 1.68%
- F500 in state
- 34
Industry mix (Fortune 500 HQ in PA)
| Industry | F500 HQs | Revenue |
|---|---|---|
| Healthcare | 2 | $309B |
|
||
| Insurance | 2 | $27B |
|
||
| Telecommunications / Media | 1 | $124B |
|
||
| Industrial Distribution | 1 | $22B |
|
||
| Financial Services | 1 | $20B |
|
||
| Chemicals / Materials | 1 | $18B |
|
||
Price history
+450.0% since first listed5 events — show timeline
- 2026-02-21 Price Changed $165,000 West Penn MLS
- 2025-09-13 Listed $175,000 West Penn MLS
- 2022-06-03 Price Changed $1,375 RENT.
- 2004-03-22 Sold (Public Records) $25,050 Public Records
- 1978-08-23 Sold (Public Records) $30,000 Public Records
Property tax history
+3.1%/yrLatest (2026): $1,833 · +1.2% YoY. Source: county tax records.
Cash-flow waterfall
monthlySold comps — $/sqft
last 12 mo · ≤1 miLoading sold comps…