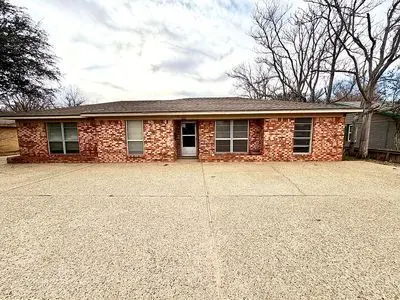
1803 N Garfield St · Midland, TX
Flood risk 1/10 · Minimal
- FEMA flood zone
- —
- Chance of flooding over 30 yrs
- 0.0%
- Est. flood insurance / yr
- —
Fire risk 3/10 · Minor
- Est. fire insurance / yr
- $1,222 – $2,270
Heat risk 6/10 · Moderate
- Hot days now (above 102°F)
- 7 days/yr
- Hot days in 30 yrs
- 20 days/yr
Wind risk 2/10 · Minimal
- Chance of severe wind over 30 yrs
- 3.0%
Air-quality risk 1/10 · Minimal
- Unhealthy air days now
- 0 days/yr
- Unhealthy air days in 30 yrs
- 0 days/yr
Risk factors via First Street. Map © Google.
Why this score? — see what drove the C grade
The composite is a weighted blend of 9 inputs, each scored 0–100. Each bar is that input's sub-score; the figure is the points it added to the 100-point composite (weight × sub-score).
- Cash flow +20.3/30.0
- ARV discount +15.0/15.0
- DSCR +6.5/10.0
- 1% rule +5.3/10.0
- Livability +4.0/5.0
- Schools +3.2/10.0
- Rent growth +3.1/5.0
- Condition / age +2.5/5.0
- Appreciation +0.0/10.0
$250,000
🖨 Deal sheet 📄 Offer letter ✓ Due diligence
Listing remarks MLS
IDEAL HOME FOR BUYER LOOKING FOR LOW MAINTENANCE HOME W/ NEW PAINT & CARPET. THERE ARE 2LAS - ON IS GREAT FOR HOME OFFICE, CIRCLE DRIVE, OVER 2200 SQ FT, VACANT, EASY TO SHOW. SELLER READY TO SELL!
Key facts
- Built 1982
Neighborhood map
What this means for you Summary
Snapshot
- This is a 3-bed/2.0-bath single-family listed at $250k.
Deal economics
- At list price, monthly cash flow is $322 ($4k/yr) — positive.
- The deal already cash-flows at list — no discount required.
- Meets the 1% rule at list price ($3k rent vs $250k).
- Cap rate 7.8% vs local median 4.7% in Midland — top-decile yield for the area; either an underpriced asset or a hidden risk that comps aren't pricing in. Stress-test before assuming the spread holds.
Location & tenants
- Location reads 79/100 on livability (#57 in TX, #2,192 nationally) — a middle-class / working-renter tenant base. Strengths: employment A+, housing A+, health & safety A+; Watch: schools C-, crime C-, commute D+.
- Midland ISD (urban): math 34% / reading 36% proficiency, ranked #477 of 826 in TX (top 58%) — families likely to look elsewhere, expect single-tenant / working-renter base with shorter leases.
- Market conditions: Rents rising (+2.6%/yr); 452 active listings in the ZIP; 31 comparable units currently listed for rent nearby; rentals lingering (median 44d on market — plan ~5-8 weeks vacancy on turnover, expect pricing pressure); 58% of comp listings sitting > 30 days — soft ceiling on asking rent; solid renter incomes; 1,504 units permitted in Midland County in 2024 (0 in 5+ unit buildings).
Forward outlook
- Local home prices are declining (-3.0%/yr); year-one equity from $2k of loan paydown is wiped out by about $8k of value loss. Plan a longer hold.
- Midland County population projected at +83% by 2050 — long-run rental-demand tailwind backs the buy-and-hold thesis.
Negotiation context
- Only 0 days on market — expect competitive offers; lowballing is unlikely to land.
- 2 sale attempts since 26y ago with the ask held roughly flat each time — persistent listings suggest the price (not the market) is what's stuck; bring a comps-based counter.
Risks & watch-outs
- Climate carrying-cost: extreme-heat days projected 7→20/yr by 2055 (HVAC capex compounding) — expect insurance premiums to compound above CPI over the hold.
Questions for the listing agent
- Is there a deadline driving the sale (1031 exchange, divorce, estate, relocation)? That informs how much negotiation room exists.
- What's the average days-on-market for RENTAL listings here right now (not sales)? A rising rental-DOM trend means longer vacancies and softer asking-rent achievability than the comps imply.
- What's the recent tenant-quality profile in this submarket — average credit score on applications, eviction rate, late-payment / NSF rate, and stable-employment percentage? A property-management company in the area should have these aggregated.
- How much new for-sale + rental construction is in the pipeline within 1–3 miles? Heavy new supply typically softens prices + rents 12–24 months out; constrained supply supports both.
Investment metrics
- 1% rule
- 1.03% ✓
- Cap rate
- 7.84%
- Cash-on-cash
- 5.53%
- DSCR
- 1.25
- GRM
- 8.1
CMA / ARV
- ARV (on-the-fly)
- $371,508
- Comps found
- 2
Show comp detail 2 sales within ~0.75 mi
| Address | Dist | Beds/Ba | Sqft | Sold | Price | $/sf | Match |
|---|---|---|---|---|---|---|---|
| 2208 W Golf Course Rd | 0.09mi | 3/2.0 | 2,106 (-6%) | 17mo | $350,000 | $166 | 72 |
| 1806 N H St | 0.54mi | 4/3.0 (+1) | 2,464 (+10%) | 18mo | $395,000 | $160 | 34 |
Match score weights: distance 35% · size 25% · config 20% · recency 20%. Top-matched comps best support the ARV.
Projected returns pro-forma
-3.0% appreciation · 2.56% rent growth · sell at horizon
- IRR
- -8.2%
- Equity multiple
- 0.70×
- Total profit
- $-21,087
- Equity at exit
- $37,276
- IRR
- 0.7%
- Equity multiple
- 1.05×
- Total profit
- $3,577
- Equity at exit
- $21,615
Cash invested: $70,000 (down + closing). Projections, not guarantees.
Landlord ↔ Tenant lean methodology
- Overall (STATE)
- 87 Strongly Landlord-Friendly
- State Texas
- 87 Strongly Landlord-Friendly · R+5
- County
- — inherits STATE
- City
- — inherits STATE
ZIP-level market 79705
- Rents YoY
- 2.6%
- Active inventory
- 452
- Price-to-rent
- 8.1×
Monthly cashflow live
- Estimated rent
- $2,587 high interval (Pro) →
- Mortgage (P&I)
- −$1,311
- Tax from tax record
- −$306 /mo · $3,673/yr
- Insurance
- −$104
- HOA
- −$0
- Vacancy / Maint / Mgmt
- −$543
- Net cashflow
- $322
Break-even live
UW: 25.0% down · 7.5% · 30yr · 1.5% tax · 5.0% vac · 8.0% maint · 8.0% mgmt
Financing live
Cash to close
- Down payment
- $62,500
- Closing costs
- $7,500
- Reserves months
- —
- Total cash needed
- —
Loan-product check · same deal, 3 products live
Conventional
25% down · 7.5% · 30yr
- Down + closing
- —
- Monthly P&I
- —
- Monthly cashflow
- —
- DSCR
- —
- Eligible?
- —
Personal DTI + credit; lowest rate.
DSCR
20% down · 8.5% · 30yr
- Down + closing
- —
- Monthly P&I
- —
- Monthly cashflow
- —
- DSCR
- —
- Eligible?
- —
No personal income docs; deal must DSCR.
Hard money
10% down · 12.0% · 12mo
- Down + closing
- —
- Monthly P&I
- —
- Monthly cashflow
- —
- DSCR
- —
- Eligible?
- —
Short-term bridge; refi at stabilization.
Rent comps 31 comps
| Address | Beds | Baths | Sqft | Rent | $/sqft | DOM | Units | Dist |
|---|---|---|---|---|---|---|---|---|
| 2204 Boyd Ave Midland, TX | 3.0 | 2.0 | 2068 | $3,000 | $1.45 | 43d | 1 | 0.13mi |
| 1603 N L St Midland, TX | 4.0 | 3.0 | 2230 | $3,200 | $1.43 | 43d | 1 | 0.34mi |
| 1902 N I St Midland, TX | 3.0 | 2.5 | 2178 | $2,400 | $1.10 | 43d | 1 | 0.51mi |
| 2601 Bedford Dr Midland, TX | 3.0 | 2.0 | 2108 | $2,200 | $1.04 | 13d | 1 | 0.62mi |
| 1305 Lawson Ave Midland, TX | 3.0 | 2.0 | 2065 | $2,450 | $1.19 | 43d | 1 | 0.67mi |
| 2218 N H St Midland, TX | 2.0 | 3.0 | 2272 | $3,500 | $1.54 | 43d | 1 | 0.69mi |
| 1511 Bedford Dr Midland, TX | 3.0 | 2.0 | 1732 | $2,500 | $1.44 | 43d | 1 | 0.73mi |
| 2406 W Louisiana Ave Midland, TX | 2.0 | 1.5 | 1620 | $2,500 | $1.54 | 43d | 1 | 0.84mi |
| 3114 Shell Ave Midland, TX | 4.0 | 2.0 | 2260 | $2,999 | $1.33 | 21d | 1 | 0.85mi |
| 1413 Ventura Ave Midland, TX | 3.0 | 2.0 | 2400 | $2,895 | $1.21 | 43d | 1 | 0.89mi |
| 2603 W Wadley Ave Midland, TX | 3.0 | 2.0 | 1600 | $1,900 | $1.19 | 21d | 1 | 0.94mi |
| 2100 W Wadley Ave Unit L1 Midland, TX | 3.0 | 3.0 | 1854 | $2,300 | $1.24 | 43d | 1 | 0.96mi |
| 2928 W Louisiana Ave Unit 213 Midland, TX | 3.0 | 2.0 | 1450 | $1,400 | $0.97 | 43d | 1 | 0.97mi |
| 11 Marchelle Ct Midland, TX | 4.0 | 2.0 | 2714 | $3,200 | $1.18 | 43d | 1 | 1.00mi |
| 806 Neely Ave Midland, TX | 3.0 | 3.5 | 2767 | $3,900 | $1.41 | 43d | 1 | 1.08mi |
| 3302 Fannin Ave Midland, TX | 3.0 | 2.0 | 1533 | $2,000 | $1.30 | 21d | 1 | 1.13mi |
| 1513 Club Dr Midland, TX | 2.0 | 2.0 | 1502 | $2,300 | $1.53 | 21d | 1 | 1.13mi |
| 3209 W Wadley Ave Unit A Midland, TX | 3.0 | 2.0 | 1512 | $2,500 | $1.65 | 43d | 1 | 1.17mi |
| 1002 W Louisiana Ave Midland, TX | 2.0 | 1.5 | 1472 | $2,500 | $1.70 | 43d | 1 | 1.20mi |
| 3326 W Dengar Ave Midland, TX | 4.0 | 3.0 | 2000 | $2,500 | $1.25 | 21d | 1 | 1.29mi |
| 711 W Dormard Ave Midland, TX | 3.0 | 2.0 | 1427 | $2,150 | $1.51 | 43d | 1 | 1.35mi |
| 3401 Storey Ave Midland, TX | 3.0 | 2.0 | 1531 | $2,200 | $1.44 | 43d | 1 | 1.35mi |
| 3401 Storey Ave Midland, TX | 3.0 | 2.0 | 1531 | $2,200 | $1.44 | 21d | 1 | 1.35mi |
| 3105 Barkley Ave Midland, TX | 4.0 | 2.0 | 1730 | $2,350 | $1.36 | 13d | 1 | 1.38mi |
| 2602 N Pecos St Unit B Midland, TX | 2.0 | 2.0 | 1663 | $2,300 | $1.38 | 13d | 1 | 1.39mi |
| 3300 Durant Dr Midland, TX | 4.0 | 3.5 | 2982 | $3,650 | $1.22 | 13d | 1 | 1.40mi |
| 3300 Durant Dr Midland, TX | 3.0 | 3.5 | 2982 | $4,400 | $1.48 | 43d | 1 | 1.40mi |
| 2800 N Pecos St Unit B Midland, TX | 3.0 | 2.5 | 2148 | $2,100 | $0.98 | 21d | 1 | 1.43mi |
| 2800 N Pecos St Midland, TX | 3.0 | 3.0 | 2148 | $2,100 | $0.98 | 21d | 1 | 1.43mi |
| 2812 Mariana Ave Midland, TX | 3.0 | 1.5 | 1443 | $1,750 | $1.21 | 43d | 1 | 1.44mi |
| 2615 Haynes Ave Unit B Midland, TX | 3.0 | 2.0 | 1635 | $1,950 | $1.19 | 13d | 1 | 1.45mi |
Listing history 2 events
-
2026-06-10remarks 355-char remark
-
2026-06-10$250,000 Under Contract
ⓘ Source: listings_history table (triggers on properties + properties_extension) + one-shot
backfill from property_details.listing_events for pre-trigger history.
Tax reassessment forecast TX · Resets to sale price
- Current annual tax
- $3,673 · $306/mo
- Projected year-2 tax
- $4,575 · $381/mo
- Expected delta
- +$902/yr (+$75/mo · 24.6%)
ⓘ Screening estimate from a state-policy table — verify with the county assessor before closing.
Climate risk First Street
- Flood 1/10 Low 0% chance over 30 yrs
- Wildfire 3/10 Moderate
- Heat 6/10 Major 7 d/yr ≥102°F today · 20 d/yr by 30 yrs out
- Wind 2/10 Low 3% chance of damaging wind over 30 yrs
- Air quality 1/10 Low 0 unhealthy d/yr today · 0 by 30 yrs out
Nearby sold comps map
Loading sold comps map…
Walkable amenities ~0.75 mi
Loading nearby amenities…
Taxation est. · year 1
- Rental income
- $31,042
- − Mortgage interest
- −$14,004
- − Property taxes
- −$3,673
- − Insurance
- −$1,250
- − Repairs & maintenance
- −$2,483
- − Management
- −$2,483
- − Depreciation
- −$7,273
- Taxable loss
- −$124
- Est. tax savings @ 24.0%
- +$30
- After-tax cash flow
- $3,898/yr
For passive investors: Depreciation is non-cash, so a rental often shows a tax loss while cash-flowing — sheltering income. Rental losses are passive: they offset passive income freely, and up to $25,000/yr can offset ordinary (W-2) income if you actively participate and your MAGI is under $100k (phasing out to $0 by $150k); unused losses carry forward. On sale, claimed depreciation is recaptured at up to 25%, and gains may owe capital-gains tax (a 1031 exchange can defer both). Figures are a year-1 estimate at your 24.0% rate — not tax advice; consult a CPA.
Schools (NCES district)
- District
- Midland ISD
- NCES district ID
- 4830570
- Math proficiency
- 34% ▼ -7.00%
- Reading proficiency
- 36% ▬ 0.00%
- Median HH income
- $63,457
- Composite
- 31.63/100
- National rank
- #5938
- State rank
- #477 of 826 in TX
Livability — Midland
- Score
- 79/100
- State rank
- #57
- US rank
- #2192
Category grades
Schools grade is shown separately in the Schools card above.
Census & demographics
- Census place
- Midland, TX
- County
- Midland County · 168,494 people
- City population
- 168,494
- Metro
- Midland, TX
- Population (ZIP)
- 46,653
- Household income
- $105,310
- Rent vs Own
- Severe rent burden
- 1557.0
Population outlook (Midland County) Hauer SSP2
- Today (2025)
- 220,895 people
- By 2030
- 253,667 · +14.8%
- By 2040
- 325,498 · +47.4%
- By 2050
- 404,168 · +83.0%
- By 2075
- 609,802 · +176.1%
- By 2100
- 760,172 · +244.1%
Race, ethnicity, and origin ACS 2023
- Neighborhood character
- Diverse neighborhood (Simpson 0.60)
- Race & ethnicity
- White 46% Hispanic / Latino 43% Two or more races 20% Black 8%
- Hispanic origin (detail)
- Mexican 35%
- Common ancestry
- Slovak 1% Lithuanian 1% Serbian 1%
- Foreign-born
- 10% · Canada, Jamaica
- Languages at home
- 72% English-only · Spanish 24% Arabic 1%
Political lean MEDSL · Midland
- 2024 margin
- Solid R (+60.5) · D 19.3% · R 79.8%
- 2008→2024 swing
- -3.3pp toward R · 2008: -57.3pp · 2024: -60.5pp
- All cycles
- 2024: R+60.5 2020: R+56.6 2016: R+55.2 2012: R+61.5 2008: R+57.3
Not yet ingested
- Civics
- —
Market trends
- HPI YoY
- ▼ -300.44%
- Current HPI
- 207.2904
- Rent YoY
- ▲ 2.56%
- Metro
- Midland, TX
- State GDP YoY
- ▲ 3.95%
- F500 in state
- 110
Industry mix (Fortune 500 HQ in TX)
| Industry | F500 HQs | Revenue |
|---|---|---|
| Energy | 16 | $1,198B |
|
||
| Technology | 5 | $198B |
|
||
| Engineering / Construction | 4 | $72B |
|
||
| Energy Services | 3 | $60B |
|
||
| Utilities | 3 | $41B |
|
||
| Healthcare | 2 | $330B |
|
||
Price history
+226.8% since first listed6 events — show timeline
- 2026-06-09 Listed $250,000 FSBO.com
- 2026-04-20 Sold (Public Records) — Public Records
- 2006-03-08 Sold (Public Records) — Public Records
- 2000-07-11 Sold (Public Records) — Public Records
- 2000-07-05 Sold (MLS) — ODMLS
- 2000-03-07 Listed $76,500 ODMLS
Property tax history
+2.7%/yrLatest (2025): $3,673 · +6.2% YoY. Source: county tax records.
Cash-flow waterfall
monthlySold comps — $/sqft
last 12 mo · ≤1 miLoading sold comps…