 5-Plex
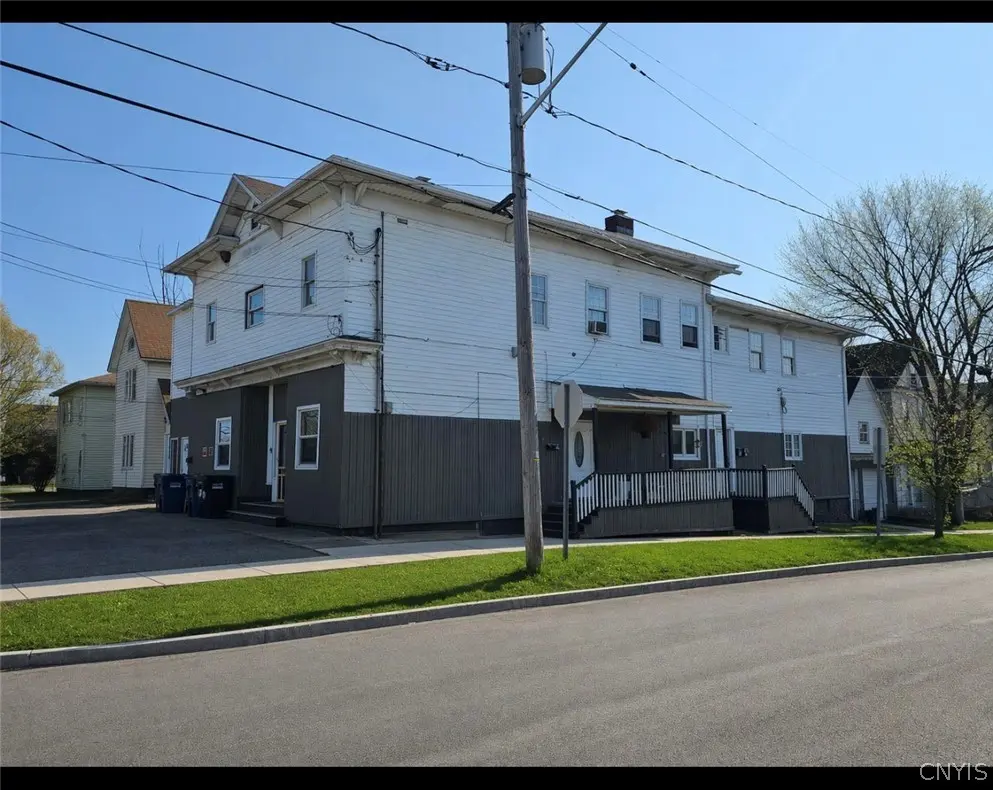
600 Pond St · Syracuse, NY
Flood risk 1/10 · Minimal
- FEMA flood zone
- X (unshaded)
- Chance of flooding over 30 yrs
- 0.0%
- Est. flood insurance / yr
- $473 – $860
Fire risk 1/10 · Minimal
- Est. fire insurance / yr
- $691 – $1,283
Heat risk 3/10 · Minor
- Hot days now (above 95°F)
- 7 days/yr
- Hot days in 30 yrs
- 16 days/yr
Wind risk 1/10 · Minimal
- Chance of severe wind over 30 yrs
- —
Air-quality risk 2/10 · Minimal
- Unhealthy air days now
- 0 days/yr
- Unhealthy air days in 30 yrs
- 1 days/yr
Risk factors via First Street. Map © Google.
Why this score? — see what drove the A- grade
The composite is a weighted blend of 9 inputs, each scored 0–100. Each bar is that input's sub-score; the figure is the points it added to the 100-point composite (weight × sub-score).
- Cash flow +30.0/30.0
- ARV discount +11.0/15.0
- 1% rule +10.0/10.0
- DSCR +10.0/10.0
- Appreciation +10.0/10.0
- Livability +3.9/5.0
- Condition / age +2.8/5.0
- Rent growth +2.5/5.0
- Schools +1.8/10.0
$382,500
🖨 Deal sheet 📄 Offer letter ✓ Due diligence
Multi-family units
County records classify this as Multi-Family (5+ Unit). Listing-text estimate: 5 units. confirmed
5+ unit building — per-unit beds/baths from public records are typically unavailable; the breakdown below (if shown) is an estimate from the listing text.
Listing remarks MLS
Spacious and maintained 5-unit property located on the desirable Northside of the city. All units are generously sized and have been updated within the past six years, offering modernized living spaces for tenants. The building is currently fully rented on a month-to-month basis, providing flexibility for future rent adjustments or occupancy changes. A standout feature is the large owner’s unit, which presents significant additional income potential if added to the rent roll. Alternatively, an owner-occupant can live on-site while rental income helps offset expenses. This property offers strong income potential and flexibility—ideal for both investors and owner-occupants. "SOLD AS IS "
Key facts
- Fully rented
- 5 unit property
- Large owners unit
Tags
Neighborhood map
What this means for you Summary
Snapshot
- This is a 4×2bd/1ba + 1×3bd/1ba units multifamily listed at $382k. Condition is rated average.
Deal economics
- At list price, monthly cash flow is $4k ($46k/yr) — positive. Per door: $772/mo.
- The deal already cash-flows at list — no discount required.
- Meets the 1% rule at list price ($8k rent vs $382k).
- Recommended offer: $371k (3.0% below list) — sets the bar for market timing.
- Cap rate 18.4% vs local median 8.2% in Syracuse — top-decile yield for the area; either an underpriced asset or a hidden risk that comps aren't pricing in. Stress-test before assuming the spread holds.
Location & tenants
- Location reads 77/100 on livability (#187 in NY, #2,869 nationally) — a middle-class / working-renter tenant base. Strengths: amenities A+, commute A+, cost of living A+; Watch: schools D+, crime F, employment D-.
- Syracuse City School District (urban): math 18% / reading 26% proficiency, ranked #590 of 590 in NY (top 100%) — low school quality limits family demand, transient renter base, plan for 1-2y turnover; 74% free/reduced lunch — lower-income household profile, screen leases tightly.
- Market conditions: 99 active listings in the ZIP; lower-income renter base — watch delinquency; 616 units permitted in Onondaga County in 2024 (256 in 5+ unit buildings).
- At $8,230/mo this rent would consume 221% of the median local household income ($45k/yr) (locally 1437% of renters already pay >50% of income on rent) — very limited rent-growth headroom before tenants either downsize or default.
Forward outlook
- In year one you build about $41k of equity ($3k loan paydown + $38k appreciation (10.0% local appreciation)).
- Onondaga County population projected to shrink 9% by 2050 — rents likely to lag national; underwrite the cash flow, not the appreciation.
- At projected returns (10.0% appreciation + 3.0% rent growth), your $107k cash investment doubles in ~2 years — after that, you're playing with house money.
- By year 2, paydown + projected appreciation supports a ~$66k cash-out refi (75% LTV) — recoverable capital for the next deal without selling this one.
Negotiation context
- It's been on market 43 days — a 3% lower offer ($371k) is reasonable based on typical stale-listing flexibility.
Risks & watch-outs
- Watch-outs: built in 1940 — expect roof / HVAC / electrical / plumbing capex.
Questions for the listing agent
- It's been on market 43 days. Have you received any prior offers? Is the seller open to a 3% concession, seller financing, or rate buy-down credit?
- Can we see the unit-by-unit rent roll, current vacancy, and any below-market leases? What's the average tenancy length?
- What capital expenditures (roof, boiler, parking lot, exteriors) have been made in the last 5 years, and what's planned in the next 2?
- Built in 1940 — when were the roof, HVAC, electrical panel, plumbing, and water heater last replaced?
- Is there a deadline driving the sale (1031 exchange, divorce, estate, relocation)? That informs how much negotiation room exists.
- Schools are D-rated, which usually means shorter tenancies and higher turnover. Who's the typical renter profile here, and what's been the actual vacancy rate?
- Crime grade is F in this area — have there been break-ins, vandalism, or insurance claims at this property in the last 3 years? What carrier currently insures it and at what premium?
- What's the average days-on-market for RENTAL listings here right now (not sales)? A rising rental-DOM trend means longer vacancies and softer asking-rent achievability than the comps imply.
- What's the recent tenant-quality profile in this submarket — average credit score on applications, eviction rate, late-payment / NSF rate, and stable-employment percentage? A property-management company in the area should have these aggregated.
- How much new apartment / multifamily construction is in the pipeline within 1–3 miles? Heavy new supply (>2% of stock underway) typically softens rents 12–24 months out; light construction supports rent growth.
Investment metrics
- 1% rule
- 2.15% ✓
- Cap rate
- 18.40%
- Cash-on-cash
- 43.23%
- DSCR
- 2.92
- GRM
- 3.9
CMA / ARV
- ARV (median comp)
- $414,691
- List price
- $382,500
- Delta
- -7.76%
- Verdict
- FAIR
- Comps
- 20 within 1.0 mi
Projected returns pro-forma
10.0% appreciation · 3.0% rent growth · sell at horizon
- IRR
- 57.9%
- Equity multiple
- 5.24×
- Total profit
- $454,183
- Equity at exit
- $344,586
- IRR
- 51.4%
- Equity multiple
- 11.69×
- Total profit
- $1,144,493
- Equity at exit
- $743,113
Cash invested: $107,100 (down + closing). Projections, not guarantees.
Landlord ↔ Tenant lean methodology
- Overall (STATE)
- 15 Strongly Tenant-Friendly
- State New York
- 15 Strongly Tenant-Friendly · D+10
- County
- — inherits STATE
- City
- — inherits STATE
ZIP-level market 13208
- Home prices YoY
- 8.4%
- Active inventory
- 99
- Price-to-rent
- 19.5×
Monthly cashflow live
- Estimated rent
- $8,230 high interval (Pro) →
- Mortgage (P&I)
- −$2,006
- Tax est. 1.5%
- −$478 /mo · $5,738/yr
- Insurance
- −$159
- HOA
- −$0
- Vacancy / Maint / Mgmt
- −$1,728
- Net cashflow
- $3,858
Break-even live
5-unit breakdown (identical units grouped — click to expand)
| Units | Beds | Baths | Est. rent |
|---|---|---|---|
| 4× units | 2 | 1 | $6,528 |
| #1 | 2 | 1 | $1,632 |
| #2 | 2 | 1 | $1,632 |
| #3 | 2 | 1 | $1,632 |
| #4 | 2 | 1 | $1,632 |
| 1× unit | 3 | 1 | $1,703 |
| Total (5 units) | $8,230 | ||
UW: 25.0% down · 7.5% · 30yr · 1.5% tax · 5.0% vac · 8.0% maint · 8.0% mgmt
Financing live
Cash to close
- Down payment
- $95,625
- Closing costs
- $11,475
- Reserves months
- —
- Total cash needed
- —
Loan-product check · same deal, 3 products live
Conventional
25% down · 7.5% · 30yr
- Down + closing
- —
- Monthly P&I
- —
- Monthly cashflow
- —
- DSCR
- —
- Eligible?
- —
Personal DTI + credit; lowest rate.
DSCR
20% down · 8.5% · 30yr
- Down + closing
- —
- Monthly P&I
- —
- Monthly cashflow
- —
- DSCR
- —
- Eligible?
- —
No personal income docs; deal must DSCR.
Hard money
10% down · 12.0% · 12mo
- Down + closing
- —
- Monthly P&I
- —
- Monthly cashflow
- —
- DSCR
- —
- Eligible?
- —
Short-term bridge; refi at stabilization.
Listing history 6 events
-
2026-06-05statusdays on market $382,500 Pending 43 DOM
-
2026-06-02days on market $382,500 Active 41 DOM
-
2026-06-01days on market $382,500 Active 40 DOM
-
2026-05-31days on market $382,500 Active 39 DOM
-
2026-05-30days on market $382,500 Active 38 DOM
-
2026-04-22$382,500 Active 716-char remark
Show marketing remark (716 chars)
Spacious and maintained 5-unit property located on the desirable Northside of the city. All units are generously sized and have been updated within the past six years, offering modernized living spaces for tenants. The building is currently fully rented on a month-to-month basis, providing flexibility for future rent adjustments or occupancy changes. A standout feature is the large owner’s unit, which presents significant additional income potential if added to the rent roll. Alternatively, an owner-occupant can live on-site while rental income helps offset expenses. This property offers strong income potential and flexibility—ideal for both investors and owner-occupants. "SOLD AS IS "
ⓘ Source: listings_history table (triggers on properties + properties_extension) + one-shot
backfill from property_details.listing_events for pre-trigger history.
Climate risk First Street
- Flood 1/10 Low FEMA zone X (unshaded) · 0% chance over 30 yrs
- Wildfire 1/10 Low
- Heat 3/10 Moderate 7 d/yr ≥95°F today · 16 d/yr by 30 yrs out
- Wind 1/10 Low
- Air quality 2/10 Low 0 unhealthy d/yr today · 1 by 30 yrs out
Nearby sold comps map
Loading sold comps map…
Walkable amenities ~0.75 mi
Loading nearby amenities…
Taxation est. · year 1
- Rental income
- $98,760
- − Mortgage interest
- −$21,426
- − Property taxes
- −$5,738
- − Insurance
- −$1,912
- − Repairs & maintenance
- −$7,901
- − Management
- −$7,901
- − Depreciation
- −$11,127
- Taxable income
- $42,755
- Est. tax owed @ 24.0%
- −$10,261
- After-tax cash flow
- $36,039/yr
For passive investors: Depreciation is non-cash, so a rental often shows a tax loss while cash-flowing — sheltering income. Rental losses are passive: they offset passive income freely, and up to $25,000/yr can offset ordinary (W-2) income if you actively participate and your MAGI is under $100k (phasing out to $0 by $150k); unused losses carry forward. On sale, claimed depreciation is recaptured at up to 25%, and gains may owe capital-gains tax (a 1031 exchange can defer both). Figures are a year-1 estimate at your 24.0% rate — not tax advice; consult a CPA.
Condition & rehab AI · 1 photo
A moderately maintained 5-unit property with average exterior condition. Repairs to siding and landscaping, along with painting, would significantly enhance its resale and rental value.
Repairs flagged
- Moderate exterior siding — Weathered and discolored
- Minor landscaping — Overgrown grass
Value-add opportunities
- Both paint exterior walls — Enhances curb appeal and property value
- Both repair and paint exterior siding — Improves property appearance and value
- Both landscaping — Enhances curb appeal and property value
Renovation cost estimate screening
| Repair item | Severity | Est. cost |
|---|---|---|
| exterior siding · Weathered and discolored | Moderate | $3,000–15,000 |
| landscaping · Overgrown grass | Minor | $500–3,000 |
| Total estimated repair cost · 2 items | $3,500–18,000 |
Value-add ROI direction
- Both paint exterior walls — Enhances curb appeal and property value ↑
- Both repair and paint exterior siding — Improves property appearance and value ↑
- Both landscaping — Enhances curb appeal and property value ↑
ⓘ Cost ranges are severity-bucket heuristics (US national rule-of-thumb). Get contractor quotes + a written scope before underwriting a rehab budget.
Schools (NCES district)
- District
- Syracuse City School District
- NCES district ID
- 3628590
- Math proficiency
- 18% ▼ -5.00%
- Reading proficiency
- 26% ▬ 0.00%
- Median HH income
- $32,097
- Composite
- 17.83/100
- National rank
- #9007
- State rank
- #590 of 590 in NY
Livability — Syracuse
- Score
- 77/100
- State rank
- #187
- US rank
- #2869
Category grades
Schools grade is shown separately in the Schools card above.
Census & demographics
- Census place
- Syracuse, NY
- County
- Onondaga County · 247,257 people
- City population
- 152,627
- Metro
- Syracuse, NY
- Population (ZIP)
- 22,993
- Household income
- $44,712
- Rent vs Own
- Severe rent burden
- 1437.0
Population outlook (Onondaga County) Hauer SSP2
- Today (2025)
- 467,894 people
- By 2030
- 463,381 · -1.0%
- By 2040
- 447,697 · -4.3%
- By 2050
- 426,399 · -8.9%
- By 2075
- 373,661 · -20.1%
- By 2100
- 307,967 · -34.2%
Race, ethnicity, and origin ACS 2023
- Neighborhood character
- Highly diverse neighborhood (Simpson 0.70)
- Race & ethnicity
- White 46% Black 24% Asian 14% Two or more races 10% Hispanic / Latino 6%
- Hispanic origin (detail)
- Puerto Rican 4% Dominican 1%
- Common ancestry
- Romanian 3% Swedish 3% Italian 1%
- Foreign-born
- 22% · Vietnam, Philippines, Canada
- Languages at home
- 70% English-only · Spanish 6% Other Asian/Pacific 5% Vietnamese 4%
Political lean MEDSL · Onondaga
- 2024 margin
- D (+17.3) · D 58.6% · R 41.4%
- 2008→2024 swing
- -3.0pp toward R · 2008: 20.3pp · 2024: 17.3pp
- All cycles
- 2024: D+17.3 2020: D+20.6 2016: D+12.8 2012: D+21.1 2008: D+20.3
Not yet ingested
- Civics
- —
Market trends
- HPI YoY
- ▲ 30.91%
- Current HPI
- 399.3284
- Rent YoY
- —
- Metro
- Syracuse, NY
- State GDP YoY
- ▲ 2.60%
- F500 in state
- 92
Industry mix (Fortune 500 HQ in NY)
| Industry | F500 HQs | Revenue |
|---|---|---|
| Financial Services | 10 | $950B |
|
||
| Consumer Goods | 9 | $162B |
|
||
| Insurance | 4 | $225B |
|
||
| Telecommunications | 2 | $144B |
|
||
| Pharmaceuticals | 2 | $112B |
|
||
| Media / Entertainment | 2 | $69B |
|
||
Price history
1 event — show timeline
- 2026-04-22 Listed $382,500 CNYIS
Cash-flow waterfall
monthlySold comps — $/sqft
last 12 mo · ≤1 miLoading sold comps…