 Duplex
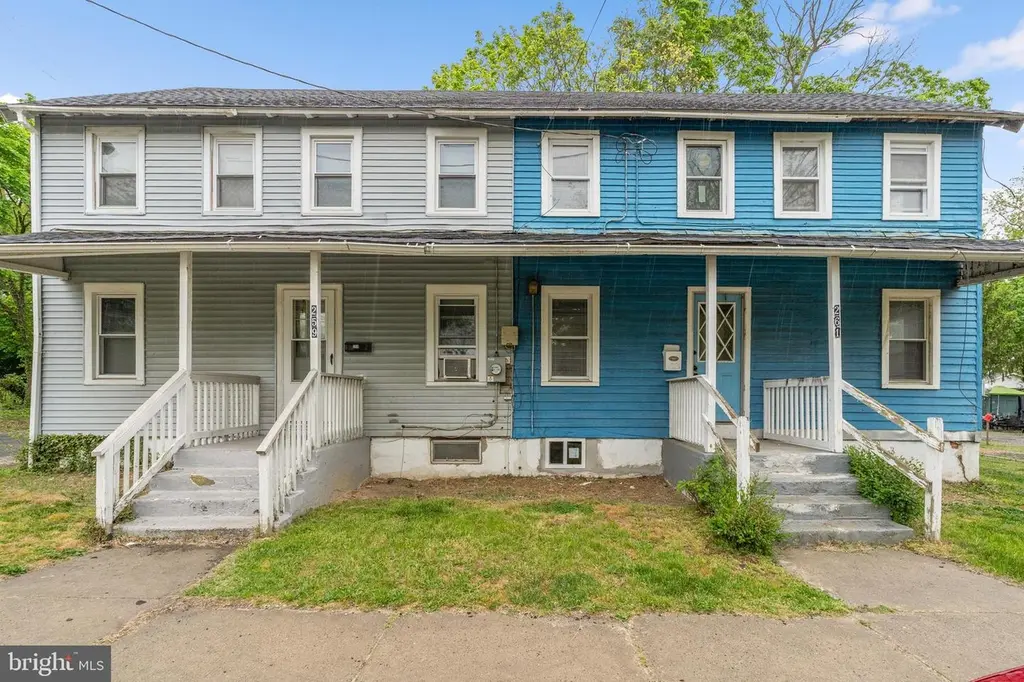
257-259 S Pine · Bridgeton, NJ
Flood risk No data
- FEMA flood zone
- —
- Chance of flooding over 30 yrs
- —
- Est. flood insurance / yr
- —
Fire risk No data
- Est. fire insurance / yr
- —
Heat risk No data
- Hot days now (above threshold)
- —
- Hot days in 30 yrs
- —
Wind risk No data
- Chance of severe wind over 30 yrs
- —
Air-quality risk No data
- Unhealthy air days now
- —
- Unhealthy air days in 30 yrs
- —
Risk factors via First Street. Map © Google.
Why this score? — see what drove the B- grade
The composite is a weighted blend of 9 inputs, each scored 0–100. Each bar is that input's sub-score; the figure is the points it added to the 100-point composite (weight × sub-score).
- Cash flow +30.0/30.0
- 1% rule +10.0/10.0
- DSCR +10.0/10.0
- ARV discount +7.5/15.0
- Condition / age +4.0/5.0
- Livability +3.6/5.0
- Rent growth +2.5/5.0
- Schools +1.0/10.0
- Appreciation +0.0/10.0
$250,000
🖨 Deal sheet 📄 Offer letter ✓ Due diligence
Multi-family units
County records classify this as Multi-Family (2-4 Unit). Listing-text estimate: 2 units. confirmed
Listing remarks
Deed includes 257-259-261-263 S. PINE STREET Side-by-side property with one side rented with a long term tenant. 4 bedrooms, 1 bath side is vacant and is fully renovated ; the other side is a 3 bedroom ; 1 bath that rents for 1200/mo. Great opportunity as an investor or an as an occupant looking to offset mortgage costs!
Key facts
- 5,292 sq ft lot
- Built 1930
- Listed 40 days
Property features AI
Finance
- Other: Total units listed as 1 (building), with two 3-bedroom units noted; Finished above-grade area reported (assessor)
- Financial info: Ownership: Fee simple; One unit vacant; One unit on month-to-month tenancy
Exterior
- Parking: On-street parking
- Utilities: Public water; Public sewer
- Home design: Semi-detached structure
- Construction: Frame construction; Brick/mortar foundation; Built year source: Assessor
- Exterior features: Corner lot (49 x 108); Semi-detached property; Above-grade and below-grade structures noted
Interior
- Bedrooms: Two 3-bedroom units
- Heating & cooling: Baseboard hot water heating; Oil-fired heating; Electric hot water
- Interior features: Unfinished basement; Finished above-grade living area
Neighborhood map
What this means for you Summary
Snapshot
- This is a 2 × 4-bed/1.0-bath units multifamily listed at $250k. Condition is rated good.
Deal economics
- At list price, monthly cash flow is $1k ($16k/yr) — positive. Per door: $685/mo.
- The deal already cash-flows at list — no discount required.
- Meets the 1% rule at list price ($4k rent vs $250k).
- Recommended offer: $242k (3.0% below list) — sets the bar for market timing.
- Cap rate 12.9% vs local median 4.9% in Bridgeton — top-decile yield for the area; either an underpriced asset or a hidden risk that comps aren't pricing in. Stress-test before assuming the spread holds.
Location & tenants
- Location reads 71/100 on livability (#240 in NJ) — a middle-class / working-renter tenant base. Strengths: commute A+, health & safety A+, housing A-; Watch: employment D, schools F, crime F.
- Bridgeton City School District (town): math 4% / reading 21% proficiency, ranked #468 of 472 in NJ (top 99%) — low school quality limits family demand, transient renter base, plan for 1-2y turnover.
- Market conditions: 201 active listings in the ZIP; 216 units permitted in Cumberland County in 2024 (73 in 5+ unit buildings).
Forward outlook
- Local home prices are declining (-3.0%/yr); year-one equity from $2k of loan paydown is wiped out by about $8k of value loss. Plan a longer hold.
- Cumberland County population projected to shrink 7% by 2050 — rents likely to lag national; underwrite the cash flow, not the appreciation.
- At projected returns (-3.0% appreciation + 3.0% rent growth), your $70k cash investment doubles in ~6 years — after that, you're playing with house money.
Negotiation context
- It's been on market 40 days — a 3% lower offer ($242k) is reasonable based on typical stale-listing flexibility.
Risks & watch-outs
- Watch-outs: built in 1930 — expect roof / HVAC / electrical / plumbing capex.
Questions for the listing agent
- It's been on market 40 days. Have you received any prior offers? Is the seller open to a 3% concession, seller financing, or rate buy-down credit?
- Can we see the unit-by-unit rent roll, current vacancy, and any below-market leases? What's the average tenancy length?
- What capital expenditures (roof, boiler, parking lot, exteriors) have been made in the last 5 years, and what's planned in the next 2?
- Built in 1930 — when were the roof, HVAC, electrical panel, plumbing, and water heater last replaced?
- Is there a deadline driving the sale (1031 exchange, divorce, estate, relocation)? That informs how much negotiation room exists.
- Schools are F-rated, which usually means shorter tenancies and higher turnover. Who's the typical renter profile here, and what's been the actual vacancy rate?
- Crime grade is F in this area — have there been break-ins, vandalism, or insurance claims at this property in the last 3 years? What carrier currently insures it and at what premium?
- What's the average days-on-market for RENTAL listings here right now (not sales)? A rising rental-DOM trend means longer vacancies and softer asking-rent achievability than the comps imply.
- What's the recent tenant-quality profile in this submarket — average credit score on applications, eviction rate, late-payment / NSF rate, and stable-employment percentage? A property-management company in the area should have these aggregated.
- How much new apartment / multifamily construction is in the pipeline within 1–3 miles? Heavy new supply (>2% of stock underway) typically softens rents 12–24 months out; light construction supports rent growth.
Investment metrics
- 1% rule
- 1.57% ✓
- Cap rate
- 12.86%
- Cash-on-cash
- 23.47%
- DSCR
- 2.04
- GRM
- 5.3
CMA / ARV
No comps found within radius.
Projected returns pro-forma
-3.0% appreciation · 3.0% rent growth · sell at horizon
- IRR
- 16.6%
- Equity multiple
- 1.67×
- Total profit
- $46,748
- Equity at exit
- $37,276
- IRR
- 25.1%
- Equity multiple
- 3.19×
- Total profit
- $153,230
- Equity at exit
- $21,615
Cash invested: $70,000 (down + closing). Projections, not guarantees.
Landlord ↔ Tenant lean methodology
- Overall (STATE)
- 21 Tenant-Leaning
- State New Jersey
- 21 Tenant-Leaning · D+6
- County
- — inherits STATE
- City
- — inherits STATE
ZIP-level market 08302
- Home prices YoY
- -24.0%
- Active inventory
- 201
- Price-to-rent
- 10.6×
Monthly cashflow live
- Estimated rent
- $3,920 medium interval (Pro) →
- Mortgage (P&I)
- −$1,311
- Tax est. 1.5%
- −$312 /mo · $3,750/yr
- Insurance
- −$104
- HOA
- −$0
- Vacancy / Maint / Mgmt
- −$823
- Net cashflow
- $1,369
Break-even live
2-unit breakdown (identical units grouped — click to expand)
| Units | Beds | Baths | Est. rent |
|---|---|---|---|
| 2× units | 4 | 1 | $3,920 |
| #1 | 4 | 1 | $1,960 |
| #2 | 4 | 1 | $1,960 |
| Total (2 units) | $3,920 | ||
UW: 25.0% down · 7.5% · 30yr · 1.5% tax · 5.0% vac · 8.0% maint · 8.0% mgmt
Financing live
Cash to close
- Down payment
- $62,500
- Closing costs
- $7,500
- Reserves months
- —
- Total cash needed
- —
Loan-product check · same deal, 3 products live
Conventional
25% down · 7.5% · 30yr
- Down + closing
- —
- Monthly P&I
- —
- Monthly cashflow
- —
- DSCR
- —
- Eligible?
- —
Personal DTI + credit; lowest rate.
DSCR
20% down · 8.5% · 30yr
- Down + closing
- —
- Monthly P&I
- —
- Monthly cashflow
- —
- DSCR
- —
- Eligible?
- —
No personal income docs; deal must DSCR.
Hard money
10% down · 12.0% · 12mo
- Down + closing
- —
- Monthly P&I
- —
- Monthly cashflow
- —
- DSCR
- —
- Eligible?
- —
Short-term bridge; refi at stabilization.
Listing history 14 events
-
2026-06-18days on market $250,000 Active 40 DOM
-
2026-06-17days on market $250,000 Active 39 DOM
-
2026-06-16days on market $250,000 Active 38 DOM
-
2026-06-15days on market $250,000 Active 37 DOM
-
2026-06-13days on market $250,000 Active 35 DOM
-
2026-06-12days on market $250,000 Active 34 DOM
-
2026-06-09days on market $250,000 Active 31 DOM
-
2026-06-08days on market $250,000 Active 30 DOM
-
2026-06-07days on market $250,000 Active 29 DOM
-
2026-06-04days on market $250,000 Active 25 DOM
-
2026-06-02days on market $250,000 Active 24 DOM
-
2026-06-01days on market $250,000 Active 23 DOM
-
2026-05-31days on market $250,000 Active 22 DOM
-
2026-05-09$250,000 Active 322-char remark
ⓘ Source: listings_history table (triggers on properties + properties_extension) + one-shot
backfill from property_details.listing_events for pre-trigger history.
Nearby sold comps map
Loading sold comps map…
Walkable amenities ~0.75 mi
Loading nearby amenities…
Taxation est. · year 1
- Rental income
- $47,040
- − Mortgage interest
- −$14,004
- − Property taxes
- −$3,750
- − Insurance
- −$1,250
- − Repairs & maintenance
- −$3,763
- − Management
- −$3,763
- − Depreciation
- −$7,273
- Taxable income
- $13,237
- Est. tax owed @ 24.0%
- −$3,177
- After-tax cash flow
- $13,252/yr
For passive investors: Depreciation is non-cash, so a rental often shows a tax loss while cash-flowing — sheltering income. Rental losses are passive: they offset passive income freely, and up to $25,000/yr can offset ordinary (W-2) income if you actively participate and your MAGI is under $100k (phasing out to $0 by $150k); unused losses carry forward. On sale, claimed depreciation is recaptured at up to 25%, and gains may owe capital-gains tax (a 1031 exchange can defer both). Figures are a year-1 estimate at your 24.0% rate — not tax advice; consult a CPA.
Condition & rehab AI · 13 photos
This multi-family property is in good condition with no major repairs or maintenance needed. It has a good exterior and interior appearance, and potential value can be added through painting and landscaping improvements.
Value-add opportunities
- Both Painting the exterior and interior — Painting can enhance the curb appeal and interior aesthetics, making the property more attractive to potential buyers and renters.
- Both Landscaping improvements — Landscaping can improve the curb appeal and add value to the property, making it more attractive to potential buyers and renters.
Renovation cost estimate screening
Value-add ROI direction
- Both Painting the exterior and interior — Painting can enhance the curb appeal and interior aesthetics, making the property more attractive to potential buyers and renters. ↑
- Both Landscaping improvements — Landscaping can improve the curb appeal and add value to the property, making it more attractive to potential buyers and renters. ↑
ⓘ Cost ranges are severity-bucket heuristics (US national rule-of-thumb). Get contractor quotes + a written scope before underwriting a rehab budget.
Schools (NCES district)
- District
- Bridgeton City School District
- NCES district ID
- 3402250
- Math proficiency
- 4% ▼ -8.00%
- Reading proficiency
- 21% ▲ 3.00%
- Median HH income
- $34,542
- Composite
- 10.15/100
- National rank
- #9797
- State rank
- #468 of 472 in NJ
Livability — Bridgeton
- Score
- 71/100
- State rank
- #240
- US rank
- #6660
Category grades
Schools grade is shown separately in the Schools card above.
Census & demographics
- Census place
- Bridgeton, NJ
- Population (ZIP)
- 47,003
Population outlook (Cumberland County) Hauer SSP2
- Today (2025)
- 152,743 people
- By 2030
- 150,373 · -1.6%
- By 2040
- 146,881 · -3.8%
- By 2050
- 142,653 · -6.6%
- By 2075
- 129,468 · -15.2%
- By 2100
- 107,456 · -29.6%
Race, ethnicity, and origin ACS 2023
- Neighborhood character
- Diverse neighborhood (Simpson 0.69)
- Race & ethnicity
- Hispanic / Latino 39% White 30% Black 25% Two or more races 19% Native American 2% Asian 1%
- Hispanic origin (detail)
- Mexican 25% Puerto Rican 8% Dominican 2%
- Common ancestry
- Romanian 2%
- Foreign-born
- 17% · Canada, Jamaica
- Languages at home
- 64% English-only · Spanish 34% Other Indo-European 1%
Political lean MEDSL · Cumberland
- 2024 margin
- Toss-up / Even · D 47.6% · R 51.3% · Other 1.1%
- 2008→2024 swing
- -25.4pp toward R · 2008: 21.6pp · 2024: -3.8pp
- All cycles
- 2024: R+3.8 2020: D+6.0 2016: D+5.3 2012: D+23.1 2008: D+21.6
Not yet ingested
- Civics
- —
Market trends
- HPI YoY
- ▼ -91.94%
- Current HPI
- 290.6461
- Rent YoY
- —
- Metro
- —
- State GDP YoY
- ▲ 2.05%
- F500 in state
- 34
Industry mix (Fortune 500 HQ in NJ)
| Industry | F500 HQs | Revenue |
|---|---|---|
| Consumer Goods | 3 | $31B |
|
||
| Pharmaceuticals | 2 | $153B |
|
||
| Technology | 2 | $21B |
|
||
| Insurance | 2 | $20B |
|
||
| Healthcare | 2 | $19B |
|
||
| Financial Services | 1 | $70B |
|
||
Price history
1 event — show timeline
- 2026-05-09 Listed $250,000 BRIGHT MLS
Cash-flow waterfall
monthlySold comps — $/sqft
last 12 mo · ≤1 miLoading sold comps…