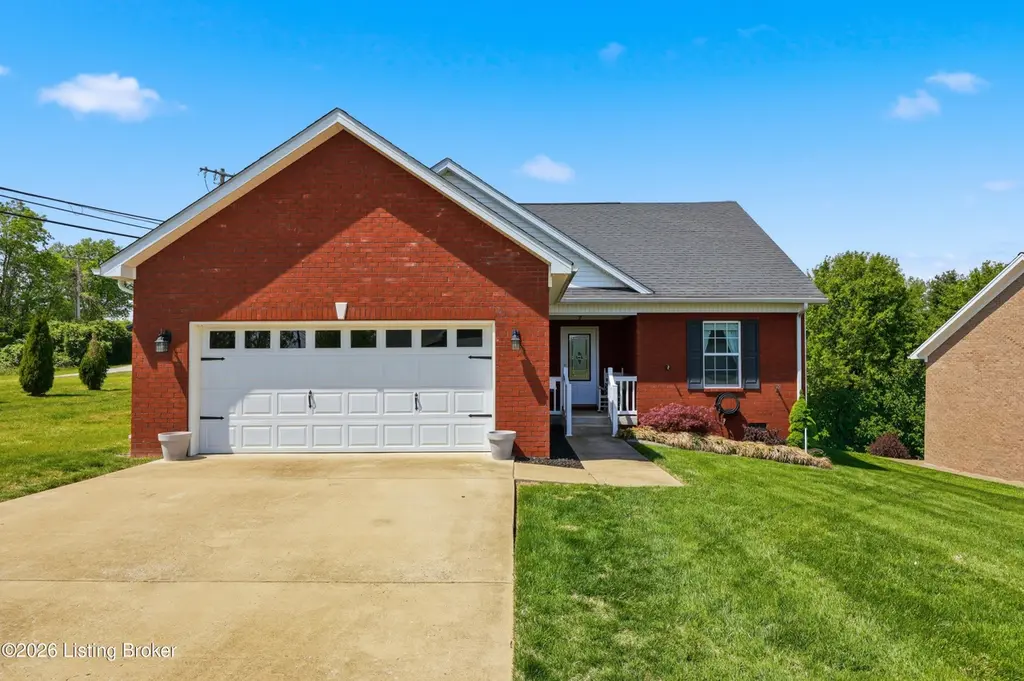
9 Mockingbird Dr · Taylorsville, KY
Flood risk 1/10 · Minimal
- FEMA flood zone
- X (unshaded)
- Chance of flooding over 30 yrs
- 0.0%
- Est. flood insurance / yr
- $507 – $1,088
Fire risk 3/10 · Minor
- Est. fire insurance / yr
- $839 – $1,559
Heat risk 4/10 · Minor
- Hot days now (above 104°F)
- 7 days/yr
- Hot days in 30 yrs
- 19 days/yr
Wind risk 2/10 · Minimal
- Chance of severe wind over 30 yrs
- 2.0%
Air-quality risk 2/10 · Minimal
- Unhealthy air days now
- 1 days/yr
- Unhealthy air days in 30 yrs
- 2 days/yr
Risk factors via First Street. Map © Google.
Why this score? — see what drove the D grade
The composite is a weighted blend of 9 inputs, each scored 0–100. Each bar is that input's sub-score; the figure is the points it added to the 100-point composite (weight × sub-score).
- Cash flow +13.4/30.0
- ARV discount +7.5/15.0
- DSCR +4.0/10.0
- Schools +3.9/10.0
- Livability +3.6/5.0
- 1% rule +2.8/10.0
- Rent growth +2.5/5.0
- Condition / age +2.5/5.0
- Appreciation +0.0/10.0
$280,000
🖨 Deal sheet (PDF) 📄 Offer letter ✓ Due diligence
Listing remarks
Move-In Ready! This charming home offers comfort, convenience and a fantastic location! This split-bedroom floor plan features 3 bedrooms, 2 full bathrooms and 1,277 square feet. The kitchen is both stylish and practical, includes granite countertops and stainless-steel appliances. The large center island offers extra prep space, storage and seating space. Step outside to get the curb appeal you've always wanted with the decorative concrete curbing. The fully fenced back yard has a large deck for entertaining. Enjoy the convenience of the two-car attached garage plus an 8x12 storage shed which provides plenty of space for parking and storage. Ideally close to schools and Taylorsville Lake
Key facts
- Large deck
- Large center island
- Granite countertops
Tags
Property features AI
Finance
- Other: Located in the HIGHVIEW ESTATES subdivision
- HOA & community: No association fee
Exterior
- Parking: Attached driveway; Two-car garage
- Utilities: Electricity connected
- Home design: Single-family ranch-style home; One story; Built in 2018
- Construction: Vinyl siding and brick exterior; Shingle roof; Crawl space foundation
- Exterior features: Cleared lot; Chain link fencing
Interior
- Kitchen: Kitchen located on the first floor
- Bedrooms: Three bedrooms, all on the first floor; Primary bedroom located on the first floor
- Bathrooms: Two full bathrooms
- Heating & cooling: Heat pump heating; Central air conditioning; One HVAC unit
- Interior features: Six total rooms; Four closets; First-floor primary bedroom; No basement; Family room on the first floor
- Laundry & utility: First-floor laundry
Neighborhood map
What this means for you Summary
Snapshot
- This is a 3-bed/2.0-bath other listed at $280k.
Deal economics
- At list price, monthly cash flow is $6 ($68/yr) — positive.
- The deal already cash-flows at list — no discount required.
- To meet the 1% rule (rent ≥ 1% of price), the offer needs to be $218k (22.0% below list).
- Recommended offer: $218k (22.0% below list) — sets the bar for 1% rule.
- Cap rate 6.3% vs local median 3.9% in Taylorsville — top-decile yield for the area; either an underpriced asset or a hidden risk that comps aren't pricing in. Stress-test before assuming the spread holds.
Location & tenants
- Location reads 71/100 on livability (#149 in KY) — a middle-class / working-renter tenant base. Strengths: cost of living A+, housing A+, crime B; Watch: amenities F, commute F, employment F.
- Spencer County (rural): math 41% / reading 46% proficiency, ranked #18 of 165 in KY (top 11%) — families likely to look elsewhere, expect single-tenant / working-renter base with shorter leases.
- Zoned schools: Taylorsville Elementary School (math 46% / reading 44%, grade D-, #143 of 676 statewide, top 22%, 628 students, 53% FRL); Spencer County Middle School (math 37% / reading 50%, grade D, #42 of 217 statewide, top 19%, 721 students, 39% FRL); Spencer County High School (math 35% / reading 43%, grade F, #51 of 254 statewide, top 21%, 992 students, 35% FRL) — zoned schools at 42% FRL track the district average.
- Market conditions: 113 active listings in the ZIP; 126 units permitted in Spencer County in 2024 (0 in 5+ unit buildings).
Forward outlook
- Local home prices are declining (-3.0%/yr); year-one equity from $2k of loan paydown is wiped out by about $8k of value loss. Plan a longer hold.
- Spencer County population projected at +17% by 2050 — long-run rental-demand tailwind backs the buy-and-hold thesis.
Negotiation context
- Only 14 days on market — expect competitive offers; lowballing is unlikely to land.
- Current owner paid $168k; list at $280k implies a 67% gain — meaningful room to come down on a strong offer.
Questions for the listing agent
- Is there a deadline driving the sale (1031 exchange, divorce, estate, relocation)? That informs how much negotiation room exists.
- The area grade is low — what's the realistic commute time and amenity access for the typical tenant pool here? Any planned neighborhood developments (good or bad) we should know about?
- What's the average days-on-market for RENTAL listings here right now (not sales)? A rising rental-DOM trend means longer vacancies and softer asking-rent achievability than the comps imply.
- What's the recent tenant-quality profile in this submarket — average credit score on applications, eviction rate, late-payment / NSF rate, and stable-employment percentage? A property-management company in the area should have these aggregated.
- How much new for-sale + rental construction is in the pipeline within 1–3 miles? Heavy new supply typically softens prices + rents 12–24 months out; constrained supply supports both.
Investment metrics
- 1% rule
- 0.78% ✗
- Cap rate
- 6.32%
- Cash-on-cash
- 0.09%
- DSCR
- 1.00
- GRM
- 10.7
CMA / ARV
No comps found within radius.
Projected returns pro-forma
-3.0% appreciation · 3.0% rent growth · sell at horizon
- IRR
- -16.2%
- Equity multiple
- 0.42×
- Total profit
- $-45,110
- Equity at exit
- $41,749
- IRR
- -8.0%
- Equity multiple
- 0.50×
- Total profit
- $-39,218
- Equity at exit
- $24,209
Cash invested: $78,400 (down + closing). Projections, not guarantees.
Landlord ↔ Tenant lean methodology
- Overall (STATE)
- 83 Strongly Landlord-Friendly
- State Kentucky
- 83 Strongly Landlord-Friendly · R+16
- County
- — inherits STATE
- City
- — inherits STATE
ZIP-level market 40071
- Home prices YoY
- -13.4%
- Active inventory
- 113
- Price-to-rent
- 10.7×
Monthly cashflow live
- Estimated rent
- $2,185 medium interval (Pro) →
- Mortgage (P&I)
- −$1,468
- Tax from tax record
- −$135 /mo · $1,621/yr
- Insurance
- −$117
- HOA
- −$0
- Vacancy / Maint / Mgmt
- −$459
- Net cashflow
- $6
Break-even live
Sensitivity live
| Price | -10% $164 | -5% $85 | +0% $6 | +5% $-74 | +10% $-153 |
|---|---|---|---|---|---|
| Rent | -10% $-167 | -5% $-81 | +0% $6 | +5% $92 | +10% $178 |
| Rate | -1.0pp $147 | -0.5pp $77 | base $6 | +0.5pp $-67 | +1.0pp $-141 |
UW: 25.0% down · 7.5% · 30yr · 1.5% tax · 5.0% vac · 8.0% maint · 8.0% mgmt
Financing live
Cash to close
- Down payment
- $70,000
- Closing costs
- $8,400
- Reserves months
- —
- Total cash needed
- —
Loan-product check · same deal, 3 products live
Conventional
25% down · 7.5% · 30yr
- Down + closing
- —
- Monthly P&I
- —
- Monthly cashflow
- —
- DSCR
- —
- Eligible?
- —
Personal DTI + credit; lowest rate.
DSCR
20% down · 8.5% · 30yr
- Down + closing
- —
- Monthly P&I
- —
- Monthly cashflow
- —
- DSCR
- —
- Eligible?
- —
No personal income docs; deal must DSCR.
Hard money
10% down · 12.0% · 12mo
- Down + closing
- —
- Monthly P&I
- —
- Monthly cashflow
- —
- DSCR
- —
- Eligible?
- —
Short-term bridge; refi at stabilization.
Listing history 7 events
-
2026-05-07status Pending
-
2026-05-07price $280,000
-
2026-04-25historical Active Under Contract
-
2026-04-23$265,000 Active
-
2018-09-18soldstatus $168,000
-
2015-06-25soldstatus $187,000
-
2003-09-05soldstatus $749,900
ⓘ Source: listings_history table (triggers on properties + properties_extension) + one-shot
backfill from property_details.listing_events for pre-trigger history.
Tax reassessment forecast KY · Resets to sale price
- Current annual tax
- $1,621 · $135/mo
- Projected year-2 tax
- $2,408 · $201/mo
- Expected delta
- +$787/yr (+$66/mo · 48.5%)
ⓘ Screening estimate from a state-policy table — verify with the county assessor before closing.
Climate risk First Street
- Flood 1/10 Low FEMA zone X (unshaded) · 0% chance over 30 yrs
- Wildfire 3/10 Moderate
- Heat 4/10 Moderate 7 d/yr ≥104°F today · 19 d/yr by 30 yrs out
- Wind 2/10 Low 2% chance of damaging wind over 30 yrs
- Air quality 2/10 Low 1 unhealthy d/yr today · 2 by 30 yrs out
Nearby sold comps map
Loading sold comps map…
Walkable amenities ~0.75 mi
Loading nearby amenities…
Taxation est. · year 1
- Rental income
- $26,215
- − Mortgage interest
- −$15,684
- − Property taxes
- −$1,621
- − Insurance
- −$1,400
- − Repairs & maintenance
- −$2,097
- − Management
- −$2,097
- − Depreciation
- −$8,145
- Taxable loss
- −$4,831
- Est. tax savings @ 24.0%
- +$1,159
- After-tax cash flow
- $1,228/yr
For passive investors: Depreciation is non-cash, so a rental often shows a tax loss while cash-flowing — sheltering income. Rental losses are passive: they offset passive income freely, and up to $25,000/yr can offset ordinary (W-2) income if you actively participate and your MAGI is under $100k (phasing out to $0 by $150k); unused losses carry forward. On sale, claimed depreciation is recaptured at up to 25%, and gains may owe capital-gains tax (a 1031 exchange can defer both). Figures are a year-1 estimate at your 24.0% rate — not tax advice; consult a CPA.
Schools (NCES district)
- District
- Spencer County
- NCES district ID
- 2105490
- Math proficiency
- 41% ▼ -14.00%
- Reading proficiency
- 46% ▼ -19.00%
- Median HH income
- $64,167
- Composite
- 38.74/100
- National rank
- #4125
- State rank
- #18 of 165 in KY
Livability — Taylorsville
- Score
- 71/100
- State rank
- #149
- US rank
- #7189
Category grades
Schools grade is shown separately in the Schools card above.
Census & demographics
- Population (ZIP)
- 16,702
Population outlook (Spencer County) Hauer SSP2
- Today (2025)
- 20,077 people
- By 2030
- 21,008 · +4.6%
- By 2040
- 22,560 · +12.4%
- By 2050
- 23,480 · +16.9%
- By 2075
- 25,222 · +25.6%
- By 2100
- 25,550 · +27.3%
Race, ethnicity, and origin ACS 2023
- Neighborhood character
- Predominantly White (93%)
- Race & ethnicity
- White 93% Two or more races 4% Hispanic / Latino 2% Black 1%
- Common ancestry
- Italian 4% Slovak 2% Lithuanian 1%
- Foreign-born
- 1%
- Languages at home
- 99% English-only · Spanish 1%
Political lean MEDSL · Spencer
- 2024 margin
- Solid R (+56.7) · D 21.0% · R 77.8% · Other 1.2%
- 2008→2024 swing
- -21.2pp toward R · 2008: -35.5pp · 2024: -56.7pp
- All cycles
- 2024: R+56.7 2020: R+54.3 2016: R+55.5 2012: R+37.7 2008: R+35.5
Not yet ingested
- Civics
- —
Market trends
- HPI YoY
- ▼ -42.62%
- Current HPI
- 274.9283
- Rent YoY
- —
- Metro
- —
- State GDP YoY
- ▲ 1.81%
- F500 in state
- 4
Industry mix (Fortune 500 HQ in KY)
| Industry | F500 HQs | Revenue |
|---|---|---|
| Healthcare | 1 | $118B |
|
||
| Food / Beverage | 1 | $7B |
|
||
Price history
-62.7% since first listed7 events — show timeline
- 2026-05-07 Pending — Metro Search MLS
- 2026-05-07 Price Changed $280,000 Metro Search MLS
- 2026-04-25 Contingent — Metro Search MLS
- 2026-04-23 Listed $265,000 Metro Search MLS
- 2018-09-18 Sold (Public Records) $168,000 Public Records
- 2015-06-25 Sold (Public Records) $187,000 Public Records
- 2003-09-05 Sold (Public Records) $749,900 Public Records
Property tax history
+29.4%/yrLatest (2025): $1,621 · -0.4% YoY. Source: county tax records.
Cash-flow waterfall
monthlySold comps — $/sqft
last 12 mo · ≤1 miLoading sold comps…