4750 Andrews Hwy #10 · Odessa, TX
Flood risk 1/10 · Minimal
- FEMA flood zone
- X (unshaded)
- Chance of flooding over 30 yrs
- 0.0%
- Est. flood insurance / yr
- $507 – $1,088
Fire risk 7/10 · Major
- Est. fire insurance / yr
- $1,222 – $2,270
Heat risk 5/10 · Moderate
- Hot days now (above 101°F)
- 6 days/yr
- Hot days in 30 yrs
- 18 days/yr
Wind risk 2/10 · Minimal
- Chance of severe wind over 30 yrs
- 3.0%
Air-quality risk 1/10 · Minimal
- Unhealthy air days now
- 0 days/yr
- Unhealthy air days in 30 yrs
- 0 days/yr
Risk factors via First Street. Map © Google.
Why this score? — see what drove the C+ grade
The composite is a weighted blend of 9 inputs, each scored 0–100. Each bar is that input's sub-score; the figure is the points it added to the 100-point composite (weight × sub-score).
- Cash flow +27.5/30.0
- DSCR +9.6/10.0
- 1% rule +7.5/10.0
- ARV discount +7.5/15.0
- Condition / age +4.0/5.0
- Livability +3.8/5.0
- Rent growth +2.8/5.0
- Schools +2.2/10.0
- Appreciation +0.0/10.0
$163,000
🖨 Deal sheet 📄 Offer letter ✓ Due diligence
Listing remarks MLS
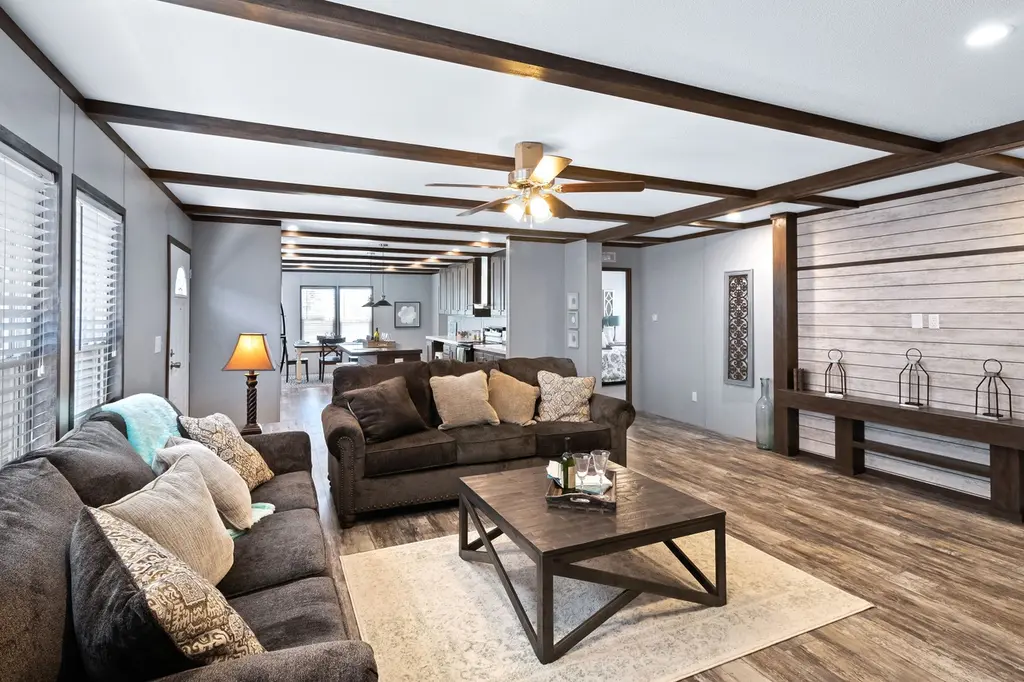
Farmhouse kitchen with fireplace! Incredible kitchen and laundry room! This home has 3 bedroom 2 baths and massive living room. Perfect side door for carport access. Too many upgrades to mention. Price includes Delivery, set, air conditioner, skirting, caliche pad and steps.
Key facts
- Built 2024
- Listed 765 days
Neighborhood map
What this means for you Summary
Snapshot
- This is a 3-bed/2.0-bath manufactured listed at $163k. Condition is rated good.
Deal economics
- At list price, monthly cash flow is $481 ($6k/yr) — positive.
- The deal already cash-flows at list — no discount required.
- Meets the 1% rule at list price ($2k rent vs $163k).
- Recommended offer: $143k (12.0% below list) — sets the bar for market timing.
Location & tenants
- Location reads 75/100 on livability (#132 in TX, #3,928 nationally) — a middle-class / working-renter tenant base. Strengths: cost of living A+, housing A+, health & safety A+; Watch: commute D+, amenities D, schools F.
- Ector County ISD (urban): math 22% / reading 27% proficiency, ranked #707 of 826 in TX (top 86%) — low school quality limits family demand, transient renter base, plan for 1-2y turnover.
- Market conditions: Rents rising (+1.4%/yr); 263 active listings in the ZIP; 11 comparable units currently listed for rent nearby; rentals at typical pace (median 22d on market — plan ~3-4 weeks tenant-placement turnaround); solid renter incomes; 1,004 units permitted in Ector County in 2024 (0 in 5+ unit buildings).
- This rent runs 32% of the median local income ($75k/yr) — at the standard rent-burdened threshold; future hikes will face affordability resistance.
Forward outlook
- Local home prices are declining (-3.0%/yr); year-one equity from $1k of loan paydown is wiped out by about $5k of value loss. Plan a longer hold.
- Ector County population projected at +78% by 2050 — long-run rental-demand tailwind backs the buy-and-hold thesis.
Negotiation context
- It's been on market 766 days — a 12% lower offer ($143k) is reasonable based on typical stale-listing flexibility.
Risks & watch-outs
- Climate carrying-cost: major wildfire risk; extreme-heat days projected 6→18/yr by 2055 (HVAC capex compounding) — expect insurance premiums to compound above CPI over the hold.
Questions for the listing agent
- It's been on market 766 days. Have you received any prior offers? Is the seller open to a 12% concession, seller financing, or rate buy-down credit?
- Why hasn't it sold? Are there any deal-killer items the seller is aware of (foundation, flood, title, zoning, code violations)?
- Is there a deadline driving the sale (1031 exchange, divorce, estate, relocation)? That informs how much negotiation room exists.
- Schools are F-rated, which usually means shorter tenancies and higher turnover. Who's the typical renter profile here, and what's been the actual vacancy rate?
- What's the average days-on-market for RENTAL listings here right now (not sales)? A rising rental-DOM trend means longer vacancies and softer asking-rent achievability than the comps imply.
- What's the recent tenant-quality profile in this submarket — average credit score on applications, eviction rate, late-payment / NSF rate, and stable-employment percentage? A property-management company in the area should have these aggregated.
- How much new for-sale + rental construction is in the pipeline within 1–3 miles? Heavy new supply typically softens prices + rents 12–24 months out; constrained supply supports both.
Investment metrics
- 1% rule
- 1.25% ✓
- Cap rate
- 9.84%
- Cash-on-cash
- 12.65%
- DSCR
- 1.56
- GRM
- 6.7
CMA / ARV
No comps found within radius.
Projected returns pro-forma
-3.0% appreciation · 1.36% rent growth · sell at horizon
- IRR
- 0.6%
- Equity multiple
- 1.02×
- Total profit
- $961
- Equity at exit
- $24,304
- IRR
- 8.5%
- Equity multiple
- 1.60×
- Total profit
- $27,307
- Equity at exit
- $14,093
Cash invested: $45,640 (down + closing). Projections, not guarantees.
Landlord ↔ Tenant lean methodology
- Overall (STATE)
- 87 Strongly Landlord-Friendly
- State Texas
- 87 Strongly Landlord-Friendly · R+5
- County
- — inherits STATE
- City
- — inherits STATE
ZIP-level market 79762
- Rents YoY
- 1.4%
- Active inventory
- 263
- Price-to-rent
- 6.7×
Monthly cashflow live
- Estimated rent
- $2,035 high interval (Pro) →
- Mortgage (P&I)
- −$855
- Tax est. 1.5%
- −$204 /mo · $2,445/yr
- Insurance
- −$68
- HOA
- −$0
- Vacancy / Maint / Mgmt
- −$427
- Net cashflow
- $481
Break-even live
UW: 25.0% down · 7.5% · 30yr · 1.5% tax · 5.0% vac · 8.0% maint · 8.0% mgmt
Financing live
Cash to close
- Down payment
- $40,750
- Closing costs
- $4,890
- Reserves months
- —
- Total cash needed
- —
Loan-product check · same deal, 3 products live
Conventional
25% down · 7.5% · 30yr
- Down + closing
- —
- Monthly P&I
- —
- Monthly cashflow
- —
- DSCR
- —
- Eligible?
- —
Personal DTI + credit; lowest rate.
DSCR
20% down · 8.5% · 30yr
- Down + closing
- —
- Monthly P&I
- —
- Monthly cashflow
- —
- DSCR
- —
- Eligible?
- —
No personal income docs; deal must DSCR.
Hard money
10% down · 12.0% · 12mo
- Down + closing
- —
- Monthly P&I
- —
- Monthly cashflow
- —
- DSCR
- —
- Eligible?
- —
Short-term bridge; refi at stabilization.
Rent comps 11 comps
| Address | Beds | Baths | Sqft | Rent | $/sqft | DOM | Units | Dist |
|---|---|---|---|---|---|---|---|---|
| 1311 E 52nd St Unit 1 Odessa, TX | 3.0 | 2.0 | 1410 | $1,950 | $1.38 | 21d | 1 | 0.84mi |
| 1308 Alpine St Odessa, TX | 3.0 | 2.0 | 1800 | $2,195 | $1.22 | 13d | 1 | 0.98mi |
| 3624 Walnut Ave Odessa, TX | 3.0 | 1.0 | 1488 | $1,950 | $1.31 | 44d | 1 | 1.06mi |
| 237 Orchard Dr Odessa, TX | 4.0 | 2.0 | 1768 | $2,000 | $1.13 | 13d | 1 | 1.11mi |
| 1529 E 52nd St Odessa, TX | 3.0 | 2.0 | 1275 | $2,200 | $1.73 | 44d | 1 | 1.13mi |
| 1212 E Century Ave Odessa, TX | 3.0 | 1.0 | 1359 | $1,300 | $0.96 | 21d | 1 | 1.18mi |
| 4207 Dakota Ave Odessa, TX | 3.0 | 2.0 | 1904 | $2,300 | $1.21 | 44d | 1 | 1.31mi |
| 5704 Winchester Ave Odessa, TX | 4.0 | 2.0 | 2354 | $2,700 | $1.15 | 21d | 1 | 1.35mi |
| 2702 S Colonial Dr Odessa, TX | 3.0 | 1.0 | 1490 | $1,500 | $1.01 | 13d | 1 | 1.43mi |
| 1813 Petroleum Dr Odessa, TX | 3.0 | 2.0 | 1299 | $1,700 | $1.31 | 21d | 1 | 1.44mi |
| 1710 Wrigley Dr Odessa, TX | 4.0 | 2.0 | 1578 | $2,800 | $1.77 | 21d | 1 | 1.46mi |
Listing history 17 events
-
2026-06-19days on market $163,000 Active 766 DOM
-
2026-06-18days on market $163,000 Active 765 DOM
-
2026-06-17days on market $163,000 Active 764 DOM
-
2026-06-16days on market $163,000 Active 763 DOM
-
2026-06-15days on market $163,000 Active 762 DOM
-
2026-06-14days on market $163,000 Active 760 DOM
-
2026-06-13days on market $163,000 Active 759 DOM
-
2026-06-10days on market $163,000 Active 757 DOM
-
2026-06-09days on market $163,000 Active 756 DOM
-
2026-06-08days on market $163,000 Active 755 DOM
-
2026-06-07days on market $163,000 Active 754 DOM
-
2026-06-03days on market $163,000 Active 749 DOM
-
2026-06-01days on market $163,000 Active 748 DOM
-
2026-05-31days on market $163,000 Active 747 DOM
-
2026-05-30days on market $163,000 Active 746 DOM
-
2024-05-29price $163,000 275-char remark
Show marketing remark (275 chars)
Farmhouse kitchen with fireplace! Incredible kitchen and laundry room! This home has 3 bedroom 2 baths and massive living room. Perfect side door for carport access. Too many upgrades to mention. Price includes Delivery, set, air conditioner, skirting, caliche pad and steps.
-
2024-05-14$172,999 Active 275-char remark
Show marketing remark (275 chars)
Farmhouse kitchen with fireplace! Incredible kitchen and laundry room! This home has 3 bedroom 2 baths and massive living room. Perfect side door for carport access. Too many upgrades to mention. Price includes Delivery, set, air conditioner, skirting, caliche pad and steps.
ⓘ Source: listings_history table (triggers on properties + properties_extension) + one-shot
backfill from property_details.listing_events for pre-trigger history.
Climate risk First Street
- Flood 1/10 Low FEMA zone X (unshaded) · 0% chance over 30 yrs
- Wildfire 7/10 Severe
- Heat 5/10 Major 6 d/yr ≥101°F today · 18 d/yr by 30 yrs out
- Wind 2/10 Low 3% chance of damaging wind over 30 yrs
- Air quality 1/10 Low 0 unhealthy d/yr today · 0 by 30 yrs out
Nearby sold comps map
Loading sold comps map…
Walkable amenities ~0.75 mi
Loading nearby amenities…
Taxation est. · year 1
- Rental income
- $24,420
- − Mortgage interest
- −$9,131
- − Property taxes
- −$2,445
- − Insurance
- −$815
- − Repairs & maintenance
- −$1,954
- − Management
- −$1,954
- − Depreciation
- −$4,742
- Taxable income
- $3,380
- Est. tax owed @ 24.0%
- −$811
- After-tax cash flow
- $4,963/yr
For passive investors: Depreciation is non-cash, so a rental often shows a tax loss while cash-flowing — sheltering income. Rental losses are passive: they offset passive income freely, and up to $25,000/yr can offset ordinary (W-2) income if you actively participate and your MAGI is under $100k (phasing out to $0 by $150k); unused losses carry forward. On sale, claimed depreciation is recaptured at up to 25%, and gains may owe capital-gains tax (a 1031 exchange can defer both). Figures are a year-1 estimate at your 24.0% rate — not tax advice; consult a CPA.
Condition & rehab AI · 12 photos
This manufactured home is in good condition with modern finishes and a well-maintained exterior. Minor updates to the exterior and interior can further enhance its value.
Value-add opportunities
- Both Paint exterior siding — Fresh paint can enhance curb appeal and value
- Both Replace window blinds — New blinds can improve energy efficiency and aesthetics
- Both Install smart home devices — Modern technology can increase home's marketability
Renovation cost estimate screening
Value-add ROI direction
- Both Paint exterior siding — Fresh paint can enhance curb appeal and value ↑
- Both Replace window blinds — New blinds can improve energy efficiency and aesthetics ↑
- Both Install smart home devices — Modern technology can increase home's marketability ↑
ⓘ Cost ranges are severity-bucket heuristics (US national rule-of-thumb). Get contractor quotes + a written scope before underwriting a rehab budget.
Schools (NCES district)
- District
- Ector County ISD
- NCES district ID
- 4818000
- Math proficiency
- 22% ▼ -9.00%
- Reading proficiency
- 27% ▼ -4.00%
- Median HH income
- $52,740
- Composite
- 21.89/100
- National rank
- #8233
- State rank
- #707 of 826 in TX
Livability — Odessa
- Score
- 75/100
- State rank
- #132
- US rank
- #3928
Category grades
Schools grade is shown separately in the Schools card above.
Census & demographics
- Census place
- Odessa, TX
- County
- Ector County · 131,169 people
- City population
- 131,169
- Metro
- Odessa, TX
- Population (ZIP)
- 39,927
- Household income
- $75,272
- Rent vs Own
- Severe rent burden
- 1477.0
Population outlook (Ector County) Hauer SSP2
- Today (2025)
- 212,765 people
- By 2030
- 241,962 · +13.7%
- By 2040
- 306,582 · +44.1%
- By 2050
- 379,755 · +78.5%
- By 2075
- 568,991 · +167.4%
- By 2100
- 709,829 · +233.6%
Race, ethnicity, and origin ACS 2023
- Neighborhood character
- Diverse neighborhood (Simpson 0.58)
- Race & ethnicity
- Hispanic / Latino 52% White 38% Two or more races 22% Black 6% Asian 2% Native American 1%
- Hispanic origin (detail)
- Mexican 45% Cuban 3%
- Common ancestry
- Slovak 1% Lithuanian 1% Italian 1%
- Foreign-born
- 12% · Canada, Vietnam
- Languages at home
- 68% English-only · Spanish 30%
Political lean MEDSL · Ector
- 2024 margin
- Solid R (+52.9) · D 23.2% · R 76.1%
- 2008→2024 swing
- -4.9pp toward R · 2008: -48.0pp · 2024: -52.9pp
- All cycles
- 2024: R+52.9 2020: R+47.8 2016: R+40.6 2012: R+48.9 2008: R+48.0
Not yet ingested
- Civics
- —
Market trends
- HPI YoY
- ▼ -194.97%
- Current HPI
- 229.6022
- Rent YoY
- ▲ 1.36%
- Metro
- Odessa, TX
- State GDP YoY
- ▲ 3.95%
- F500 in state
- 110
Industry mix (Fortune 500 HQ in TX)
| Industry | F500 HQs | Revenue |
|---|---|---|
| Energy | 16 | $1,198B |
|
||
| Technology | 5 | $198B |
|
||
| Engineering / Construction | 4 | $72B |
|
||
| Energy Services | 3 | $60B |
|
||
| Utilities | 3 | $41B |
|
||
| Healthcare | 2 | $330B |
|
||
Price history
-5.8% since first listed2 events — show timeline
- 2024-05-29 Price Changed $163,000 Zillow
- 2024-05-14 Listed $172,999 Zillow
Cash-flow waterfall
monthlySold comps — $/sqft
last 12 mo · ≤1 miLoading sold comps…