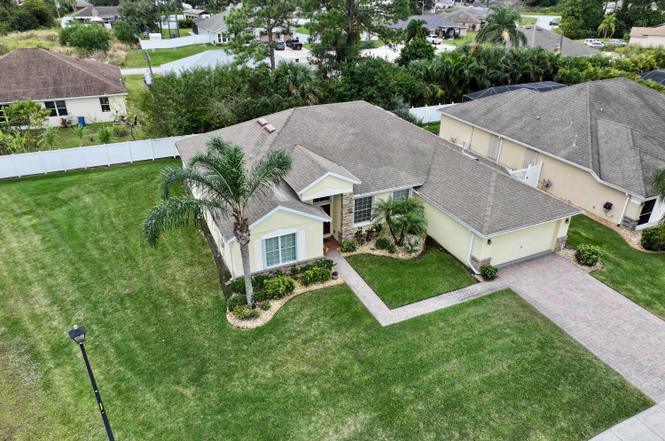
220 Grouper Cir SE · Palm Bay, FL
Flood risk 1/10 · Minimal
- FEMA flood zone
- X (unshaded)
- Chance of flooding over 30 yrs
- 0.0%
- Est. flood insurance / yr
- $507 – $1,088
Fire risk 1/10 · Minimal
- Est. fire insurance / yr
- $947 – $1,759
Heat risk 10/10 · Severe
- Hot days now (above 106°F)
- 7 days/yr
- Hot days in 30 yrs
- 22 days/yr
Wind risk 10/10 · Severe
- Chance of severe wind over 30 yrs
- 99.0%
Air-quality risk 1/10 · Minimal
- Unhealthy air days now
- 0 days/yr
- Unhealthy air days in 30 yrs
- 0 days/yr
Risk factors via First Street. Map © Google.
Why this score? — see what drove the D grade
The composite is a weighted blend of 9 inputs, each scored 0–100. Each bar is that input's sub-score; the figure is the points it added to the 100-point composite (weight × sub-score).
- Appreciation +10.0/10.0
- ARV discount +7.5/15.0
- Cash flow +6.5/30.0
- Schools +4.7/10.0
- Livability +3.6/5.0
- Rent growth +3.4/5.0
- Condition / age +2.5/5.0
- 1% rule +1.3/10.0
- DSCR +0.8/10.0
$365,000
🖨 Deal sheet (PDF) 📄 Offer letter ✓ Due diligence
Listing remarks MLS
Beautiful home in the lovely Coral Key subdivision. Built in 2013, meticulously cared for, looks barely lived in. Many features and upgrades include: Upgraded cobble stone accent on exterior, paver driveway and sidewalk. The Living, Dining & Master Bedroom have Crown Molding, High Ceilings & Arched hallways. Spacious KITCHEN offers 42'' inch maple cabinetry with crown molding, GRANITE counter tops, breakfast bar, recessed and PENDANT Lighting. Tile through out w/ carpeted bedrooms. Granite in all bathrooms. Large laundry room w/ cabinetry. Gutters recently added. Large screened in Lanai and room for a pool. Come and make this your home!
Key facts
- Double vanity
- Walk-in closet
- Walk-in shower
Tags
Property features AI
Finance
- HOA & community: HOA (Coral Key) with monthly fee of $60; HOA provides grounds maintenance
Exterior
- Parking: Attached garage with automatic garage door opener; 2-car garage
- Utilities: Natural gas connected; Public sewer; Water connected; Sewer connected
- Home design: Single-family residence; One-story; North-facing
- Construction: Block and stucco construction
- Exterior features: Covered rear porch; Screened porch; Porch; Front and rear sprinklers; Vinyl backyard fencing
Interior
- Kitchen: Dishwasher; Electric oven; Microwave; Refrigerator; Breakfast bar/nook (kitchen-adjacent)
- Bedrooms: 4 bedrooms
- Flooring: Tile; Other
- Bathrooms: 3 full bathrooms
- Heating & cooling: Heat pump heating; Central air conditioning
- Interior features: Breakfast bar; Breakfast nook; Ceiling fans; Primary bathroom with separate tub and shower; Split bedroom floor plan; Walk-in closets
- Laundry & utility: Washer and dryer included; Gas dryer hookup; Gas water heater; Water softener (owned)
Neighborhood map
What this means for you Summary
Snapshot
- This is a 4-bed/3.0-bath single-family listed at $365k.
Deal economics
- At list price, monthly cash flow is $-619 ($-7k/yr) — negative.
- To cash-flow at today's rent, offer at most $256k (30.0% below list).
- To meet the 1% rule (rent ≥ 1% of price), the offer needs to be $231k (36.7% below list).
- Recommended offer: $231k (36.7% below list) — sets the bar for 1% rule.
Location & tenants
- Location reads 72/100 on livability (#366 in FL) — a middle-class / working-renter tenant base. Strengths: cost of living A+, housing A+; Watch: employment D+, amenities F, health & safety D-.
- Brevard (suburban): math 53% / reading 57% proficiency, ranked #19 of 73 in FL (top 26%) — acceptable for families but not a draw, mixed tenant base, ~2y average lease.
- Zoned schools: John F. Turner Senior Elementary School (math 38% / reading 43%, grade F, #1,471 of 2,144 statewide, top 69%, 543 students, 69% FRL); Southwest Middle School (math 40% / reading 39%, grade F, #373 of 571 statewide, top 66%, 920 students, 58% FRL); Heritage High School (math 30% / reading 44%, grade F, #340 of 667 statewide, top 52%, 2,007 students, 62% FRL) — zoned schools average 63% FRL vs 43% district-wide (20 pts higher); higher-poverty schools than district average — tighter screening recommended.
- Zoned-school proficiency averages 39% at this address vs 55% district-wide (-16 pts) — the specific schools serving this property underperform the Brevard average; the district grade overstates school quality for this exact location.
- Market conditions: Rents rising (+3.7%/yr); 1123 active listings in the ZIP; 10 comparable units currently listed for rent nearby; rentals at typical pace (median 23d on market — plan ~3-4 weeks tenant-placement turnaround); solid renter incomes; 4,602 units permitted in Brevard County in 2024 (702 in 5+ unit buildings).
- This rent runs 35% of the median local income ($80k/yr) — at the standard rent-burdened threshold; future hikes will face affordability resistance.
Forward outlook
- In year one you build about $39k of equity ($3k loan paydown + $36k appreciation (10.0% local appreciation)).
- Brevard County population projected at +15% by 2050 — modest demand growth; plan on rents tracking national, not racing it.
- By year 2, paydown + projected appreciation supports a ~$63k cash-out refi (75% LTV) — recoverable capital for the next deal without selling this one.
Negotiation context
- It's been on market 102 days — a 9% lower offer ($332k) is reasonable based on typical stale-listing flexibility.
- 2 sale attempts since 10y ago; this cycle's ask has dropped $45k (11%) from the opening price — seller is motivated, your offer sets the floor, not the list.
- Current owner paid $251k; 45% above their basis — modest negotiation headroom, anchor on the comps not their cost.
Risks & watch-outs
- Climate carrying-cost: severe wind risk, 99% chance of damaging wind over 30y; extreme-heat days projected 7→22/yr by 2055 (HVAC capex compounding) — expect insurance premiums to compound above CPI over the hold.
Questions for the listing agent
- What do current leases actually rent for vs. the listed asking? Can we see a recent rent roll and the last 12 months of T-12 income?
- It's been on market 102 days. Have you received any prior offers? Is the seller open to a 37% concession, seller financing, or rate buy-down credit?
- What does the HOA fee cover, when was the last increase, and are there any pending special assessments or reserve-fund shortfalls?
- Why hasn't it sold? Are there any deal-killer items the seller is aware of (foundation, flood, title, zoning, code violations)?
- Is there a deadline driving the sale (1031 exchange, divorce, estate, relocation)? That informs how much negotiation room exists.
- The area grade is low — what's the realistic commute time and amenity access for the typical tenant pool here? Any planned neighborhood developments (good or bad) we should know about?
- What's the average days-on-market for RENTAL listings here right now (not sales)? A rising rental-DOM trend means longer vacancies and softer asking-rent achievability than the comps imply.
- What's the recent tenant-quality profile in this submarket — average credit score on applications, eviction rate, late-payment / NSF rate, and stable-employment percentage? A property-management company in the area should have these aggregated.
- How much new for-sale + rental construction is in the pipeline within 1–3 miles? Heavy new supply typically softens prices + rents 12–24 months out; constrained supply supports both.
Investment metrics
- 1% rule
- 0.63% ✗
- Cap rate
- 4.26%
- Cash-on-cash
- -7.27%
- DSCR
- 0.68
- GRM
- 13.2
CMA / ARV
No comps found within radius.
Projected returns pro-forma
10.0% appreciation · 3.67% rent growth · sell at horizon
- IRR
- 19.3%
- Equity multiple
- 2.57×
- Total profit
- $160,924
- Equity at exit
- $328,821
- IRR
- 17.9%
- Equity multiple
- 5.97×
- Total profit
- $508,140
- Equity at exit
- $709,115
Cash invested: $102,200 (down + closing). Projections, not guarantees.
Landlord ↔ Tenant lean methodology
- Overall (STATE)
- 87 Strongly Landlord-Friendly
- State Florida
- 87 Strongly Landlord-Friendly · R+3
- County
- — inherits STATE
- City
- — inherits STATE
ZIP-level market 32909
- Home prices YoY
- 6.0%
- Rents YoY
- 3.7%
- Active inventory
- 1123
- Price-to-rent
- 13.2×
Monthly cashflow live
- Estimated rent
- $2,311 high interval (Pro) →
- Mortgage (P&I)
- −$1,914
- Tax from tax record
- −$319 /mo · $3,823/yr
- Insurance
- −$152
- HOA
- −$60
- Vacancy / Maint / Mgmt
- −$485
- Net cashflow
- $-619
Break-even live
Sensitivity live
| Price | -10% $-412 | -5% $-516 | +0% $-619 | +5% $-722 | +10% $-826 |
|---|---|---|---|---|---|
| Rent | -10% $-802 | -5% $-710 | +0% $-619 | +5% $-528 | +10% $-436 |
| Rate | -1.0pp $-435 | -0.5pp $-526 | base $-619 | +0.5pp $-714 | +1.0pp $-810 |
UW: 25.0% down · 7.5% · 30yr · 1.5% tax · 5.0% vac · 8.0% maint · 8.0% mgmt
Financing live
Cash to close
- Down payment
- $91,250
- Closing costs
- $10,950
- Reserves months
- —
- Total cash needed
- —
Loan-product check · same deal, 3 products live
Conventional
25% down · 7.5% · 30yr
- Down + closing
- —
- Monthly P&I
- —
- Monthly cashflow
- —
- DSCR
- —
- Eligible?
- —
Personal DTI + credit; lowest rate.
DSCR
20% down · 8.5% · 30yr
- Down + closing
- —
- Monthly P&I
- —
- Monthly cashflow
- —
- DSCR
- —
- Eligible?
- —
No personal income docs; deal must DSCR.
Hard money
10% down · 12.0% · 12mo
- Down + closing
- —
- Monthly P&I
- —
- Monthly cashflow
- —
- DSCR
- —
- Eligible?
- —
Short-term bridge; refi at stabilization.
Rent comps 10 comps
| Address | Beds | Baths | Sqft | Rent | $/sqft | DOM | Units | Dist |
|---|---|---|---|---|---|---|---|---|
| 272 Aquarius Ave SE Palm Bay, FL | 4.0 | 2.0 | 1650 | $1,995 | $1.21 | 25d | 1 | 0.13mi |
| 490 Hatcher St SE Palm Bay, FL | 4.0 | 2.0 | 1833 | $2,150 | $1.17 | 23d | 1 | 0.21mi |
| 214 Eldron Blvd NE Palm Bay, FL | 3.0 | 2.0 | 1646 | $2,075 | $1.26 | 25d | 1 | 0.51mi |
| 309 Cactus St SE Palm Bay, FL | 4.0 | 2.0 | 1846 | $2,195 | $1.19 | 16d | 1 | 0.69mi |
| 296 Croquet Ave NE Palm Bay, FL | 4.0 | 2.0 | 2028 | $2,300 | $1.13 | 23d | 1 | 0.79mi |
| 334 Bordeaux Ave NE Palm Bay, FL | 4.0 | 2.0 | 2083 | $2,250 | $1.08 | 16d | 1 | 0.79mi |
| 463 Eldron Blvd NE Palm Bay, FL | 4.0 | 2.0 | 1870 | $2,800 | $1.50 | 25d | 1 | 0.97mi |
| 907 Algardi St SE Palm Bay, FL | 4.0 | 2.0 | 1943 | $2,330 | $1.20 | 25d | 1 | 1.06mi |
| 549 Burlington Ave NE Palm Bay, FL | 3.0 | 2.0 | 1608 | $2,075 | $1.29 | 16d | 1 | 1.10mi |
| 210 Meehan Ave NW Palm Bay, FL | 3.0 | 2.0 | 2020 | $1,895 | $0.94 | 16d | 1 | 1.17mi |
HOA detail
- Monthly dues
- $60 · $720/yr
- Likely covers
- pool
Listing history 9 events
-
2026-05-03status Pending
-
2026-04-23price $365,000
-
2026-03-11price $385,000
-
2026-02-16price $399,000
-
2026-01-21$410,000 Active
-
2016-02-26soldstatus $251,000 656-char remark
Show marketing remark (656 chars)
Beautiful home in the lovely Coral Key subdivision. Built in 2013, meticulously cared for, looks barely lived in. Many features and upgrades include: Upgraded cobble stone accent on exterior, paver driveway and sidewalk. The Living, Dining & Master Bedroom have Crown Molding, High Ceilings & Arched hallways. Spacious KITCHEN offers 42'' inch maple cabinetry with crown molding, GRANITE counter tops, breakfast bar, recessed and PENDANT Lighting. Tile through out w/ carpeted bedrooms. Granite in all bathrooms. Large laundry room w/ cabinetry. Gutters recently added. Large screened in Lanai and room for a pool. Come and make this your home!
-
2016-02-26soldstatus $251,000
Show marketing remark (656 chars)
Beautiful home in the lovely Coral Key subdivision. Built in 2013, meticulously cared for, looks barely lived in. Many features and upgrades include: Upgraded cobble stone accent on exterior, paver driveway and sidewalk. The Living, Dining & Master Bedroom have Crown Molding, High Ceilings & Arched hallways. Spacious KITCHEN offers 42'' inch maple cabinetry with crown molding, GRANITE counter tops, breakfast bar, recessed and PENDANT Lighting. Tile through out w/ carpeted bedrooms. Granite in all bathrooms. Large laundry room w/ cabinetry. Gutters recently added. Large screened in Lanai and room for a pool. Come and make this your home!
-
2016-01-11$254,900 656-char remark
Show marketing remark (656 chars)
Beautiful home in the lovely Coral Key subdivision. Built in 2013, meticulously cared for, looks barely lived in. Many features and upgrades include: Upgraded cobble stone accent on exterior, paver driveway and sidewalk. The Living, Dining & Master Bedroom have Crown Molding, High Ceilings & Arched hallways. Spacious KITCHEN offers 42'' inch maple cabinetry with crown molding, GRANITE counter tops, breakfast bar, recessed and PENDANT Lighting. Tile through out w/ carpeted bedrooms. Granite in all bathrooms. Large laundry room w/ cabinetry. Gutters recently added. Large screened in Lanai and room for a pool. Come and make this your home!
-
2012-11-13soldstatus $135,000
ⓘ Source: listings_history table (triggers on properties + properties_extension) + one-shot
backfill from property_details.listing_events for pre-trigger history.
Tax reassessment forecast FL · Resets to sale price
- Current annual tax
- $3,823 · $319/mo
- Projected year-2 tax
- $3,823 · $319/mo
- Expected delta
- $0/yr ($0/mo · 0.0%)
ⓘ Screening estimate from a state-policy table — verify with the county assessor before closing.
Climate risk First Street
- Flood 1/10 Low FEMA zone X (unshaded) · 0% chance over 30 yrs
- Wildfire 1/10 Low
- Heat 10/10 Extreme 7 d/yr ≥106°F today · 22 d/yr by 30 yrs out
- Wind 10/10 Extreme 99% chance of damaging wind over 30 yrs
- Air quality 1/10 Low 0 unhealthy d/yr today · 0 by 30 yrs out
Nearby sold comps map
Loading sold comps map…
Walkable amenities ~0.75 mi
Loading nearby amenities…
Taxation est. · year 1
- Rental income
- $27,735
- − Mortgage interest
- −$20,446
- − Property taxes
- −$3,823
- − Insurance
- −$1,825
- − Repairs & maintenance
- −$2,219
- − Management
- −$2,219
- − HOA
- −$720
- − Depreciation
- −$10,618
- Taxable loss
- −$14,135
- Est. tax savings @ 24.0%
- +$3,392
- After-tax cash flow
- $-4,035/yr
For passive investors: Depreciation is non-cash, so a rental often shows a tax loss while cash-flowing — sheltering income. Rental losses are passive: they offset passive income freely, and up to $25,000/yr can offset ordinary (W-2) income if you actively participate and your MAGI is under $100k (phasing out to $0 by $150k); unused losses carry forward. On sale, claimed depreciation is recaptured at up to 25%, and gains may owe capital-gains tax (a 1031 exchange can defer both). Figures are a year-1 estimate at your 24.0% rate — not tax advice; consult a CPA.
Schools (NCES district)
- District
- Brevard
- NCES district ID
- 1200150
- Math proficiency
- 53% ▼ -9.00%
- Reading proficiency
- 57% ▼ -4.00%
- Median HH income
- $49,426
- Composite
- 46.86/100
- National rank
- #2370
- State rank
- #19 of 73 in FL
Livability — Palm Bay
- Score
- 72/100
- State rank
- #366
- US rank
- #6458
Category grades
Schools grade is shown separately in the Schools card above.
Census & demographics
- Census place
- Palm Bay, FL
- County
- Brevard County · 602,871 people
- City population
- 132,211
- Metro
- Palm Bay-Melbourne-Titusville, FL
- Population (ZIP)
- 41,804
- Household income
- $79,977
- Rent vs Own
- Severe rent burden
- 697.0
Population outlook (Brevard County) Hauer SSP2
- Today (2025)
- 623,254 people
- By 2030
- 648,420 · +4.0%
- By 2040
- 690,009 · +10.7%
- By 2050
- 715,669 · +14.8%
- By 2075
- 775,744 · +24.5%
- By 2100
- 776,687 · +24.6%
Race, ethnicity, and origin ACS 2023
- Neighborhood character
- Diverse neighborhood (Simpson 0.70)
- Race & ethnicity
- White 46% Black 21% Hispanic / Latino 20% Two or more races 16% Asian 4%
- Hispanic origin (detail)
- Mexican 2% Puerto Rican 8% Cuban 5%
- Common ancestry
- Hispanic 3% Slovak 2% Lithuanian 2%
- Foreign-born
- 17% · Canada, China, Jamaica
- Languages at home
- 84% English-only · Spanish 9% French/Haitian/Cajun 4% Chinese 1%
Political lean MEDSL · Brevard
- 2024 margin
- Strong R (+20.8) · D 39.1% · R 59.9% · Other 1.0%
- 2008→2024 swing
- -10.4pp toward R · 2008: -10.4pp · 2024: -20.8pp
- All cycles
- 2024: R+20.8 2020: R+16.4 2016: R+19.8 2012: R+12.7 2008: R+10.4
Not yet ingested
- Civics
- —
Market trends
- HPI YoY
- ▲ 18.81%
- Current HPI
- 330.8595
- Rent YoY
- ▲ 3.67%
- Metro
- Palm Bay-Melbourne-Titusville, FL
- State GDP YoY
- ▲ 3.28%
- F500 in state
- 36
Industry mix (Fortune 500 HQ in FL)
| Industry | F500 HQs | Revenue |
|---|---|---|
| Industrial Technology | 2 | $29B |
|
||
| Insurance | 2 | $17B |
|
||
| Retail | 1 | $60B |
|
||
| Technology Distribution | 1 | $58B |
|
||
| Homebuilding | 1 | $35B |
|
||
| Technology Manufacturing | 1 | $35B |
|
||
Price history
+170.4% since first listed9 events — show timeline
- 2026-05-03 Pending — SCMLS
- 2026-04-23 Price Changed $365,000 SCMLS
- 2026-03-11 Price Changed $385,000 SCMLS
- 2026-02-16 Price Changed $399,000 SCMLS
- 2026-01-21 Listed $410,000 SCMLS
- 2016-02-26 Sold (Public Records) $251,000 Public Records
- 2016-02-26 Sold (MLS) $251,000 SCMLS
- 2016-01-11 Listed $254,900 SCMLS
- 2012-11-13 Sold (Public Records) $135,000 Public Records
Property tax history
+2.4%/yrLatest (2025): $3,823 · +2.5% YoY. Source: county tax records.
Cash-flow waterfall
monthlySold comps — $/sqft
last 12 mo · ≤1 miLoading sold comps…