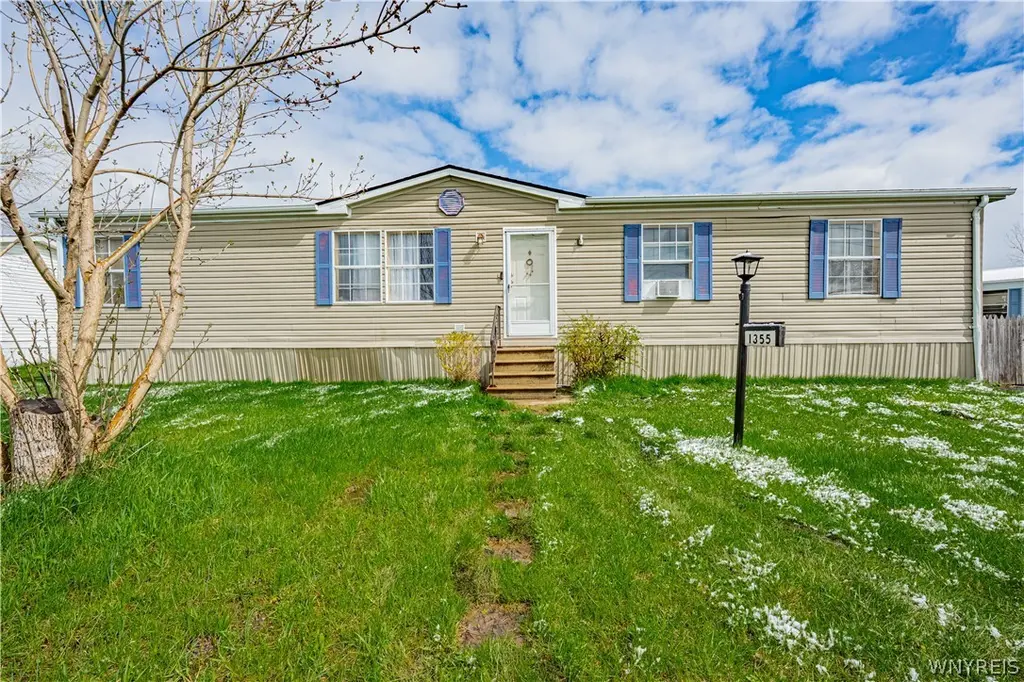
1355 Fernwood Dr · South Lockport, NY
Flood risk 6/10 · Moderate
- FEMA flood zone
- X (unshaded)
- Chance of flooding over 30 yrs
- 0.72%
- Est. flood insurance / yr
- $507 – $1,088
Fire risk 3/10 · Minor
- Est. fire insurance / yr
- $691 – $1,283
Heat risk 2/10 · Minimal
- Hot days now (above 94°F)
- 7 days/yr
- Hot days in 30 yrs
- 15 days/yr
Wind risk 1/10 · Minimal
- Chance of severe wind over 30 yrs
- —
Air-quality risk 2/10 · Minimal
- Unhealthy air days now
- 2 days/yr
- Unhealthy air days in 30 yrs
- 2 days/yr
Risk factors via First Street. Map © Google.
Why this score? — see what drove the B- grade
The composite is a weighted blend of 9 inputs, each scored 0–100. Each bar is that input's sub-score; the figure is the points it added to the 100-point composite (weight × sub-score).
- Cash flow +30.0/30.0
- 1% rule +10.0/10.0
- DSCR +10.0/10.0
- ARV discount +5.8/15.0
- Schools +3.9/10.0
- Rent growth +3.4/5.0
- Livability +3.3/5.0
- Condition / age +2.2/5.0
- Appreciation +0.0/10.0
$83,000
🖨 Deal sheet 📄 Offer letter ✓ Due diligence
Listing remarks MLS
Very large doublewide home located in The Woodlands Park. 1568 sq ft with 4 bedrooms, 2 bathrooms. Open floor plan, primary suite is located on the opposite side of the home for added privacy.
Key facts
- Oversized closet
- Woodlands community
- One-level living
Tags
Property features AI
Finance
- HOA & community: Land lease: $855
Exterior
- Parking: No garage
- Utilities: Electricity connected (circuit breakers); Public water connected; Sewer connected
- Home design: Double-wide mobile home; Single-story; Existing/resale property; Vinyl siding
- Construction: Vinyl siding construction; Double-wide body type
- Exterior features: Blacktop driveway; Partial fencing; Shed(s) / storage
Interior
- Kitchen: Gas range; Gas oven; Dishwasher; Microwave; Refrigerator; Pantry; Appliances negotiable
- Bedrooms: 4 bedrooms on the main level (all bedrooms are on the first floor)
- Flooring: Vinyl and varied flooring
- Bathrooms: 2 full bathrooms (both on the main level)
- Heating & cooling: Gas forced-air heating; Circuit breaker electric
- Interior features: Separate/formal living room; Separate/formal dining room; Eat-in kitchen; Pantry; Main level primary suite; Bedroom on main level
- Laundry & utility: Main level laundry; Washer; Dryer; Gas water heater
Neighborhood map
What this means for you Summary
Snapshot
- This is a 4-bed/2.0-bath manufactured listed at $83k. Condition is rated fair.
Deal economics
- At list price, monthly cash flow is $736 ($9k/yr) — positive.
- The deal already cash-flows at list — no discount required.
- Meets the 1% rule at list price ($2k rent vs $83k).
- Cap rate 16.9% vs local median 1.5% in South Lockport — top-decile yield for the area; either an underpriced asset or a hidden risk that comps aren't pricing in. Stress-test before assuming the spread holds.
Location & tenants
- Location reads 66/100 on livability (#633 in NY) — a middle-class / working-renter tenant base. Strengths: cost of living A+, health & safety A+; Watch: employment D+, schools F, crime F.
- Lockport City School District (town): math 44% / reading 49% proficiency, ranked #452 of 590 in NY (top 77%) — families likely to look elsewhere, expect single-tenant / working-renter base with shorter leases.
- Market conditions: Rents rising (+3.7%/yr); 357 active listings in the ZIP; solid renter incomes; 167 units permitted in Niagara County in 2024 (0 in 5+ unit buildings).
Forward outlook
- Local home prices are declining (-3.0%/yr); year-one equity from $574 of loan paydown is wiped out by about $2k of value loss. Plan a longer hold.
- Niagara County population projected at -19% by 2050 — secular population decline; favor cash flow + early exit over multi-decade hold.
- At projected returns (-3.0% appreciation + 3.7% rent growth), your $23k cash investment doubles in ~4 years — after that, you're playing with house money.
Negotiation context
- Only 11 days on market — expect competitive offers; lowballing is unlikely to land.
- 3 sale attempts with the ask held roughly flat each time — persistent listings suggest the price (not the market) is what's stuck; bring a comps-based counter.
Risks & watch-outs
- Climate carrying-cost: major flood risk — expect insurance premiums to compound above CPI over the hold.
Questions for the listing agent
- Have any recent inspections been done? Can we get a copy of the seller's disclosures and any deferred-maintenance estimates?
- Is there a deadline driving the sale (1031 exchange, divorce, estate, relocation)? That informs how much negotiation room exists.
- Schools are F-rated, which usually means shorter tenancies and higher turnover. Who's the typical renter profile here, and what's been the actual vacancy rate?
- Crime grade is F in this area — have there been break-ins, vandalism, or insurance claims at this property in the last 3 years? What carrier currently insures it and at what premium?
- What's the average days-on-market for RENTAL listings here right now (not sales)? A rising rental-DOM trend means longer vacancies and softer asking-rent achievability than the comps imply.
- What's the recent tenant-quality profile in this submarket — average credit score on applications, eviction rate, late-payment / NSF rate, and stable-employment percentage? A property-management company in the area should have these aggregated.
- How much new for-sale + rental construction is in the pipeline within 1–3 miles? Heavy new supply typically softens prices + rents 12–24 months out; constrained supply supports both.
Investment metrics
- 1% rule
- 2.00% ✓
- Cap rate
- 16.93%
- Cash-on-cash
- 37.99%
- DSCR
- 2.69
- GRM
- 4.2
CMA / ARV
- ARV (on-the-fly)
- $79,968
- Comps found
- 12
Show comp detail 12 sales within ~0.75 mi
| Address | Dist | Beds/Ba | Sqft | Sold | Price | $/sf | Match |
|---|---|---|---|---|---|---|---|
| 1218 Maplewood Dr | 0.25mi | 3/2.0 (-1) | 1,568 (0%) | 0mo | $70,000 | $45 | 83 |
| 1172 Underwood Ct | 0.21mi | 3/2.0 (-1) | 1,568 (0%) | 5mo | $80,000 | $51 | 81 |
| 1009 Ridgewood | 0.09mi | 3/2.0 (-1) | 1,461 (-7%) | 1mo | $50,000 | $34 | 79 |
| 901 Hollywood Dr | 0.20mi | 3/2.0 (-1) | 1,456 (-7%) | 2mo | $82,000 | $56 | 73 |
| 807 Fernwood Dr | 0.13mi | 3/2.0 (-1) | 1,730 (+10%) | 5mo | $82,000 | $47 | 68 |
| 519 Applewood Dr #519 | 0.45mi | 4/2.0 | 1,456 (-7%) | 5mo | $42,500 | $29 | 63 |
| 909 Hollywood Dr | 0.21mi | 3/2.0 (-1) | 1,400 (-11%) | 8mo | $80,000 | $57 | 61 |
| 643 Birchwood Dr | 0.19mi | 3/2.0 (-1) | 1,366 (-13%) | 6mo | $69,000 | $51 | 60 |
| 1070 Fernwood Dr | 0.21mi | 3/2.0 (-1) | 1,344 (-14%) | 5mo | $72,000 | $54 | 57 |
| 701 Gardenwood Dr | 0.38mi | 3/2.0 (-1) | 1,792 (+14%) | 1mo | $36,200 | $20 | 53 |
| 352 Applewood Dr | 0.50mi | 3/2.5 (-1) | 1,792 (+14%) | 5mo | $96,000 | $54 | 42 |
| 433 Chestnut Dr | 0.63mi | 3/2.0 (-1) | 1,344 (-14%) | 5mo | $55,000 | $41 | 38 |
Match score weights: distance 35% · size 25% · config 20% · recency 20%. Top-matched comps best support the ARV.
Projected returns pro-forma
-3.0% appreciation · 3.67% rent growth · sell at horizon
- IRR
- 34.8%
- Equity multiple
- 2.49×
- Total profit
- $34,557
- Equity at exit
- $12,376
- IRR
- 42.0%
- Equity multiple
- 5.10×
- Total profit
- $95,207
- Equity at exit
- $7,176
Cash invested: $23,240 (down + closing). Projections, not guarantees.
Landlord ↔ Tenant lean methodology
- Overall (STATE)
- 15 Strongly Tenant-Friendly
- State New York
- 15 Strongly Tenant-Friendly · D+10
- County
- — inherits STATE
- City
- — inherits STATE
ZIP-level market 14094
- Rents YoY
- 3.7%
- Active inventory
- 357
- Price-to-rent
- 4.2×
Monthly cashflow live
- Estimated rent
- $1,657 medium interval (Pro) →
- Mortgage (P&I)
- −$435
- Tax est. 1.5%
- −$104 /mo · $1,245/yr
- Insurance
- −$35
- HOA
- −$0
- Vacancy / Maint / Mgmt
- −$348
- Net cashflow
- $736
Break-even live
UW: 25.0% down · 7.5% · 30yr · 1.5% tax · 5.0% vac · 8.0% maint · 8.0% mgmt
Financing live
Cash to close
- Down payment
- $20,750
- Closing costs
- $2,490
- Reserves months
- —
- Total cash needed
- —
Loan-product check · same deal, 3 products live
Conventional
25% down · 7.5% · 30yr
- Down + closing
- —
- Monthly P&I
- —
- Monthly cashflow
- —
- DSCR
- —
- Eligible?
- —
Personal DTI + credit; lowest rate.
DSCR
20% down · 8.5% · 30yr
- Down + closing
- —
- Monthly P&I
- —
- Monthly cashflow
- —
- DSCR
- —
- Eligible?
- —
No personal income docs; deal must DSCR.
Hard money
10% down · 12.0% · 12mo
- Down + closing
- —
- Monthly P&I
- —
- Monthly cashflow
- —
- DSCR
- —
- Eligible?
- —
Short-term bridge; refi at stabilization.
Listing history 7 events
-
2026-05-01status Pending
-
2026-04-20$83,000 Active
-
2025-12-12soldstatus $75,000 Closed 192-char remark
Show marketing remark (192 chars)
Very large doublewide home located in The Woodlands Park. 1568 sq ft with 4 bedrooms, 2 bathrooms. Open floor plan, primary suite is located on the opposite side of the home for added privacy.
-
2025-10-20status Pending 192-char remark
Show marketing remark (192 chars)
Very large doublewide home located in The Woodlands Park. 1568 sq ft with 4 bedrooms, 2 bathrooms. Open floor plan, primary suite is located on the opposite side of the home for added privacy.
-
2025-09-29status Active 192-char remark
Show marketing remark (192 chars)
Very large doublewide home located in The Woodlands Park. 1568 sq ft with 4 bedrooms, 2 bathrooms. Open floor plan, primary suite is located on the opposite side of the home for added privacy.
-
2025-09-28status Pending 192-char remark
Show marketing remark (192 chars)
Very large doublewide home located in The Woodlands Park. 1568 sq ft with 4 bedrooms, 2 bathrooms. Open floor plan, primary suite is located on the opposite side of the home for added privacy.
-
2025-09-25$79,900 Active 192-char remark
Show marketing remark (192 chars)
Very large doublewide home located in The Woodlands Park. 1568 sq ft with 4 bedrooms, 2 bathrooms. Open floor plan, primary suite is located on the opposite side of the home for added privacy.
ⓘ Source: listings_history table (triggers on properties + properties_extension) + one-shot
backfill from property_details.listing_events for pre-trigger history.
Climate risk First Street
- Flood 6/10 Major FEMA zone X (unshaded) · 72% chance over 30 yrs
- Wildfire 3/10 Moderate
- Heat 2/10 Low 7 d/yr ≥94°F today · 15 d/yr by 30 yrs out
- Wind 1/10 Low
- Air quality 2/10 Low 2 unhealthy d/yr today · 2 by 30 yrs out
Nearby sold comps map
Loading sold comps map…
Walkable amenities ~0.75 mi
Loading nearby amenities…
Taxation est. · year 1
- Rental income
- $19,888
- − Mortgage interest
- −$4,649
- − Property taxes
- −$1,245
- − Insurance
- −$415
- − Repairs & maintenance
- −$1,591
- − Management
- −$1,591
- − Depreciation
- −$2,415
- Taxable income
- $7,982
- Est. tax owed @ 24.0%
- −$1,916
- After-tax cash flow
- $6,913/yr
For passive investors: Depreciation is non-cash, so a rental often shows a tax loss while cash-flowing — sheltering income. Rental losses are passive: they offset passive income freely, and up to $25,000/yr can offset ordinary (W-2) income if you actively participate and your MAGI is under $100k (phasing out to $0 by $150k); unused losses carry forward. On sale, claimed depreciation is recaptured at up to 25%, and gains may owe capital-gains tax (a 1031 exchange can defer both). Figures are a year-1 estimate at your 24.0% rate — not tax advice; consult a CPA.
Condition & rehab AI · 12 photos
This 4-bedroom, 2-bathroom mobile home in South Lockport, NY, requires moderate renovations to update the kitchen and bathroom, paint interior walls, and replace worn windows. These updates would significantly increase its resale and rental value.
Repairs flagged
- Moderate kitchen cabinets — dated and in need of updating
- Moderate bathroom fixtures — dated and in need of updating
- Moderate exterior siding — moderate wear
Value-add opportunities
- Both update kitchen cabinets and fixtures — modernizing the kitchen would appeal to both buyers and renters
- Both update bathroom fixtures — modernizing the bathroom would appeal to both buyers and renters
- Both paint interior walls — fresh paint would improve the home's curb appeal and interior aesthetics
- Both replace worn windows — new windows would improve energy efficiency and curb appeal
- Both trim landscaping — trimmed landscaping would improve curb appeal and make the home more inviting
Renovation cost estimate screening
| Repair item | Severity | Est. cost |
|---|---|---|
| kitchen cabinets · dated and in need of updating | Moderate | $3,000–15,000 |
| bathroom fixtures · dated and in need of updating | Moderate | $3,000–15,000 |
| exterior siding · moderate wear | Moderate | $3,000–15,000 |
| Total estimated repair cost · 3 items | $9,000–45,000 |
Value-add ROI direction
- Both update kitchen cabinets and fixtures — modernizing the kitchen would appeal to both buyers and renters ↑
- Both update bathroom fixtures — modernizing the bathroom would appeal to both buyers and renters ↑
- Both paint interior walls — fresh paint would improve the home's curb appeal and interior aesthetics ↑
- Both replace worn windows — new windows would improve energy efficiency and curb appeal ↑
- Both trim landscaping — trimmed landscaping would improve curb appeal and make the home more inviting ↑
ⓘ Cost ranges are severity-bucket heuristics (US national rule-of-thumb). Get contractor quotes + a written scope before underwriting a rehab budget.
Schools (NCES district)
- District
- Lockport City School District
- NCES district ID
- 3617670
- Math proficiency
- 44% ▼ -7.00%
- Reading proficiency
- 49% ▲ 3.00%
- Median HH income
- $43,793
- Composite
- 39.28/100
- National rank
- #3997
- State rank
- #452 of 590 in NY
Livability — South Lockport
- Score
- 66/100
- State rank
- #633
- US rank
- #11642
Category grades
Schools grade is shown separately in the Schools card above.
Census & demographics
- Census place
- South Lockport, NY
- County
- Niagara County · 157,377 people
- Metro
- Buffalo-Cheektowaga, NY
- Population (ZIP)
- 50,153
- Household income
- $75,427
- Rent vs Own
- Severe rent burden
- 1112.0
Population outlook (Niagara County) Hauer SSP2
- Today (2025)
- 204,149 people
- By 2030
- 197,900 · -3.1%
- By 2040
- 182,239 · -10.7%
- By 2050
- 165,198 · -19.1%
- By 2075
- 129,416 · -36.6%
- By 2100
- 96,222 · -52.9%
Race, ethnicity, and origin ACS 2023
- Neighborhood character
- Predominantly White (84%)
- Race & ethnicity
- White 84% Two or more races 6% Black 6% Hispanic / Latino 3%
- Common ancestry
- Romanian 9% Slovak 2% Lithuanian 2%
- Foreign-born
- 3% · Canada
- Languages at home
- 96% English-only · Spanish 1% Russian/Polish/Slavic 1% Other Indo-European 1%
Political lean MEDSL · Niagara
- 2024 margin
- R (+14.9) · D 42.5% · R 57.5%
- 2008→2024 swing
- -15.9pp toward R · 2008: 1.0pp · 2024: -14.9pp
- All cycles
- 2024: R+14.9 2020: R+9.7 2016: R+19.0 2012: D+0.6 2008: D+1.0
Not yet ingested
- Civics
- —
Market trends
- HPI YoY
- ▼ -262.57%
- Current HPI
- 303.6109
- Rent YoY
- ▲ 3.67%
- Metro
- Buffalo-Cheektowaga, NY
- State GDP YoY
- ▲ 2.60%
- F500 in state
- 92
Industry mix (Fortune 500 HQ in NY)
| Industry | F500 HQs | Revenue |
|---|---|---|
| Financial Services | 10 | $950B |
|
||
| Consumer Goods | 9 | $162B |
|
||
| Insurance | 4 | $225B |
|
||
| Telecommunications | 2 | $144B |
|
||
| Pharmaceuticals | 2 | $112B |
|
||
| Media / Entertainment | 2 | $69B |
|
||
Price history
+3.9% since first listed7 events — show timeline
- 2026-05-01 Pending — WNYREIS
- 2026-04-20 Listed $83,000 WNYREIS
- 2025-12-12 Sold (MLS) $75,000 WNYREIS
- 2025-10-20 Pending — WNYREIS
- 2025-09-29 Relisted — WNYREIS
- 2025-09-28 Pending — WNYREIS
- 2025-09-25 Listed $79,900 WNYREIS
Cash-flow waterfall
monthlySold comps — $/sqft
last 12 mo · ≤1 miLoading sold comps…