1806 Potomac Dr Unit C · Houston, TX
Flood risk 1/10 · Minimal
- FEMA flood zone
- X (unshaded)
- Chance of flooding over 30 yrs
- 0.0%
- Est. flood insurance / yr
- $507 – $1,088
Fire risk 1/10 · Minimal
- Est. fire insurance / yr
- $1,222 – $2,270
Heat risk 9/10 · Severe
- Hot days now (above 109°F)
- 7 days/yr
- Hot days in 30 yrs
- 24 days/yr
Wind risk 9/10 · Severe
- Chance of severe wind over 30 yrs
- 99.0%
Air-quality risk 2/10 · Minimal
- Unhealthy air days now
- 2 days/yr
- Unhealthy air days in 30 yrs
- 2 days/yr
Risk factors via First Street. Map © Google.
Why this score? — see what drove the D+ grade
The composite is a weighted blend of 9 inputs, each scored 0–100. Each bar is that input's sub-score; the figure is the points it added to the 100-point composite (weight × sub-score).
- ARV discount +15.0/15.0
- Cash flow +11.3/30.0
- Appreciation +4.4/10.0
- 1% rule +3.9/10.0
- Livability +3.7/5.0
- DSCR +3.3/10.0
- Schools +2.7/10.0
- Condition / age +2.5/5.0
- Rent growth +2.0/5.0
$460,000
🖨 Deal sheet (PDF) 📄 Offer letter ✓ Due diligence
Listing remarks MLS
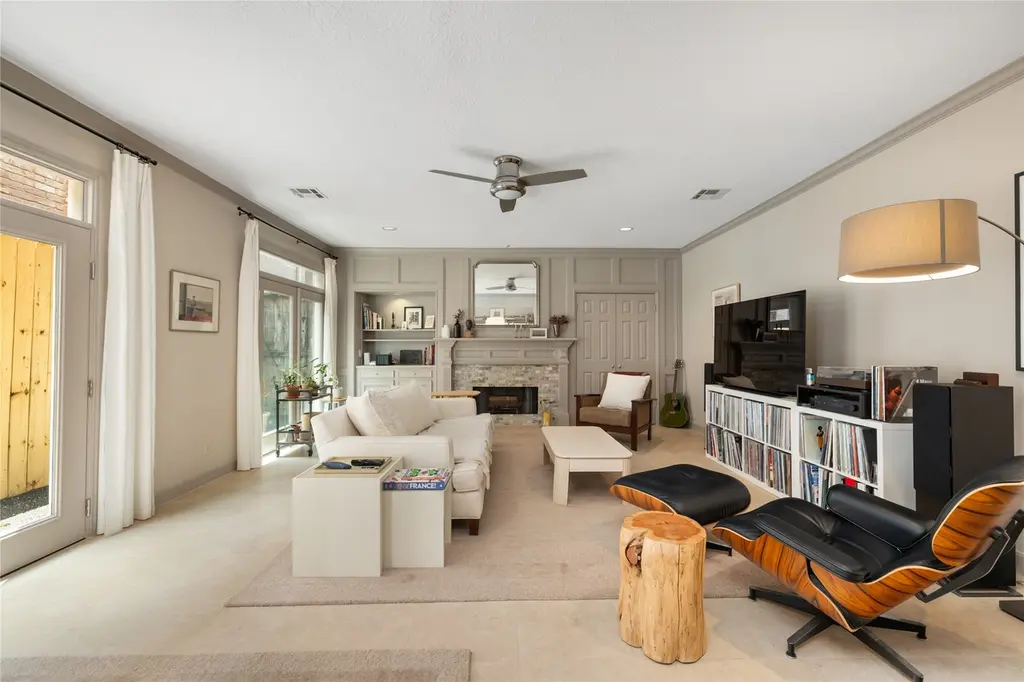
Newly renovated large townhome in Westhaven Estates, new granite countertops, stone backsplash, lighting, hardware and full GE slate appliance package in kitchen. Open living and dining space. Huge master suite w/ optional 3rd bedroom or study w/ fireplace. New roof! New flooring downstairs and new carpet upstairs. His and her closets in master and garden tub. Unit has been freshly painted in modern colors. New fixtures. 2 gas fireplaces. Turnkey!
Key facts
- $30 HOA
- 2 garage spots
- Built 1981
Property features AI
Finance
- HOA & community: Association fee $30 per month
Exterior
- Parking: Attached 2-car garage
- Utilities: Public water; Public sewer
- Home design: Residential property; 2 stories; Faces north
- Construction: Built in 1981; Brick construction; Composition roof; Slab foundation
- Exterior features: Side yard
Interior
- Kitchen: Dishwasher; Disposal; Microwave
- Bedrooms: Primary bedroom on second floor (18x24); Second-floor bedroom (22x14); Second-floor bedroom (11x14)
- Flooring: Carpet; Tile
- Bathrooms: 2 full bathrooms; 1 half bathroom
- Heating & cooling: Central heating (electric); Central air conditioning; Gas cooling
- Interior features: Gas log fireplace; Double vanity in primary bath; Granite counters; Primary bath with separate shower and tub/shower; Vanity; Ceiling fans; 7 total rooms
- Laundry & utility: Laundry in utility room
Neighborhood map
What this means for you Summary
Snapshot
- This is a 3-bed/2.5-bath townhouse listed at $460k.
Deal economics
- At list price, monthly cash flow is $-168 ($-2k/yr) — negative.
- To cash-flow at today's rent, offer at most $430k (6.4% below list).
- To meet the 1% rule (rent ≥ 1% of price), the offer needs to be $411k (10.7% below list).
- Recommended offer: $411k (10.7% below list) — sets the bar for 1% rule.
- Cap rate 5.9% vs local median 3.2% in Houston — top-decile yield for the area; either an underpriced asset or a hidden risk that comps aren't pricing in. Stress-test before assuming the spread holds.
Location & tenants
- Location reads 74/100 on livability (#184 in TX, #4,771 nationally) — a middle-class / working-renter tenant base. Strengths: amenities A+, cost of living A+, housing A+; Watch: crime F.
- Houston ISD (urban): math 27% / reading 35% proficiency, ranked #593 of 826 in TX (top 72%) — families likely to look elsewhere, expect single-tenant / working-renter base with shorter leases; 71% free/reduced lunch — lower-income household profile, screen leases tightly.
- Zoned schools: Briargrove El (math 33% / reading 42%, grade F, #1,744 of 4,322 statewide, top 41%, 836 students, 56% FRL); Tanglewood Middle (math 29% / reading 42%, grade F, #827 of 1,662 statewide, top 51%, 808 students, 62% FRL); Wisdom H S (math 17% / reading 16%, grade F, #1,497 of 1,632 statewide, top 92%, 2,260 students, 97% FRL) — zoned schools at 71% FRL track the district average.
- Market conditions: Rents soft (-1.8%/yr); 392 active listings in the ZIP; 18 comparable units currently listed for rent nearby; rentals lingering (median 46d on market — plan ~5-8 weeks vacancy on turnover, expect pricing pressure); 50% of comp listings sitting > 30 days — soft ceiling on asking rent; 29,883 units permitted in Harris County in 2024 (8,621 in 5+ unit buildings).
- At $4,109/mo this rent would consume 74% of the median local household income ($67k/yr) (locally 3533% of renters already pay >50% of income on rent) — very limited rent-growth headroom before tenants either downsize or default.
Forward outlook
- Local home prices are declining (-1.2%/yr); year-one equity from $3k of loan paydown is wiped out by about $6k of value loss. Plan a longer hold.
- Harris County population projected at +47% by 2050 — long-run rental-demand tailwind backs the buy-and-hold thesis.
Negotiation context
- It's been on market 31 days — a 3% lower offer ($446k) is reasonable based on typical stale-listing flexibility.
- 3 sale attempts since 10y ago with the ask held roughly flat each time — persistent listings suggest the price (not the market) is what's stuck; bring a comps-based counter.
Risks & watch-outs
- Climate carrying-cost: severe wind risk, 99% chance of damaging wind over 30y; extreme-heat days projected 7→24/yr by 2055 (HVAC capex compounding) — expect insurance premiums to compound above CPI over the hold.
Questions for the listing agent
- What do current leases actually rent for vs. the listed asking? Can we see a recent rent roll and the last 12 months of T-12 income?
- It's been on market 31 days. Have you received any prior offers? Is the seller open to a 11% concession, seller financing, or rate buy-down credit?
- What does the HOA fee cover, when was the last increase, and are there any pending special assessments or reserve-fund shortfalls?
- Is there a deadline driving the sale (1031 exchange, divorce, estate, relocation)? That informs how much negotiation room exists.
- Schools are D-rated, which usually means shorter tenancies and higher turnover. Who's the typical renter profile here, and what's been the actual vacancy rate?
- Crime grade is F in this area — have there been break-ins, vandalism, or insurance claims at this property in the last 3 years? What carrier currently insures it and at what premium?
- The area grade is low — what's the realistic commute time and amenity access for the typical tenant pool here? Any planned neighborhood developments (good or bad) we should know about?
- What's the average days-on-market for RENTAL listings here right now (not sales)? A rising rental-DOM trend means longer vacancies and softer asking-rent achievability than the comps imply.
- What's the recent tenant-quality profile in this submarket — average credit score on applications, eviction rate, late-payment / NSF rate, and stable-employment percentage? A property-management company in the area should have these aggregated.
- How much new for-sale + rental construction is in the pipeline within 1–3 miles? Heavy new supply typically softens prices + rents 12–24 months out; constrained supply supports both.
Investment metrics
- 1% rule
- 0.89% ✗
- Cap rate
- 5.86%
- Cash-on-cash
- -1.56%
- DSCR
- 0.93
- GRM
- 9.3
CMA / ARV
- ARV (on-the-fly)
- $650,948
- Comps found
- 12
Show comp detail 12 sales within ~0.75 mi
| Address | Dist | Beds/Ba | Sqft | Sold | Price | $/sf | Match |
|---|---|---|---|---|---|---|---|
| 1918 Potomac Dr Unit A | 0.10mi | 3/3.5 | 2,940 (-2%) | 3mo | $875,000 | $298 | 86 |
| 1526 Potomac Dr | 0.23mi | 3/3.5 | 3,041 (+2%) | 5mo | $675,000 | $222 | 78 |
| 2004 Nantucket Dr Unit C | 0.15mi | 3/2.5 | 2,574 (-14%) | 1mo | $450,000 | $175 | 69 |
| 2401 Potomac Dr | 0.46mi | 3/2.5 | 2,898 (-3%) | 8mo | $615,000 | $212 | 67 |
| 6000 Sugar Hill Dr #12 | 0.59mi | 3/2.5 | 2,876 (-4%) | 2mo | $519,000 | $180 | 64 |
| 5779 Doliver Dr | 0.59mi | 3/2.5 | 2,746 (-8%) | 1mo | $599,990 | $218 | 58 |
| 6103 Valley Forge Dr Unit C | 0.33mi | 3/4.5 | 3,244 (+9%) | 6mo | $739,000 | $228 | 57 |
| 5794 Doliver Dr | 0.56mi | 4/2.5 (+1) | 3,096 (+4%) | 7mo | $629,500 | $203 | 57 |
| 2506 Potomac Dr Unit A | 0.55mi | 3/2.5 | 2,690 (-10%) | 2mo | $535,000 | $199 | 56 |
| 2525 Nantucket Dr #2 | 0.65mi | 4/3.5 (+1) | 3,014 (+1%) | 8mo | $699,000 | $232 | 52 |
| 6024 Burgoyne Rd | 0.42mi | 4/4.5 (+1) | 3,151 (+6%) | 7mo | $925,000 | $294 | 52 |
| 6007 Potomac Park Dr | 0.65mi | 3/3.5 | 3,178 (+6%) | 4mo | $650,000 | $205 | 52 |
Match score weights: distance 35% · size 25% · config 20% · recency 20%. Top-matched comps best support the ARV.
Projected returns pro-forma
-1.23% appreciation · 0.0% rent growth · sell at horizon
- IRR
- -11.7%
- Equity multiple
- 0.52×
- Total profit
- $-61,939
- Equity at exit
- $105,941
- IRR
- -7.9%
- Equity multiple
- 0.37×
- Total profit
- $-80,800
- Equity at exit
- $106,959
Cash invested: $128,800 (down + closing). Projections, not guarantees.
Landlord ↔ Tenant lean methodology
- Overall (STATE)
- 87 Strongly Landlord-Friendly
- State Texas
- 87 Strongly Landlord-Friendly · R+5
- County
- — inherits STATE
- City
- — inherits STATE
ZIP-level market 77057
- Home prices YoY
- -0.7%
- Rents YoY
- -1.8%
- Active inventory
- 392
- Price-to-rent
- 9.3×
Monthly cashflow live
- Estimated rent
- $4,109 high interval (Pro) →
- Mortgage (P&I)
- −$2,412
- Tax from tax record
- −$780 /mo · $9,355/yr
- Insurance
- −$192
- HOA
- −$30
- Vacancy / Maint / Mgmt
- −$863
- Net cashflow
- $-168
Break-even live
Sensitivity live
| Price | -10% $93 | -5% $-37 | +0% $-168 | +5% $-298 | +10% $-428 |
|---|---|---|---|---|---|
| Rent | -10% $-492 | -5% $-330 | +0% $-168 | +5% $-5 | +10% $157 |
| Rate | -1.0pp $64 | -0.5pp $-51 | base $-168 | +0.5pp $-287 | +1.0pp $-408 |
UW: 25.0% down · 7.5% · 30yr · 1.5% tax · 5.0% vac · 8.0% maint · 8.0% mgmt
Financing live
Cash to close
- Down payment
- $115,000
- Closing costs
- $13,800
- Reserves months
- —
- Total cash needed
- —
Loan-product check · same deal, 3 products live
Conventional
25% down · 7.5% · 30yr
- Down + closing
- —
- Monthly P&I
- —
- Monthly cashflow
- —
- DSCR
- —
- Eligible?
- —
Personal DTI + credit; lowest rate.
DSCR
20% down · 8.5% · 30yr
- Down + closing
- —
- Monthly P&I
- —
- Monthly cashflow
- —
- DSCR
- —
- Eligible?
- —
No personal income docs; deal must DSCR.
Hard money
10% down · 12.0% · 12mo
- Down + closing
- —
- Monthly P&I
- —
- Monthly cashflow
- —
- DSCR
- —
- Eligible?
- —
Short-term bridge; refi at stabilization.
Rent comps 18 comps
| Address | Beds | Baths | Sqft | Rent | $/sqft | DOM | Units | Dist |
|---|---|---|---|---|---|---|---|---|
| 2226 Nantucket Dr Unit A Houston, TX | 3.0 | 2.5 | 2304 | $2,600 | $1.13 | 26d | 1 | 0.32mi |
| 2425 Fountain View Dr Unit 210 Houston, TX | 2.0 | 1.0 | 2410 | $2,000 | $0.83 | 45d | 1 | 0.64mi |
| 2454 Bering Dr Houston, TX | 3.0 | 2.5 | 2150 | $2,800 | $1.30 | 45d | 1 | 0.70mi |
| 1268 Wood Hollow Dr Houston, TX | 3.0 | 3.0 | 2324 | $4,875 | $2.10 | 0d | 1 | 0.73mi |
| 5914 Val Verde St Houston, TX | 3.0 | 4.0 | 2036 | $3,900 | $1.92 | 45d | 1 | 0.86mi |
| 5733 Winsome Ln Houston, TX | 3.0 | 3.5 | 2481 | $4,000 | $1.61 | 14d | 1 | 1.02mi |
| 2914 El Fenice Ln Unit 1538927P Houston, TX | 3.0 | 2.5 | 2249 | $7,906 | $3.52 | 16d | 1 | 1.07mi |
| 2927 El Fenice Ln Houston, TX | 3.0 | 3.0 | 2181 | $3,200 | $1.47 | 45d | 1 | 1.09mi |
| 2926 El Fenice Ln Unit 1514060P Houston, TX | 3.0 | 2.5 | 2174 | $6,326 | $2.91 | 1d | 1 | 1.10mi |
| 2926 El Fenice Ln Unit 1514061P Houston, TX | 3.0 | 2.5 | 2292 | $6,039 | $2.63 | 45d | 1 | 1.10mi |
| 2909 El Fenice Ln Unit 1538926P Houston, TX | 3.0 | 2.5 | 2249 | $7,906 | $3.52 | 17d | 1 | 1.11mi |
| 2910 El Fenice Ln Unit 1538928P Houston, TX | 3.0 | 2.5 | 2249 | $6,426 | $2.86 | 7d | 1 | 1.11mi |
| 5640 Dolores St Houston, TX | 3.0 | 4.0 | 2144 | $3,999 | $1.87 | 45d | 1 | 1.11mi |
| 5615 Winsome Ln Houston, TX | 4.0 | 4.0 | 3150 | $3,195 | $1.01 | 45d | 1 | 1.11mi |
| 2912 El Fenice Ln Unit 1538929P Houston, TX | 3.0 | 2.5 | 2249 | $7,906 | $3.52 | 22d | 1 | 1.12mi |
| 2908 El Fenice Ln Unit 1538925P Houston, TX | 3.0 | 2.5 | 2249 | $7,906 | $3.52 | 16d | 1 | 1.13mi |
| 5815 Fairdale Ln Houston, TX | 3.0 | 4.0 | 2047 | $2,800 | $1.37 | 45d | 1 | 1.15mi |
| 5625 Dolores St Houston, TX | 4.0 | 4.0 | 2935 | $4,500 | $1.53 | 45d | 1 | 1.17mi |
HOA detail
- Monthly dues
- $30 · $360/yr
- Likely covers
- gas
Listing history 24 events
-
2026-06-21days on market $460,000 Pending 31 DOM
-
2026-06-18days on market $460,000 Pending 28 DOM
-
2026-06-17statusdays on market $460,000 Pending 27 DOM
-
2026-06-16days on market $460,000 Active 26 DOM
-
2026-06-15days on market $460,000 Active 25 DOM
-
2026-06-13days on market $460,000 Active 23 DOM
-
2026-06-10days on market $460,000 Active 19 DOM
-
2026-06-08days on market $460,000 Active 18 DOM
-
2026-06-07days on market $460,000 Active 17 DOM
-
2026-06-04pricedays on market $460,000 Active 14 DOM
-
2026-06-01days on market $475,000 Active 11 DOM
-
2026-05-31days on market $475,000 Active 10 DOM
-
2026-05-21$475,000 Active
-
2026-05-19historical $475,000
-
2016-11-02soldstatus Sold 451-char remark
Show marketing remark (451 chars)
Newly renovated large townhome in Westhaven Estates, new granite countertops, stone backsplash, lighting, hardware and full GE slate appliance package in kitchen. Open living and dining space. Huge master suite w/ optional 3rd bedroom or study w/ fireplace. New roof! New flooring downstairs and new carpet upstairs. His and her closets in master and garden tub. Unit has been freshly painted in modern colors. New fixtures. 2 gas fireplaces. Turnkey!
-
2016-09-28status Pending 451-char remark
Show marketing remark (451 chars)
Newly renovated large townhome in Westhaven Estates, new granite countertops, stone backsplash, lighting, hardware and full GE slate appliance package in kitchen. Open living and dining space. Huge master suite w/ optional 3rd bedroom or study w/ fireplace. New roof! New flooring downstairs and new carpet upstairs. His and her closets in master and garden tub. Unit has been freshly painted in modern colors. New fixtures. 2 gas fireplaces. Turnkey!
-
2016-09-19status Option Pending 451-char remark
Show marketing remark (451 chars)
Newly renovated large townhome in Westhaven Estates, new granite countertops, stone backsplash, lighting, hardware and full GE slate appliance package in kitchen. Open living and dining space. Huge master suite w/ optional 3rd bedroom or study w/ fireplace. New roof! New flooring downstairs and new carpet upstairs. His and her closets in master and garden tub. Unit has been freshly painted in modern colors. New fixtures. 2 gas fireplaces. Turnkey!
-
2016-09-08price $449,900 451-char remark
Show marketing remark (451 chars)
Newly renovated large townhome in Westhaven Estates, new granite countertops, stone backsplash, lighting, hardware and full GE slate appliance package in kitchen. Open living and dining space. Huge master suite w/ optional 3rd bedroom or study w/ fireplace. New roof! New flooring downstairs and new carpet upstairs. His and her closets in master and garden tub. Unit has been freshly painted in modern colors. New fixtures. 2 gas fireplaces. Turnkey!
-
2016-07-25historical
Show marketing remark (451 chars)
Newly renovated large townhome in Westhaven Estates, new granite countertops, stone backsplash, lighting, hardware and full GE slate appliance package in kitchen. Open living and dining space. Huge master suite w/ optional 3rd bedroom or study w/ fireplace. New roof! New flooring downstairs and new carpet upstairs. His and her closets in master and garden tub. Unit has been freshly painted in modern colors. New fixtures. 2 gas fireplaces. Turnkey!
-
2016-07-25$475,000 Active 451-char remark
Show marketing remark (451 chars)
Newly renovated large townhome in Westhaven Estates, new granite countertops, stone backsplash, lighting, hardware and full GE slate appliance package in kitchen. Open living and dining space. Huge master suite w/ optional 3rd bedroom or study w/ fireplace. New roof! New flooring downstairs and new carpet upstairs. His and her closets in master and garden tub. Unit has been freshly painted in modern colors. New fixtures. 2 gas fireplaces. Turnkey!
-
2016-06-28price $485,000
-
2016-04-11price $499,000
-
2016-03-23$515,000 Active
-
1988-08-25soldstatus
ⓘ Source: listings_history table (triggers on properties + properties_extension) + one-shot
backfill from property_details.listing_events for pre-trigger history.
Tax reassessment forecast TX · Resets to sale price
- Current annual tax
- $9,355 · $780/mo
- Projected year-2 tax
- $9,355 · $780/mo
- Expected delta
- $0/yr ($0/mo · 0.0%)
ⓘ Screening estimate from a state-policy table — verify with the county assessor before closing.
Climate risk First Street
- Flood 1/10 Low FEMA zone X (unshaded) · 0% chance over 30 yrs
- Wildfire 1/10 Low
- Heat 9/10 Extreme 7 d/yr ≥109°F today · 24 d/yr by 30 yrs out
- Wind 9/10 Extreme 99% chance of damaging wind over 30 yrs
- Air quality 2/10 Low 2 unhealthy d/yr today · 2 by 30 yrs out
Nearby sold comps map
Loading sold comps map…
Walkable amenities ~0.75 mi
Loading nearby amenities…
Taxation est. · year 1
- Rental income
- $49,305
- − Mortgage interest
- −$25,767
- − Property taxes
- −$9,355
- − Insurance
- −$2,300
- − Repairs & maintenance
- −$3,944
- − Management
- −$3,944
- − HOA
- −$360
- − Depreciation
- −$13,382
- Taxable loss
- −$9,748
- Est. tax savings @ 24.0%
- +$2,339
- After-tax cash flow
- $328/yr
For passive investors: Depreciation is non-cash, so a rental often shows a tax loss while cash-flowing — sheltering income. Rental losses are passive: they offset passive income freely, and up to $25,000/yr can offset ordinary (W-2) income if you actively participate and your MAGI is under $100k (phasing out to $0 by $150k); unused losses carry forward. On sale, claimed depreciation is recaptured at up to 25%, and gains may owe capital-gains tax (a 1031 exchange can defer both). Figures are a year-1 estimate at your 24.0% rate — not tax advice; consult a CPA.
Schools (NCES district)
- District
- Houston ISD
- NCES district ID
- 4823640
- Math proficiency
- 27% ▼ -18.00%
- Reading proficiency
- 35% ▼ -6.00%
- Median HH income
- $46,054
- Composite
- 26.63/100
- National rank
- #7173
- State rank
- #593 of 826 in TX
Livability — Houston
- Score
- 74/100
- State rank
- #184
- US rank
- #4771
Category grades
Schools grade is shown separately in the Schools card above.
Census & demographics
- Census place
- Houston, TX
- County
- Harris County · 4,702,590 people
- City population
- 3,226,434
- Metro
- Houston-The Woodlands-Sugar Land, TX
- Population (ZIP)
- 46,569
- Household income
- $66,971
- Rent vs Own
- Severe rent burden
- 3533.0
Population outlook (Harris County) Hauer SSP2
- Today (2025)
- 5,571,493 people
- By 2030
- 6,089,821 · +9.3%
- By 2040
- 7,142,806 · +28.2%
- By 2050
- 8,185,864 · +46.9%
- By 2075
- 10,574,329 · +89.8%
- By 2100
- 12,109,958 · +117.4%
Race, ethnicity, and origin ACS 2023
- Neighborhood character
- Diverse neighborhood (Simpson 0.69)
- Race & ethnicity
- Hispanic / Latino 38% White 37% Two or more races 22% Black 12% Asian 10% Native American 1%
- Hispanic origin (detail)
- Mexican 13% Cuban 1%
- Common ancestry
- Italian 3% Lithuanian 2% Slovak 1%
- Foreign-born
- 38% · Canada, China, Jamaica
- Languages at home
- 50% English-only · Spanish 33% Other Indo-European 6% Other Asian/Pacific 3%
Political lean MEDSL · Harris
- 2024 margin
- Lean D (+5.5) · D 52.0% · R 46.4% · Other 1.6%
- 2008→2024 swing
- +3.9pp toward D · 2008: 1.6pp · 2024: 5.5pp
- All cycles
- 2024: D+5.5 2020: D+13.3 2016: D+12.4 2012: D+0.1 2008: D+1.6
Not yet ingested
- Civics
- —
Market trends
- HPI YoY
- ▼ -1.23%
- Current HPI
- 167.8863
- Rent YoY
- ▼ -1.83%
- Metro
- Houston-The Woodlands-Sugar Land, TX
- State GDP YoY
- ▲ 3.95%
- F500 in state
- 110
Industry mix (Fortune 500 HQ in TX)
| Industry | F500 HQs | Revenue |
|---|---|---|
| Energy | 16 | $1,198B |
|
||
| Technology | 5 | $198B |
|
||
| Engineering / Construction | 4 | $72B |
|
||
| Energy Services | 3 | $60B |
|
||
| Utilities | 3 | $41B |
|
||
| Healthcare | 2 | $330B |
|
||
Price history
-7.8% since first listed12 events — show timeline
- 2026-05-21 Listed $475,000 HARMLS
- 2026-05-19 Coming Soon $475,000 HARMLS
- 2016-11-02 Sold (MLS) — HARMLS
- 2016-09-28 Pending — HARMLS
- 2016-09-19 Pending — HARMLS
- 2016-09-08 Price Changed $449,900 HARMLS
- 2016-07-25 Listing Removed — HARMLS
- 2016-07-25 Listed $475,000 HARMLS
- 2016-06-28 Price Changed $485,000 HARMLS
- 2016-04-11 Price Changed $499,000 HARMLS
- 2016-03-23 Listed $515,000 HARMLS
- 1988-08-25 Sold (Public Records) — Public Records
Property tax history
+1.3%/yrLatest (2025): $9,355 · +4.4% YoY. Source: county tax records.
Cash-flow waterfall
monthlySold comps — $/sqft
last 12 mo · ≤1 miLoading sold comps…