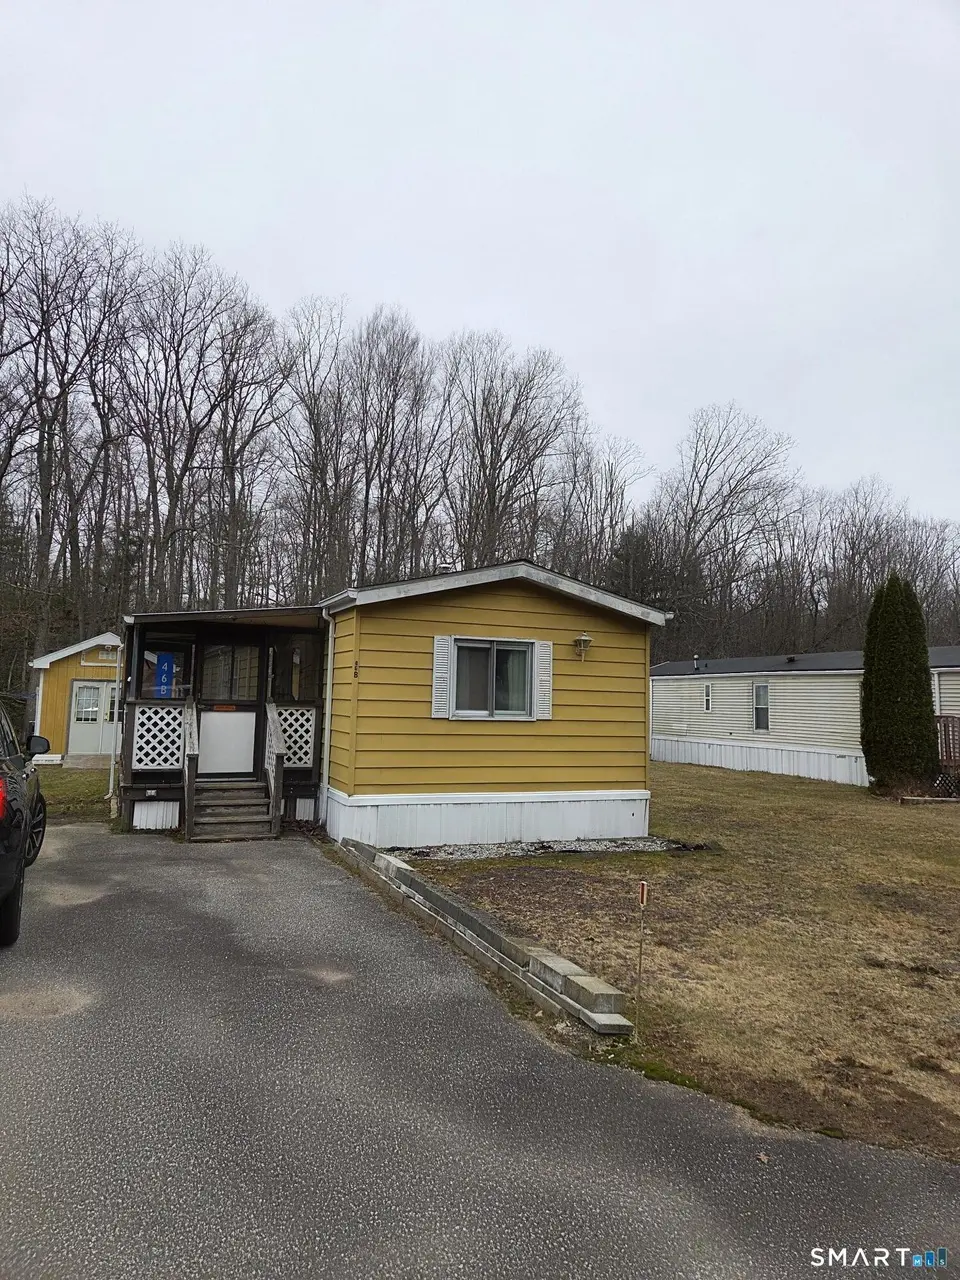
46 Edstrom Rd Lot B · Marlborough, CT
Flood risk 9/10 · Severe
- FEMA flood zone
- X (unshaded)
- Chance of flooding over 30 yrs
- 0.99%
- Est. flood insurance / yr
- $507 – $1,088
Fire risk 3/10 · Minor
- Est. fire insurance / yr
- $829 – $1,539
Heat risk 4/10 · Minor
- Hot days now (above 95°F)
- 7 days/yr
- Hot days in 30 yrs
- 16 days/yr
Wind risk 6/10 · Moderate
- Chance of severe wind over 30 yrs
- 27.0%
Air-quality risk 3/10 · Minor
- Unhealthy air days now
- 3 days/yr
- Unhealthy air days in 30 yrs
- 4 days/yr
Risk factors via First Street. Map © Google.
Why this score? — see what drove the B grade
The composite is a weighted blend of 9 inputs, each scored 0–100. Each bar is that input's sub-score; the figure is the points it added to the 100-point composite (weight × sub-score).
- Cash flow +30.0/30.0
- 1% rule +10.0/10.0
- DSCR +10.0/10.0
- ARV discount +7.5/15.0
- Schools +5.6/10.0
- Rent growth +2.5/5.0
- Livability +2.5/5.0
- Condition / age +2.5/5.0
- Appreciation +0.0/10.0
$50,000
🖨 Deal sheet 📄 Offer letter ✓ Due diligence
Listing remarks
Tucked away in a peaceful setting in Marlborough, this spacious mobile home offers large, comfortable rooms and a warm, inviting layout. Enjoy cozy evenings by the pellet stove, along with the added convenience of a generator for peace of mind. The home is in move-in condition with newer windows and a brand-new water heater installed on 3/23/26, while still offering an opportunity to add your own updates and personal touches. Outside, you'll find three sheds-including one perfect for a charming she-shed/workshop/studio-and a unique bridge leading over a small stream to a private, wooded area behind the home, creating a truly special retreat-like setting.
Key facts
- Water heater
- Pellet stove
- Newer windows
Tags
Property features AI
Finance
- Other: Nearby amenities include a lake and medical facilities
- HOA & community: Homeowners association with monthly fee; HOA fee $750 monthly; HOA covers trash pickup, snow removal, property management, and road maintenance
Exterior
- Parking: Off-street parking; 2 parking spaces
- Utilities: Shared well water; Septic sewage system; Power: propane-fueled systems with above-ground fuel tank
- Home design: Single-family home for sale; On leased land; Prefabricated construction; Mustard exterior color
- Construction: Asphalt shingle roof; Aluminum siding; No foundation specified (None listed); Prefab construction
- Exterior features: Enclosed porch; Open porch; Covered deck; Yard shed; Open lot
Interior
- Kitchen: Oven/Range; Microwave; Range hood; Refrigerator
- Bedrooms: 2 bedrooms
- Bathrooms: 2 full bathrooms
- Heating & cooling: Hot air heat via propane; Window cooling unit(s); Propane hot water (domestic)
- Interior features: Cable available; Total of 4 rooms; No basement
- Laundry & utility: Washer and dryer included; Laundry located outside bedroom in hallway on the main level
Neighborhood map
What this means for you Summary
Snapshot
- This is a 2-bed/2.0-bath manufactured listed at $50k.
Deal economics
- At list price, monthly cash flow is $415 ($5k/yr) — positive.
- The deal already cash-flows at list — no discount required.
- Meets the 1% rule at list price ($2k rent vs $50k).
- Recommended offer: $48k (3.0% below list) — sets the bar for market timing.
Location & tenants
- Location reads: area grade B — affects rentability + tenant quality, not the cash-flow math above.
- Regional School District 08 (rural): math 54% / reading 65% proficiency, ranked #34 of 153 in CT (top 22%) — acceptable for families but not a draw, mixed tenant base, ~2y average lease; only 6% free/reduced lunch — higher-income household profile.
- Market conditions: 24 active listings in the ZIP; 1,867 units permitted in Capitol Planning Region in 2024 (1,399 in 5+ unit buildings).
Forward outlook
- Local home prices are declining (-3.0%/yr); year-one equity from $346 of loan paydown is wiped out by about $2k of value loss. Plan a longer hold.
- At projected returns (-3.0% appreciation + 3.0% rent growth), your $14k cash investment doubles in ~4 years — after that, you're playing with house money.
Negotiation context
- It's been on market 35 days — a 3% lower offer ($48k) is reasonable based on typical stale-listing flexibility.
- 2 sale attempts with the ask held roughly flat each time — persistent listings suggest the price (not the market) is what's stuck; bring a comps-based counter.
- Current owner paid $32k; list at $50k implies a 56% gain — meaningful room to come down on a strong offer.
Risks & watch-outs
- Watch-outs: flood insurance adds $66/mo; HOA is 37% of rent.
- Climate carrying-cost: severe flood risk; major wind risk, 27% chance of damaging wind over 30y — expect insurance premiums to compound above CPI over the hold.
Questions for the listing agent
- It's been on market 35 days. Have you received any prior offers? Is the seller open to a 3% concession, seller financing, or rate buy-down credit?
- What's the actual annual flood-insurance premium (NFIP or private), and is the property in a SFHA with mandatory coverage?
- What does the HOA fee cover, when was the last increase, and are there any pending special assessments or reserve-fund shortfalls?
- Is there a deadline driving the sale (1031 exchange, divorce, estate, relocation)? That informs how much negotiation room exists.
- What's the average days-on-market for RENTAL listings here right now (not sales)? A rising rental-DOM trend means longer vacancies and softer asking-rent achievability than the comps imply.
- What's the recent tenant-quality profile in this submarket — average credit score on applications, eviction rate, late-payment / NSF rate, and stable-employment percentage? A property-management company in the area should have these aggregated.
- How much new for-sale + rental construction is in the pipeline within 1–3 miles? Heavy new supply typically softens prices + rents 12–24 months out; constrained supply supports both.
Investment metrics
- 1% rule
- 4.01% ✓
- Cap rate
- 17.85%
- Cash-on-cash
- 41.29%
- DSCR
- 2.84
- GRM
- 2.1
CMA / ARV
No comps found within radius.
Projected returns pro-forma
-3.0% appreciation · 3.0% rent growth · sell at horizon
- IRR
- 31.9%
- Equity multiple
- 2.35×
- Total profit
- $18,879
- Equity at exit
- $7,455
- IRR
- 39.2%
- Equity multiple
- 4.76×
- Total profit
- $52,673
- Equity at exit
- $4,323
Cash invested: $14,000 (down + closing). Projections, not guarantees.
Landlord ↔ Tenant lean methodology
- Overall (STATE)
- 27 Tenant-Leaning
- State Connecticut
- 27 Tenant-Leaning · D+7
- County
- — inherits STATE
- City
- — inherits STATE
ZIP-level market 06447
- Home prices YoY
- -24.0%
- Active inventory
- 24
- Price-to-rent
- 2.1×
Monthly cashflow live
- Estimated rent
- $2,006 medium interval (Pro) →
- Mortgage (P&I)
- −$262
- Tax from tax record
- −$70 /mo · $845/yr
- Insurance
- −$21
- Flood insurance flood zone
- −$66 /mo · $798/yr
- HOA
- −$750
- Vacancy / Maint / Mgmt
- −$421
- Net cashflow
- $415
Break-even live
UW: 25.0% down · 7.5% · 30yr · 1.5% tax · 5.0% vac · 8.0% maint · 8.0% mgmt
Financing live
Cash to close
- Down payment
- $12,500
- Closing costs
- $1,500
- Reserves months
- —
- Total cash needed
- —
Loan-product check · same deal, 3 products live
Conventional
25% down · 7.5% · 30yr
- Down + closing
- —
- Monthly P&I
- —
- Monthly cashflow
- —
- DSCR
- —
- Eligible?
- —
Personal DTI + credit; lowest rate.
DSCR
20% down · 8.5% · 30yr
- Down + closing
- —
- Monthly P&I
- —
- Monthly cashflow
- —
- DSCR
- —
- Eligible?
- —
No personal income docs; deal must DSCR.
Hard money
10% down · 12.0% · 12mo
- Down + closing
- —
- Monthly P&I
- —
- Monthly cashflow
- —
- DSCR
- —
- Eligible?
- —
Short-term bridge; refi at stabilization.
HOA detail
- Monthly dues
- $750 · $9,000/yr
- Likely covers
- water
Listing history 19 events
-
2026-06-18days on market $50,000 Active 35 DOM
-
2026-06-17days on market $50,000 Active 34 DOM
-
2026-06-16days on market $50,000 Active 33 DOM
-
2026-06-15days on market $50,000 Active 32 DOM
-
2026-06-13days on market $50,000 Active 30 DOM
-
2026-06-13days on market $50,000 Active 29 DOM
-
2026-06-10days on market $50,000 Active 27 DOM
-
2026-06-09days on market $50,000 Active 26 DOM
-
2026-06-08days on market $50,000 Active 25 DOM
-
2026-06-07days on market $50,000 Active 24 DOM
-
2026-06-05days on market $50,000 Active 21 DOM
-
2026-06-03days on market $50,000 Active 20 DOM
-
2026-06-02days on market $50,000 Active 19 DOM
-
2026-06-01days on market $50,000 Active 18 DOM
-
2026-05-31days on market $50,000 Active 17 DOM
-
2026-05-19status Active
-
2026-03-27historical
-
2026-03-21$50,000 Active
-
1988-04-28soldstatus $32,000
ⓘ Source: listings_history table (triggers on properties + properties_extension) + one-shot
backfill from property_details.listing_events for pre-trigger history.
Tax reassessment forecast CT · Partial reset (capped growth)
- Current annual tax
- $845 · $70/mo
- Projected year-2 tax
- $958 · $80/mo
- Expected delta
- +$112/yr (+$9/mo · 13.3%)
ⓘ Screening estimate from a state-policy table — verify with the county assessor before closing.
Climate risk First Street
- Flood 9/10 Extreme FEMA zone X (unshaded) · 99% chance over 30 yrs
- Wildfire 3/10 Moderate
- Heat 4/10 Moderate 7 d/yr ≥95°F today · 16 d/yr by 30 yrs out
- Wind 6/10 Major 27% chance of damaging wind over 30 yrs
- Air quality 3/10 Moderate 3 unhealthy d/yr today · 4 by 30 yrs out
Nearby sold comps map
Loading sold comps map…
Walkable amenities ~0.75 mi
Loading nearby amenities…
Taxation est. · year 1
- Rental income
- $24,078
- − Mortgage interest
- −$2,801
- − Property taxes
- −$845
- − Insurance
- −$1,048
- − Repairs & maintenance
- −$1,926
- − Management
- −$1,926
- − HOA
- −$9,000
- − Depreciation
- −$1,455
- Taxable income
- $5,077
- Est. tax owed @ 24.0%
- −$1,219
- After-tax cash flow
- $3,764/yr
For passive investors: Depreciation is non-cash, so a rental often shows a tax loss while cash-flowing — sheltering income. Rental losses are passive: they offset passive income freely, and up to $25,000/yr can offset ordinary (W-2) income if you actively participate and your MAGI is under $100k (phasing out to $0 by $150k); unused losses carry forward. On sale, claimed depreciation is recaptured at up to 25%, and gains may owe capital-gains tax (a 1031 exchange can defer both). Figures are a year-1 estimate at your 24.0% rate — not tax advice; consult a CPA.
Schools (NCES district)
- District
- Regional School District 08
- NCES district ID
- 0903750
- Math proficiency
- 54% ▼ -6.00%
- Reading proficiency
- 65% ▼ -6.00%
- Median HH income
- $106,389
- Composite
- 56.01/100
- National rank
- #1190
- State rank
- #34 of 153 in CT
Livability — Marlborough
No livability data for this city. (Only ~50 U.S. cities are tracked.)
Census & demographics
- Population (ZIP)
- 6,106
Population outlook (Capitol County) Hauer SSP2
- By 2040
- 1,063,519
Race, ethnicity, and origin ACS 2023
- Neighborhood character
- Predominantly White (82%)
- Race & ethnicity
- White 82% Hispanic / Latino 11% Two or more races 8% Asian 5% Black 2%
- Hispanic origin (detail)
- Puerto Rican 8%
- Common ancestry
- Romanian 9% Lithuanian 5% Italian 2%
- Foreign-born
- 6% · Canada, China, Dominican Republic
- Languages at home
- 89% English-only · Spanish 8% Other Asian/Pacific 2% Russian/Polish/Slavic 1%
Political lean MEDSL · Capitol
- 2024 margin
- Strong D (+21.9) · D 60.1% · R 38.2% · Other 1.7%
- All cycles
- 2024: D+21.9
Not yet ingested
- Civics
- —
Market trends
- HPI YoY
- ▼ -72.58%
- Current HPI
- 230.0302
- Rent YoY
- —
- Metro
- —
- State GDP YoY
- ▲ 1.06%
- F500 in state
- 38
Industry mix (Fortune 500 HQ in CT)
| Industry | F500 HQs | Revenue |
|---|---|---|
| Industrial Machinery | 4 | $38B |
|
||
| Insurance | 3 | $71B |
|
||
| Financial Services | 2 | $25B |
|
||
| Transportation / Logistics | 2 | $18B |
|
||
| Healthcare | 1 | $247B |
|
||
| Telecommunications | 1 | $55B |
|
||
Price history
+56.2% since first listed4 events — show timeline
- 2026-05-19 Relisted — Smart MLS
- 2026-03-27 Listing Removed — Smart MLS
- 2026-03-21 Listed $50,000 Smart MLS
- 1988-04-28 Sold (Public Records) $32,000 Public Records
Property tax history
+1.0%/yrLatest (2025): $845 · +3.9% YoY. Source: county tax records.
Cash-flow waterfall
monthlySold comps — $/sqft
last 12 mo · ≤1 miLoading sold comps…