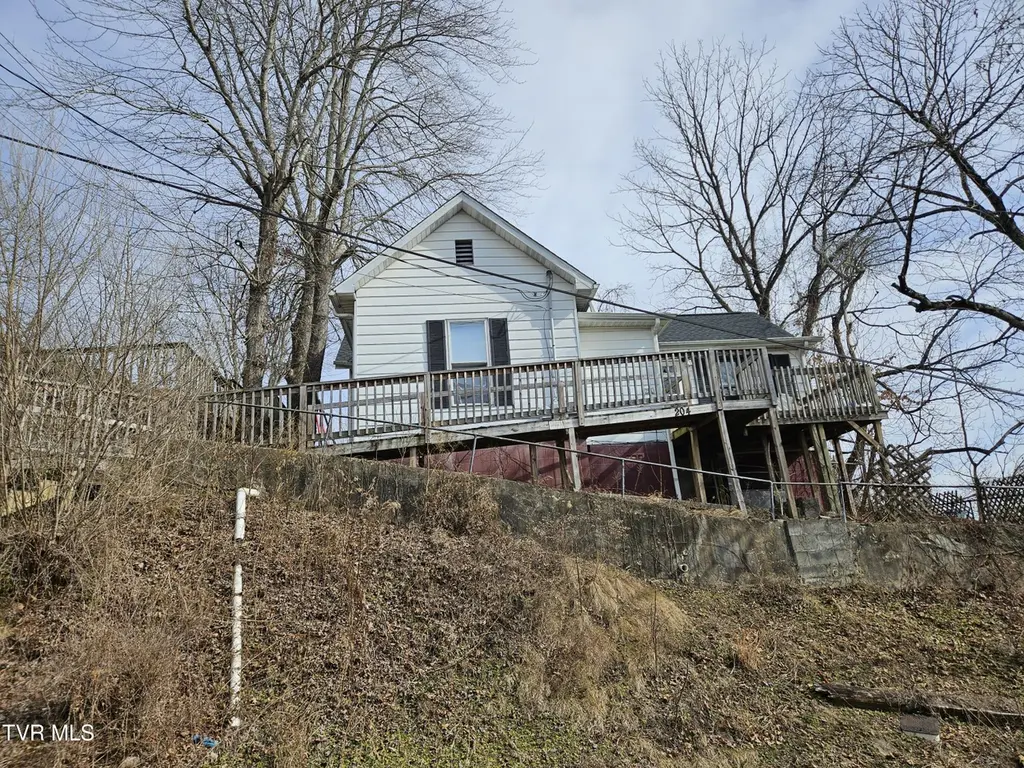
204 High Ave · Coeburn, VA
Flood risk 1/10 · Minimal
- FEMA flood zone
- X (unshaded)
- Chance of flooding over 30 yrs
- 0.0%
- Est. flood insurance / yr
- $507 – $1,088
Fire risk 5/10 · Moderate
- Est. fire insurance / yr
- $666 – $1,236
Heat risk 3/10 · Minor
- Hot days now (above 94°F)
- 8 days/yr
- Hot days in 30 yrs
- 24 days/yr
Wind risk 2/10 · Minimal
- Chance of severe wind over 30 yrs
- —
Air-quality risk 1/10 · Minimal
- Unhealthy air days now
- 0 days/yr
- Unhealthy air days in 30 yrs
- 0 days/yr
Risk factors via First Street. Map © Google.
Why this score? — see what drove the B grade
The composite is a weighted blend of 9 inputs, each scored 0–100. Each bar is that input's sub-score; the figure is the points it added to the 100-point composite (weight × sub-score).
- Cash flow +26.3/30.0
- ARV discount +13.1/15.0
- DSCR +8.9/10.0
- Schools +6.3/10.0
- 1% rule +5.8/10.0
- Appreciation +5.0/10.0
- Livability +3.2/5.0
- Rent growth +2.5/5.0
- Condition / age +2.5/5.0
$120,000
🖨 Deal sheet 📄 Offer letter ✓ Due diligence
Listing remarks MLS
Lots of potential in a great location! Located in downtown Coeburn, this property is within walking distance to Town Hall, Lay's Hardware, the Depot, Ringley Park, Guest River Coffee, and so much more! The roof, water heater, and HVAC have been recently updated, and the home is move-in ready and only needs touchups to make it your own!
Key facts
- Move-in ready
- 4,356 sq ft lot
- Listed 124 days
Tags
Neighborhood map
What this means for you Summary
Snapshot
- This is a 3-bed/2.0-bath single-family listed at $120k.
Deal economics
- At list price, monthly cash flow is $310 ($4k/yr) — positive.
- The deal already cash-flows at list — no discount required.
- Meets the 1% rule at list price ($1k rent vs $120k).
- Recommended offer: $106k (12.0% below list) — sets the bar for market timing.
- Cap rate 9.4% vs local median 5.4% in Coeburn — top-decile yield for the area; either an underpriced asset or a hidden risk that comps aren't pricing in. Stress-test before assuming the spread holds.
Location & tenants
- Location reads 63/100 on livability (#383 in VA) — a middle-class / working-renter tenant base. Strengths: schools A+, cost of living A+, crime B+; Watch: amenities F, commute F, employment F.
- Wise County Public School District (town): math 74% / reading 79% proficiency, ranked #11 of 131 in VA (top 8%) — strong family-tenant draw, lease renewals of 3-5y typical.
- Market conditions: 46 active listings in the ZIP; 1 comparable units currently listed for rent nearby; 17 units permitted in Wise County in 2024 (0 in 5+ unit buildings).
Forward outlook
- In year one you build about $912 of equity ($830 loan paydown + $82 appreciation (0.1% local appreciation)).
- Wise County population projected at -26% by 2050 — secular population decline; favor cash flow + early exit over multi-decade hold.
- At projected returns (0.1% appreciation + 3.0% rent growth), your $34k cash investment doubles in ~6 years — after that, you're playing with house money.
Negotiation context
- It's been on market 124 days — a 12% lower offer ($106k) is reasonable based on typical stale-listing flexibility.
- 2 sale attempts since 4y ago with the ask held roughly flat each time — persistent listings suggest the price (not the market) is what's stuck; bring a comps-based counter.
- Current owner paid $73k; list at $120k implies a 64% gain — meaningful room to come down on a strong offer.
Risks & watch-outs
- Climate carrying-cost: moderate wildfire risk — expect insurance premiums to compound above CPI over the hold.
Questions for the listing agent
- It's been on market 124 days. Have you received any prior offers? Is the seller open to a 12% concession, seller financing, or rate buy-down credit?
- Why hasn't it sold? Are there any deal-killer items the seller is aware of (foundation, flood, title, zoning, code violations)?
- Is there a deadline driving the sale (1031 exchange, divorce, estate, relocation)? That informs how much negotiation room exists.
- Schools are A-rated — typically a magnet for longer-tenancy family renters. What's the average tenant stay here, and is there a school-zone premium baked into asking?
- What's the average days-on-market for RENTAL listings here right now (not sales)? A rising rental-DOM trend means longer vacancies and softer asking-rent achievability than the comps imply.
- What's the recent tenant-quality profile in this submarket — average credit score on applications, eviction rate, late-payment / NSF rate, and stable-employment percentage? A property-management company in the area should have these aggregated.
- How much new for-sale + rental construction is in the pipeline within 1–3 miles? Heavy new supply typically softens prices + rents 12–24 months out; constrained supply supports both.
Investment metrics
- 1% rule
- 1.08% ✓
- Cap rate
- 9.40%
- Cash-on-cash
- 11.08%
- DSCR
- 1.49
- GRM
- 7.7
CMA / ARV
- ARV (median comp)
- $137,199
- List price
- $120,000
- Delta
- -12.54%
- Verdict
- UNDERPRICED
- Comps
- 20 within 1.0 mi
Show comp detail 11 sales within ~0.75 mi
| Address | Dist | Beds/Ba | Sqft | Sold | Price | $/sf | Match |
|---|---|---|---|---|---|---|---|
| 126 Tate Ave | 0.33mi | 3/1.0 | 1,416 (0%) | 17mo | $9,000 | $6 | 66 |
| 509 Quillen Ave | 0.49mi | 3/2.0 | 1,407 (-1%) | 17mo | $131,000 | $93 | 62 |
| 220 North St | 0.38mi | 3/1.5 | 1,502 (+6%) | 12mo | $99,000 | $66 | 60 |
| 209 Central Street St | 0.73mi | 3/2.0 | 1,400 (-1%) | 10mo | $227,500 | $163 | 56 |
| 610 Kiser Ave | 0.54mi | 3/2.0 | 1,456 (+3%) | 22mo | $165,000 | $113 | 52 |
| 304 7th St | 0.60mi | 3/2.0 | 1,440 (+2%) | 23mo | $129,500 | $90 | 50 |
| 703 Wilson Ave | 0.61mi | 3/2.0 | 1,440 (+2%) | 23mo | $81,500 | $57 | 50 |
| 513 Central St | 0.45mi | 3/2.0 | 1,620 (+14%) | 10mo | $162,000 | $100 | 47 |
| 621 King Ave Ave SE | 0.71mi | 3/2.0 | 1,395 (-2%) | 22mo | $220,000 | $158 | 47 |
| 205 Trent St | 0.50mi | 3/2.0 | 1,558 (+10%) | 24mo | $192,000 | $123 | 40 |
| 201 Ball Rd | 0.52mi | 2/1.5 (-1) | 1,581 (+12%) | 23mo | $115,000 | $73 | 30 |
Match score weights: distance 35% · size 25% · config 20% · recency 20%. Top-matched comps best support the ARV.
Projected returns pro-forma
0.07% appreciation · 3.0% rent growth · sell at horizon
- IRR
- 10.3%
- Equity multiple
- 1.49×
- Total profit
- $16,586
- Equity at exit
- $35,253
- IRR
- 15.1%
- Equity multiple
- 2.66×
- Total profit
- $55,866
- Equity at exit
- $42,704
Cash invested: $33,600 (down + closing). Projections, not guarantees.
Landlord ↔ Tenant lean methodology
- Overall (STATE)
- 55 Moderately Landlord-Leaning
- State Virginia
- 55 Moderately Landlord-Leaning · D+2
- County
- — inherits STATE
- City
- — inherits STATE
ZIP-level market 24230
- Home prices YoY
- 0.1%
- Active inventory
- 46
- Price-to-rent
- 7.7×
Monthly cashflow live
- Estimated rent
- $1,300 medium interval (Pro) →
- Mortgage (P&I)
- −$629
- Tax from tax record
- −$37 /mo · $449/yr
- Insurance
- −$50
- HOA
- −$0
- Vacancy / Maint / Mgmt
- −$273
- Net cashflow
- $310
Break-even live
UW: 25.0% down · 7.5% · 30yr · 1.5% tax · 5.0% vac · 8.0% maint · 8.0% mgmt
Financing live
Cash to close
- Down payment
- $30,000
- Closing costs
- $3,600
- Reserves months
- —
- Total cash needed
- —
Loan-product check · same deal, 3 products live
Conventional
25% down · 7.5% · 30yr
- Down + closing
- —
- Monthly P&I
- —
- Monthly cashflow
- —
- DSCR
- —
- Eligible?
- —
Personal DTI + credit; lowest rate.
DSCR
20% down · 8.5% · 30yr
- Down + closing
- —
- Monthly P&I
- —
- Monthly cashflow
- —
- DSCR
- —
- Eligible?
- —
No personal income docs; deal must DSCR.
Hard money
10% down · 12.0% · 12mo
- Down + closing
- —
- Monthly P&I
- —
- Monthly cashflow
- —
- DSCR
- —
- Eligible?
- —
Short-term bridge; refi at stabilization.
Rent comps 1 comps
| Address | Beds | Baths | Sqft | Rent | $/sqft | DOM | Units | Dist |
|---|---|---|---|---|---|---|---|---|
| 208 Prospect Ave NW Coeburn, VA | 3.0 | 1.0 | 1400 | $1,300 | $0.93 | 43d | 1 | 0.57mi |
Listing history 22 events
-
2026-06-18days on market $120,000 Active 124 DOM
-
2026-06-17days on market $120,000 Active 123 DOM
-
2026-06-16days on market $120,000 Active 122 DOM
-
2026-06-15days on market $120,000 Active 121 DOM
-
2026-06-15days on market $120,000 Active 120 DOM
-
2026-06-13days on market $120,000 Active 119 DOM
-
2026-06-12days on market $120,000 Active 118 DOM
-
2026-06-09days on market $120,000 Active 115 DOM
-
2026-06-08days on market $120,000 Active 114 DOM
-
2026-06-08days on market $120,000 Active 113 DOM
-
2026-06-07days on market $120,000 Active 112 DOM
-
2026-06-03days on market $120,000 Active 109 DOM
-
2026-06-02days on market $120,000 Active 108 DOM
-
2026-06-01days on market $120,000 Active 107 DOM
-
2026-05-31days on market $120,000 Active 106 DOM
-
2026-02-14$120,000 Active 337-char remark
Show marketing remark (337 chars)
Lots of potential in a great location! Located in downtown Coeburn, this property is within walking distance to Town Hall, Lay's Hardware, the Depot, Ringley Park, Guest River Coffee, and so much more! The roof, water heater, and HVAC have been recently updated, and the home is move-in ready and only needs touchups to make it your own!
-
2025-12-13price $100,000
-
2025-12-03price $110,000
-
2023-03-17soldstatus $73,000
-
2023-03-16soldstatus $73,000
-
2022-11-24$79,900
-
2001-05-29soldstatus $22,000
ⓘ Source: listings_history table (triggers on properties + properties_extension) + one-shot
backfill from property_details.listing_events for pre-trigger history.
Tax reassessment forecast VA · Resets to sale price
- Current annual tax
- $449 · $37/mo
- Projected year-2 tax
- $984 · $82/mo
- Expected delta
- +$535/yr (+$45/mo · 119.1%)
ⓘ Screening estimate from a state-policy table — verify with the county assessor before closing.
Climate risk First Street
- Flood 1/10 Low FEMA zone X (unshaded) · 0% chance over 30 yrs
- Wildfire 5/10 Major
- Heat 3/10 Moderate 8 d/yr ≥94°F today · 24 d/yr by 30 yrs out
- Wind 2/10 Low
- Air quality 1/10 Low 0 unhealthy d/yr today · 0 by 30 yrs out
Nearby sold comps map
Loading sold comps map…
Walkable amenities ~0.75 mi
Loading nearby amenities…
Taxation est. · year 1
- Rental income
- $15,600
- − Mortgage interest
- −$6,722
- − Property taxes
- −$449
- − Insurance
- −$600
- − Repairs & maintenance
- −$1,248
- − Management
- −$1,248
- − Depreciation
- −$3,491
- Taxable income
- $1,842
- Est. tax owed @ 24.0%
- −$442
- After-tax cash flow
- $3,281/yr
For passive investors: Depreciation is non-cash, so a rental often shows a tax loss while cash-flowing — sheltering income. Rental losses are passive: they offset passive income freely, and up to $25,000/yr can offset ordinary (W-2) income if you actively participate and your MAGI is under $100k (phasing out to $0 by $150k); unused losses carry forward. On sale, claimed depreciation is recaptured at up to 25%, and gains may owe capital-gains tax (a 1031 exchange can defer both). Figures are a year-1 estimate at your 24.0% rate — not tax advice; consult a CPA.
Schools (NCES district)
- District
- Wise County Public School District
- NCES district ID
- 5104080
- Math proficiency
- 74% ▼ -20.00%
- Reading proficiency
- 79% ▼ -7.00%
- Median HH income
- $35,624
- Composite
- 63.37/100
- National rank
- #625
- State rank
- #11 of 131 in VA
Livability — Coeburn
- Score
- 63/100
- State rank
- #383
- US rank
- #15422
Category grades
Schools grade is shown separately in the Schools card above.
Census & demographics
- Census place
- Coeburn, VA
- Population (ZIP)
- 7,057
Population outlook (Wise County) Hauer SSP2
- Today (2025)
- 35,714 people
- By 2030
- 33,742 · -5.5%
- By 2040
- 29,870 · -16.4%
- By 2050
- 26,233 · -26.5%
- By 2075
- 18,296 · -48.8%
- By 2100
- 12,147 · -66.0%
Race, ethnicity, and origin ACS 2023
- Neighborhood character
- Predominantly White (93%)
- Race & ethnicity
- White 93% Black 3% Hispanic / Latino 1%
- Common ancestry
- Slovak 2% Italian 2% Serbian 1%
- Foreign-born
- 2% · Canada
- Languages at home
- 98% English-only · Spanish 1%
Political lean MEDSL · Wise
- 2024 margin
- Solid R (+63.3) · D 18.1% · R 81.4%
- 2008→2024 swing
- -35.6pp toward R · 2008: -27.7pp · 2024: -63.3pp
- All cycles
- 2024: R+63.3 2020: R+61.7 2016: R+62.0 2012: R+48.8 2008: R+27.7
Not yet ingested
- Civics
- —
Market trends
- HPI YoY
- ▲ 0.07%
- Current HPI
- 135.5947
- Rent YoY
- —
- Metro
- —
- State GDP YoY
- ▲ 2.40%
- F500 in state
- 50
Industry mix (Fortune 500 HQ in VA)
| Industry | F500 HQs | Revenue |
|---|---|---|
| Aerospace / Defense | 4 | $236B |
|
||
| Technology / Defense | 3 | $32B |
|
||
| Financial Services | 2 | $176B |
|
||
| Utilities | 2 | $27B |
|
||
| Insurance | 2 | $25B |
|
||
| Technology | 2 | $15B |
|
||
Price history
+445.5% since first listed7 events — show timeline
- 2026-02-14 Listed $120,000 TVRMLS
- 2025-12-13 Price Changed $100,000 TVRMLS
- 2025-12-03 Price Changed $110,000 TVRMLS
- 2023-03-17 Sold (Public Records) $73,000 Public Records
- 2023-03-16 Sold (MLS) $73,000 TVRMLS
- 2022-11-24 Listed $79,900 TVRMLS
- 2001-05-29 Sold (Public Records) $22,000 Public Records
Property tax history
+3.1%/yrLatest (2025): $449 · +0.0% YoY. Source: county tax records.
Cash-flow waterfall
monthlySold comps — $/sqft
last 12 mo · ≤1 miLoading sold comps…