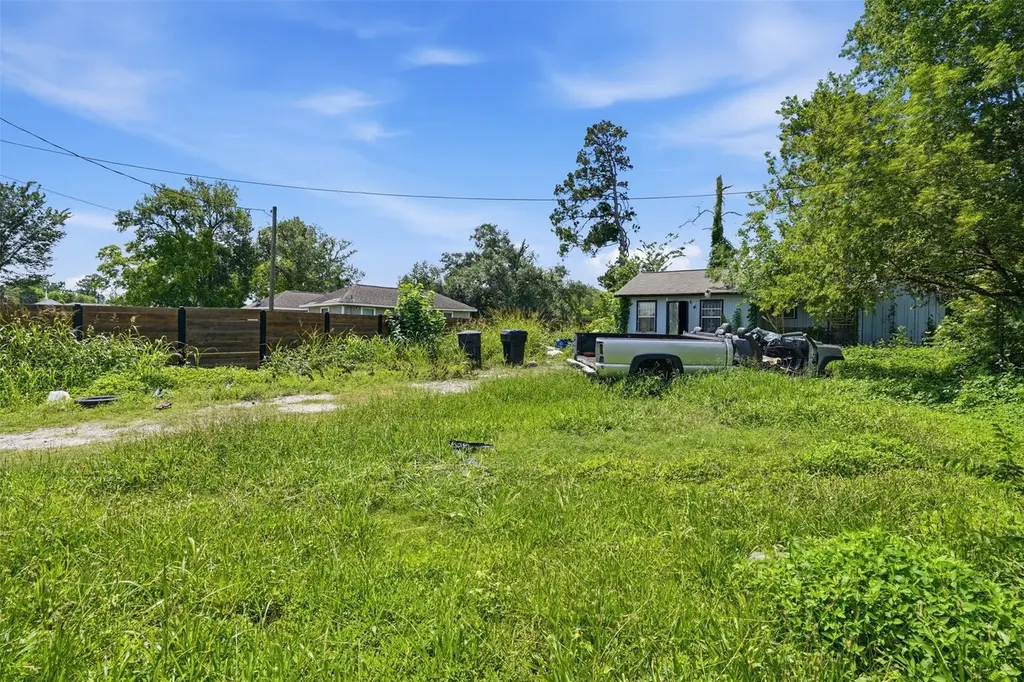
5206 Polly St · Houston, TX
Flood risk 1/10 · Minimal
- FEMA flood zone
- X (unshaded)
- Chance of flooding over 30 yrs
- 0.0%
- Est. flood insurance / yr
- $507 – $1,088
Fire risk 1/10 · Minimal
- Est. fire insurance / yr
- $1,222 – $2,270
Heat risk 9/10 · Severe
- Hot days now (above 109°F)
- 7 days/yr
- Hot days in 30 yrs
- 22 days/yr
Wind risk 9/10 · Severe
- Chance of severe wind over 30 yrs
- 99.0%
Air-quality risk 3/10 · Minor
- Unhealthy air days now
- 3 days/yr
- Unhealthy air days in 30 yrs
- 3 days/yr
Risk factors via First Street. Map © Google.
Why this score? — see what drove the B+ grade
The composite is a weighted blend of 9 inputs, each scored 0–100. Each bar is that input's sub-score; the figure is the points it added to the 100-point composite (weight × sub-score).
- Cash flow +30.0/30.0
- 1% rule +10.0/10.0
- DSCR +10.0/10.0
- Appreciation +9.3/10.0
- ARV discount +7.5/15.0
- Livability +3.7/5.0
- Schools +2.7/10.0
- Rent growth +2.6/5.0
- Condition / age +2.5/5.0
$55,000
🖨 Deal sheet (PDF) 📄 Offer letter ✓ Due diligence
Listing remarks
Investors and builders, look no more! Outstanding investment opportunity located in the rapidly growing Northeast Houston area. Sitting on an expansive, oversized lot surrounded by mature trees, 5206 Polly Street offers tremendous potential for a complete rehab, a custom single-family build, or multi-unit development. The current single-story structure provides an ideal footprint for seasoned renovators, while the deep lot size leaves plenty of room for creative design. Conveniently situated with quick access to Tidwell Road and I-69 / US-59, this property offers an easy commute to downtown Houston, local parks, schools, and major shopping hubs. Whether you are looking to flip, hold for ren
Key facts
- Complete rehab
- Oversized lot
- Mature trees
Tags
Property features AI
Finance
- Other: Lease not considered
- HOA & community: Member of Commons of Lake Houston Property association
Exterior
- Utilities: Public water; Public sewer
- Home design: Residential property; 1,264 total living area; Built in 1950
- Construction: Wood siding construction; Composition roof; Pillar/post/pier foundation
- Exterior features: Lot includes other features
Interior
- Bedrooms: Primary bedroom on the first floor; Additional bedroom on the first floor; Primary bathroom on the first floor
- Bathrooms: 1 full bathroom
- Heating & cooling: Central air conditioning; Electric cooling; Gas cooling
- Interior features: 3 total rooms
Neighborhood map
What this means for you Summary
Snapshot
- This is a 2-bed/1.0-bath single-family listed at $55k.
Deal economics
- At list price, monthly cash flow is $868 ($10k/yr) — positive.
- The deal already cash-flows at list — no discount required.
- Meets the 1% rule at list price ($2k rent vs $55k).
- Cap rate 25.2% vs local median 3.2% in Houston — top-decile yield for the area; either an underpriced asset or a hidden risk that comps aren't pricing in. Stress-test before assuming the spread holds.
Location & tenants
- Location reads 74/100 on livability (#184 in TX, #4,771 nationally) — a middle-class / working-renter tenant base. Strengths: amenities A+, cost of living A+, housing A+; Watch: crime F.
- Houston ISD (urban): math 27% / reading 35% proficiency, ranked #593 of 826 in TX (top 72%) — families likely to look elsewhere, expect single-tenant / working-renter base with shorter leases; 71% free/reduced lunch — lower-income household profile, screen leases tightly.
- Zoned schools: Shadydale El (math 11% / reading 20%, grade F, #3,990 of 4,322 statewide, top 93%, 631 students, 95% FRL); Forest Brook Middle (math 12% / reading 14%, grade F, #1,609 of 1,662 statewide, top 97%, 613 students, 98% FRL); North Forest H S (math 13% / reading 18%, grade F, #1,505 of 1,632 statewide, top 92%, 974 students, 97% FRL) — zoned schools average 97% FRL vs 71% district-wide (26 pts higher); higher-poverty schools than district average — tighter screening recommended.
- Zoned-school proficiency averages 15% at this address vs 31% district-wide (-16 pts) — the specific schools serving this property underperform the Houston ISD average; the district grade overstates school quality for this exact location.
- Market conditions: Rents flat; 376 active listings in the ZIP; 18 comparable units currently listed for rent nearby; rentals lingering (median 46d on market — plan ~5-8 weeks vacancy on turnover, expect pricing pressure); 67% of comp listings sitting > 30 days — soft ceiling on asking rent; 29,883 units permitted in Harris County in 2024 (8,621 in 5+ unit buildings).
- This rent runs 41% of the median local income ($48k/yr) — at the standard rent-burdened threshold; future hikes will face affordability resistance.
Forward outlook
- In year one you build about $5k of equity ($380 loan paydown + $5k appreciation (8.7% local appreciation)).
- Harris County population projected at +47% by 2050 — long-run rental-demand tailwind backs the buy-and-hold thesis.
- At projected returns (8.7% appreciation + 0.4% rent growth), your $15k cash investment doubles in ~1 year — after that, you're playing with house money.
- By year 7, paydown + projected appreciation supports a ~$36k cash-out refi (75% LTV) — recoverable capital for the next deal without selling this one.
Negotiation context
- Only 3 days on market — expect competitive offers; lowballing is unlikely to land.
Risks & watch-outs
- Watch-outs: built in 1950 — expect roof / HVAC / electrical / plumbing capex.
- Climate carrying-cost: severe wind risk, 99% chance of damaging wind over 30y; extreme-heat days projected 7→22/yr by 2055 (HVAC capex compounding) — expect insurance premiums to compound above CPI over the hold.
Questions for the listing agent
- Built in 1950 — when were the roof, HVAC, electrical panel, plumbing, and water heater last replaced?
- Is there a deadline driving the sale (1031 exchange, divorce, estate, relocation)? That informs how much negotiation room exists.
- Schools are D-rated, which usually means shorter tenancies and higher turnover. Who's the typical renter profile here, and what's been the actual vacancy rate?
- Crime grade is F in this area — have there been break-ins, vandalism, or insurance claims at this property in the last 3 years? What carrier currently insures it and at what premium?
- What's the average days-on-market for RENTAL listings here right now (not sales)? A rising rental-DOM trend means longer vacancies and softer asking-rent achievability than the comps imply.
- What's the recent tenant-quality profile in this submarket — average credit score on applications, eviction rate, late-payment / NSF rate, and stable-employment percentage? A property-management company in the area should have these aggregated.
- How much new for-sale + rental construction is in the pipeline within 1–3 miles? Heavy new supply typically softens prices + rents 12–24 months out; constrained supply supports both.
Investment metrics
- 1% rule
- 2.97% ✓
- Cap rate
- 25.22%
- Cash-on-cash
- 67.60%
- DSCR
- 4.01
- GRM
- 2.8
CMA / ARV
- ARV (on-the-fly)
- $173,168
- Comps found
- 12
Show comp detail 12 sales within ~0.75 mi
| Address | Dist | Beds/Ba | Sqft | Sold | Price | $/sf | Match |
|---|---|---|---|---|---|---|---|
| 9611 Bertwood St | 0.37mi | 3/1.0 (+1) | 1,277 (+1%) | 7mo | $174,990 | $137 | 70 |
| 9711 Bertwood St | 0.35mi | 3/1.5 (+1) | 1,365 (+8%) | 10mo | $169,990 | $125 | 55 |
| 9705 Peachtree St | 0.14mi | 3/2.0 (+1) | 1,450 (+15%) | 6mo | $219,900 | $152 | 54 |
| 4621 Wiley Rd | 0.71mi | 3/1.0 (+1) | 1,338 (+6%) | 0mo | $199,000 | $149 | 52 |
| 4530 Firnat St | 0.70mi | 2/2.0 | 1,169 (-8%) | 2mo | $99,000 | $85 | 49 |
| 5702 Breland Unit E | 0.19mi | 3/2.5 (+1) | 1,437 (+14%) | 13mo | $255,000 | $177 | 46 |
| 10329 Wicklowe St | 0.75mi | 3/2.0 (+1) | 1,194 (-6%) | 2mo | $149,000 | $125 | 46 |
| 6206 Antha St | 0.51mi | 3/2.0 (+1) | 1,415 (+12%) | 4mo | $170,000 | $120 | 44 |
| 6219 Hesta Ln | 0.48mi | 3/1.5 (+1) | 1,436 (+14%) | 7mo | $169,000 | $118 | 42 |
| 9002 Allwood St | 0.69mi | 3/1.5 (+1) | 1,373 (+9%) | 10mo | $194,900 | $142 | 38 |
| 5417 Glen Nook Dr | 0.62mi | 2/1.0 | 1,080 (-15%) | 12mo | $133,000 | $123 | 37 |
| 5107 Firnat St | 0.47mi | 3/2.0 (+1) | 1,090 (-14%) | 14mo | $210,000 | $193 | 34 |
Match score weights: distance 35% · size 25% · config 20% · recency 20%. Top-matched comps best support the ARV.
Projected returns pro-forma
8.65% appreciation · 0.44% rent growth · sell at horizon
- IRR
- 75.3%
- Equity multiple
- 5.95×
- Total profit
- $76,159
- Equity at exit
- $44,235
- IRR
- 69.4%
- Equity multiple
- 12.20×
- Total profit
- $172,541
- Equity at exit
- $90,252
Cash invested: $15,400 (down + closing). Projections, not guarantees.
Landlord ↔ Tenant lean methodology
- Overall (STATE)
- 87 Strongly Landlord-Friendly
- State Texas
- 87 Strongly Landlord-Friendly · R+5
- County
- — inherits STATE
- City
- — inherits STATE
ZIP-level market 77016
- Home prices YoY
- 2.8%
- Rents YoY
- 0.4%
- Active inventory
- 376
- Price-to-rent
- 2.8×
Monthly cashflow live
- Estimated rent
- $1,635 high interval (Pro) →
- Mortgage (P&I)
- −$288
- Tax from tax record
- −$113 /mo · $1,350/yr
- Insurance
- −$23
- HOA
- −$0
- Vacancy / Maint / Mgmt
- −$343
- Net cashflow
- $868
Break-even live
Sensitivity live
| Price | -10% $899 | -5% $883 | +0% $868 | +5% $852 | +10% $836 |
|---|---|---|---|---|---|
| Rent | -10% $738 | -5% $803 | +0% $868 | +5% $932 | +10% $997 |
| Rate | -1.0pp $895 | -0.5pp $882 | base $868 | +0.5pp $853 | +1.0pp $839 |
UW: 25.0% down · 7.5% · 30yr · 1.5% tax · 5.0% vac · 8.0% maint · 8.0% mgmt
Financing live
Cash to close
- Down payment
- $13,750
- Closing costs
- $1,650
- Reserves months
- —
- Total cash needed
- —
Loan-product check · same deal, 3 products live
Conventional
25% down · 7.5% · 30yr
- Down + closing
- —
- Monthly P&I
- —
- Monthly cashflow
- —
- DSCR
- —
- Eligible?
- —
Personal DTI + credit; lowest rate.
DSCR
20% down · 8.5% · 30yr
- Down + closing
- —
- Monthly P&I
- —
- Monthly cashflow
- —
- DSCR
- —
- Eligible?
- —
No personal income docs; deal must DSCR.
Hard money
10% down · 12.0% · 12mo
- Down + closing
- —
- Monthly P&I
- —
- Monthly cashflow
- —
- DSCR
- —
- Eligible?
- —
Short-term bridge; refi at stabilization.
Rent comps 18 comps
| Address | Beds | Baths | Sqft | Rent | $/sqft | DOM | Units | Dist |
|---|---|---|---|---|---|---|---|---|
| 9422 Sandra St Unit B Houston, TX | 3.0 | 2.5 | 1461 | $1,875 | $1.28 | 45d | 1 | 0.33mi |
| 10329 Wicklowe St Houston, TX | 3.0 | 2.0 | 1266 | $1,400 | $1.11 | 22d | 1 | 0.74mi |
| 8639 Peachtree St Unit A Houston, TX | 3.0 | 2.5 | 1150 | $1,750 | $1.52 | 45d | 1 | 0.87mi |
| 10221 Bretton Dr Houston, TX | 3.0 | 1.0 | 1350 | $1,700 | $1.26 | 26d | 1 | 0.90mi |
| 8508 Wileyvale Rd Houston, TX | 2.0 | 2.0 | 1504 | $1,650 | $1.10 | 45d | 1 | 0.98mi |
| 7201 Hallshire Dr Unit 222 Houston, TX | 2.0 | 1.0 | 985 | $700 | $0.71 | 45d | 1 | 0.99mi |
| 7201 Hallshire Dr Unit 235 Houston, TX | 3.0 | 1.0 | 1100 | $850 | $0.77 | 45d | 1 | 0.99mi |
| 7201 Hallshire Dr Houston, TX | 2.0 | 1.0 | 985 | $740 | $0.75 | 45d | 1 | 0.99mi |
| 9314 Sundown Dr Unit A Houston, TX | 3.0 | 2.5 | 1608 | $1,675 | $1.04 | 1d | 1 | 1.05mi |
| 9410 Firnat St Unit A Houston, TX | 3.0 | 2.5 | 1500 | $1,900 | $1.27 | 0d | 1 | 1.15mi |
| 9410 Firnat St Unit B Houston, TX | 3.0 | 2.5 | 1500 | $1,900 | $1.27 | 45d | 1 | 1.15mi |
| 9324 Firnat St Unit B Houston, TX | 3.0 | 2.5 | 1600 | $1,900 | $1.19 | 23d | 1 | 1.15mi |
| 7252 Parker Rd Houston, TX | 3.0 | 1.0 | 916 | $1,650 | $1.80 | 45d | 1 | 1.23mi |
| 7119 Bywood St Unit A Houston, TX | 3.0 | 2.5 | 1150 | $1,795 | $1.56 | 45d | 1 | 1.31mi |
| 7325 Boggess Rd Houston, TX | 3.0 | 2.0 | 1568 | $1,850 | $1.18 | 45d | 1 | 1.40mi |
| 7325 Boggess Rd Houston, TX | 3.0 | 2.0 | 1568 | $1,850 | $1.18 | 18d | 1 | 1.40mi |
| 4326 Plaag St Unit B Houston, TX | 3.0 | 2.5 | 1150 | $1,595 | $1.39 | 45d | 1 | 1.46mi |
| 7740 Wileyvale Rd Unit B Houston, TX | 3.0 | 2.0 | 1500 | $3,000 | $2.00 | 45d | 1 | 1.47mi |
Listing history 5 events
-
2026-06-07status $55,000 Pending 3 DOM
-
2026-06-04days on market $55,000 Active 3 DOM
-
2026-06-03days on market $55,000 Active 2 DOM
-
2026-06-02remarks 699-char remark
-
2026-06-02$55,000 Active 1 DOM
ⓘ Source: listings_history table (triggers on properties + properties_extension) + one-shot
backfill from property_details.listing_events for pre-trigger history.
Tax reassessment forecast TX · Resets to sale price
- Current annual tax
- $1,350 · $113/mo
- Projected year-2 tax
- $1,350 · $113/mo
- Expected delta
- $0/yr ($0/mo · 0.0%)
ⓘ Screening estimate from a state-policy table — verify with the county assessor before closing.
Climate risk First Street
- Flood 1/10 Low FEMA zone X (unshaded) · 0% chance over 30 yrs
- Wildfire 1/10 Low
- Heat 9/10 Extreme 7 d/yr ≥109°F today · 22 d/yr by 30 yrs out
- Wind 9/10 Extreme 99% chance of damaging wind over 30 yrs
- Air quality 3/10 Moderate 3 unhealthy d/yr today · 3 by 30 yrs out
Nearby sold comps map
Loading sold comps map…
Walkable amenities ~0.75 mi
Loading nearby amenities…
Taxation est. · year 1
- Rental income
- $19,616
- − Mortgage interest
- −$3,081
- − Property taxes
- −$1,350
- − Insurance
- −$275
- − Repairs & maintenance
- −$1,569
- − Management
- −$1,569
- − Depreciation
- −$1,600
- Taxable income
- $10,171
- Est. tax owed @ 24.0%
- −$2,441
- After-tax cash flow
- $7,969/yr
For passive investors: Depreciation is non-cash, so a rental often shows a tax loss while cash-flowing — sheltering income. Rental losses are passive: they offset passive income freely, and up to $25,000/yr can offset ordinary (W-2) income if you actively participate and your MAGI is under $100k (phasing out to $0 by $150k); unused losses carry forward. On sale, claimed depreciation is recaptured at up to 25%, and gains may owe capital-gains tax (a 1031 exchange can defer both). Figures are a year-1 estimate at your 24.0% rate — not tax advice; consult a CPA.
Schools (NCES district)
- District
- Houston ISD
- NCES district ID
- 4823640
- Math proficiency
- 27% ▼ -18.00%
- Reading proficiency
- 35% ▼ -6.00%
- Median HH income
- $46,054
- Composite
- 26.63/100
- National rank
- #7173
- State rank
- #593 of 826 in TX
Livability — Houston
- Score
- 74/100
- State rank
- #184
- US rank
- #4771
Category grades
Schools grade is shown separately in the Schools card above.
Census & demographics
- Census place
- Houston, TX
- County
- Harris County · 4,702,590 people
- City population
- 3,226,434
- Metro
- Houston-The Woodlands-Sugar Land, TX
- Population (ZIP)
- 29,841
- Household income
- $47,677
- Rent vs Own
- Severe rent burden
- 1297.0
Population outlook (Harris County) Hauer SSP2
- Today (2025)
- 5,571,493 people
- By 2030
- 6,089,821 · +9.3%
- By 2040
- 7,142,806 · +28.2%
- By 2050
- 8,185,864 · +46.9%
- By 2075
- 10,574,329 · +89.8%
- By 2100
- 12,109,958 · +117.4%
Race, ethnicity, and origin ACS 2023
- Neighborhood character
- Majority Black (56%)
- Race & ethnicity
- Black 56% Hispanic / Latino 42% Two or more races 28%
- Hispanic origin (detail)
- Mexican 34%
- Foreign-born
- 18% · Canada
- Languages at home
- 61% English-only · Spanish 37%
Political lean MEDSL · Harris
- 2024 margin
- Lean D (+5.5) · D 52.0% · R 46.4% · Other 1.6%
- 2008→2024 swing
- +3.9pp toward D · 2008: 1.6pp · 2024: 5.5pp
- All cycles
- 2024: D+5.5 2020: D+13.3 2016: D+12.4 2012: D+0.1 2008: D+1.6
Not yet ingested
- Civics
- —
Market trends
- HPI YoY
- ▲ 8.65%
- Current HPI
- 315.6765
- Rent YoY
- ▲ 0.44%
- Metro
- Houston-The Woodlands-Sugar Land, TX
- State GDP YoY
- ▲ 3.95%
- F500 in state
- 110
Industry mix (Fortune 500 HQ in TX)
| Industry | F500 HQs | Revenue |
|---|---|---|
| Energy | 16 | $1,198B |
|
||
| Technology | 5 | $198B |
|
||
| Engineering / Construction | 4 | $72B |
|
||
| Energy Services | 3 | $60B |
|
||
| Utilities | 3 | $41B |
|
||
| Healthcare | 2 | $330B |
|
||
Price history
3 events — show timeline
- 2026-06-01 Listed $55,000 HARMLS
- 2004-09-03 Sold (Public Records) — Public Records
- 1995-02-17 Sold (Public Records) — Public Records
Property tax history
+1.4%/yrLatest (2025): $1,350 · +11.7% YoY. Source: county tax records.
Cash-flow waterfall
monthlySold comps — $/sqft
last 12 mo · ≤1 miLoading sold comps…