 Duplex
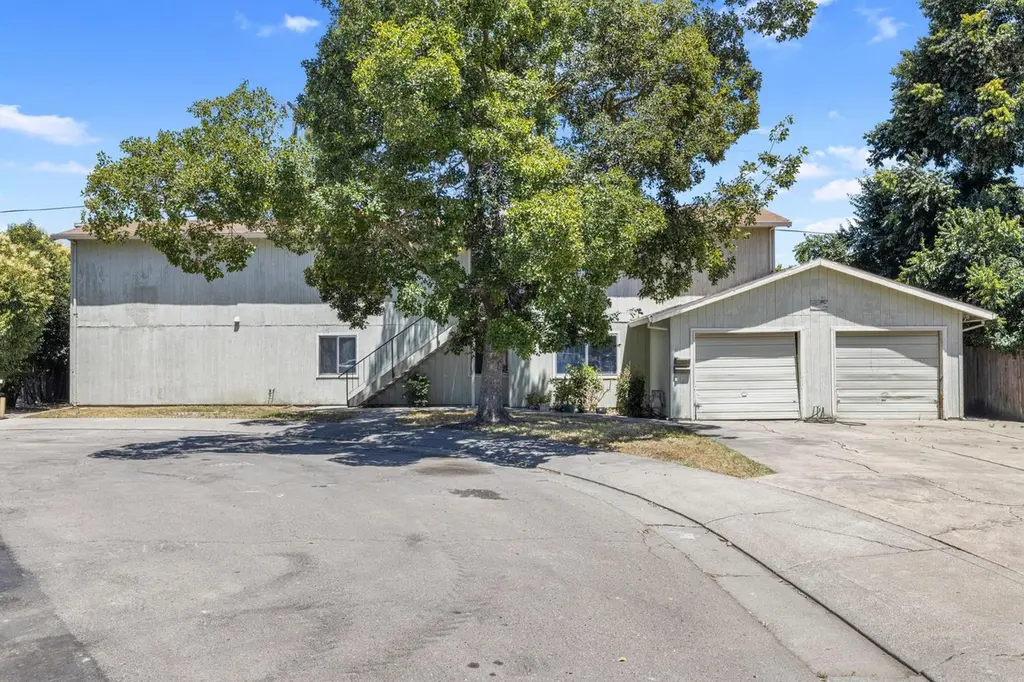
2129 Acacia Ct · Stockton, CA
Flood risk 6/10 · Moderate
- FEMA flood zone
- X
- Chance of flooding over 30 yrs
- 0.27%
- Est. flood insurance / yr
- $507 – $1,088
Fire risk 1/10 · Minimal
- Est. fire insurance / yr
- $659 – $1,223
Heat risk 7/10 · Major
- Hot days now (above 103°F)
- 7 days/yr
- Hot days in 30 yrs
- 15 days/yr
Wind risk 1/10 · Minimal
- Chance of severe wind over 30 yrs
- —
Air-quality risk 10/10 · Severe
- Unhealthy air days now
- 30 days/yr
- Unhealthy air days in 30 yrs
- 30 days/yr
Risk factors via First Street. Map © Google.
Why this score? — see what drove the D grade
The composite is a weighted blend of 9 inputs, each scored 0–100. Each bar is that input's sub-score; the figure is the points it added to the 100-point composite (weight × sub-score).
- Cash flow +15.3/30.0
- ARV discount +7.5/15.0
- DSCR +4.7/10.0
- 1% rule +3.4/10.0
- Schools +2.9/10.0
- Livability +2.9/5.0
- Rent growth +2.5/5.0
- Condition / age +2.5/5.0
- Appreciation +0.0/10.0
$430,000
🖨 Deal sheet 📄 Offer letter ✓ Due diligence
Multi-family units
County records classify this as Multi-Family (2-4 Unit). Listing-text estimate: 2 units. confirmed
Listing remarks
Excellent investment opportunity with owner-occupant potential! This duplex at 2129 Acacia Street offers the best of both worlds, featuring one occupied unit providing rental income and one vacant unit that has been recently updated and is move-in ready. Whether you're looking to live in one unit while generating income from the other or add a versatile property to your investment portfolio, this duplex offers endless possibilities. The updated vacant unit showcases fresh improvements, making it an attractive option for homeowners and tenants alike. Located in an established Stockton neighborhood, the property is conveniently situated near schools, parks, shopping, dining, and commuter rout
Key facts
- Near schools
- Recently updated
- Near parks
Tags
Property features AI
Finance
- HOA & community: No homeowners association
Exterior
- Parking: Attached 2-car garage; 2 total parking spaces
- Utilities: Public water; Public sewer; Irrigation from public district
- Home design: Residential income property; Duplex; House(s) subtype; Built in 1982; 2 stories
- Construction: Composition roof; Built in 1982
- Exterior features: Composition roof; Regular-shaped lot
Interior
- Kitchen: Built-in electric range
- Bedrooms: Unit 1: 3 bedrooms; Unit 2: 3 bedrooms
- Flooring: Carpet; Laminate
- Bathrooms: Unit 1: 1 full bathroom; Unit 2: 1 full bathroom
- Heating & cooling: Central heating; Central air conditioning
- Interior features: Built-in electric range
- Laundry & utility: Laundry: Other
Neighborhood map
What this means for you Summary
Snapshot
- This is a 2 × 3-bed/1.0-bath units multifamily listed at $430k.
Deal economics
- At list price, monthly cash flow is $157 ($2k/yr) — positive. Per door: $78/mo.
- The deal already cash-flows at list — no discount required.
- To meet the 1% rule (rent ≥ 1% of price), the offer needs to be $360k (16.3% below list).
- Recommended offer: $360k (16.3% below list) — sets the bar for 1% rule.
- Cap rate 6.7% vs local median 3.6% in Stockton — top-decile yield for the area; either an underpriced asset or a hidden risk that comps aren't pricing in. Stress-test before assuming the spread holds.
Location & tenants
- Location reads 57/100 on livability (#734 in CA) — a working-class tenant base; expect higher turnover. Strengths: housing A+, health & safety A, amenities A-; Watch: employment C-, schools D-, crime F.
- Stockton Unified (urban): math 23% / reading 46% proficiency, ranked #295 of 517 in CA (top 57%) — families likely to look elsewhere, expect single-tenant / working-renter base with shorter leases; 78% free/reduced lunch — lower-income household profile, screen leases tightly.
- Market conditions: 64 active listings in the ZIP; 3,779 units permitted in San Joaquin County in 2024 (0 in 5+ unit buildings).
- At $3,599/mo this rent would consume 68% of the median local household income ($63k/yr) (locally 1034% of renters already pay >50% of income on rent) — very limited rent-growth headroom before tenants either downsize or default.
Forward outlook
- Local home prices are declining (-3.0%/yr); year-one equity from $3k of loan paydown is wiped out by about $13k of value loss. Plan a longer hold.
- San Joaquin County population projected at +17% by 2050 — long-run rental-demand tailwind backs the buy-and-hold thesis.
Negotiation context
- Only 6 days on market — expect competitive offers; lowballing is unlikely to land.
- Current owner paid $64k; list at $430k implies a 571% gain — meaningful room to come down on a strong offer.
Risks & watch-outs
- Climate carrying-cost: major flood risk; extreme-heat days projected 7→15/yr by 2055 (HVAC capex compounding) — expect insurance premiums to compound above CPI over the hold.
Questions for the listing agent
- Can we see the unit-by-unit rent roll, current vacancy, and any below-market leases? What's the average tenancy length?
- What capital expenditures (roof, boiler, parking lot, exteriors) have been made in the last 5 years, and what's planned in the next 2?
- Is there a deadline driving the sale (1031 exchange, divorce, estate, relocation)? That informs how much negotiation room exists.
- Schools are D-rated, which usually means shorter tenancies and higher turnover. Who's the typical renter profile here, and what's been the actual vacancy rate?
- Crime grade is F in this area — have there been break-ins, vandalism, or insurance claims at this property in the last 3 years? What carrier currently insures it and at what premium?
- The area grade is low — what's the realistic commute time and amenity access for the typical tenant pool here? Any planned neighborhood developments (good or bad) we should know about?
- What's the average days-on-market for RENTAL listings here right now (not sales)? A rising rental-DOM trend means longer vacancies and softer asking-rent achievability than the comps imply.
- What's the recent tenant-quality profile in this submarket — average credit score on applications, eviction rate, late-payment / NSF rate, and stable-employment percentage? A property-management company in the area should have these aggregated.
- How much new apartment / multifamily construction is in the pipeline within 1–3 miles? Heavy new supply (>2% of stock underway) typically softens rents 12–24 months out; light construction supports rent growth.
Investment metrics
- 1% rule
- 0.84% ✗
- Cap rate
- 6.73%
- Cash-on-cash
- 1.56%
- DSCR
- 1.07
- GRM
- 10.0
CMA / ARV
No comps found within radius.
Projected returns pro-forma
-3.0% appreciation · 3.0% rent growth · sell at horizon
- IRR
- -13.9%
- Equity multiple
- 0.50×
- Total profit
- $-59,825
- Equity at exit
- $64,114
- IRR
- -5.1%
- Equity multiple
- 0.67×
- Total profit
- $-39,743
- Equity at exit
- $37,179
Cash invested: $120,400 (down + closing). Projections, not guarantees.
Landlord ↔ Tenant lean methodology
- Overall (STATE)
- 18 Strongly Tenant-Friendly
- State California
- 18 Strongly Tenant-Friendly · D+13
- County
- — inherits STATE
- City
- — inherits STATE
ZIP-level market 95203
- Active inventory
- 64
- Price-to-rent
- 19.9×
Monthly cashflow live
- Estimated rent
- $3,599 high interval (Pro) →
- Mortgage (P&I)
- −$2,255
- Tax from tax record
- −$252 /mo · $3,030/yr
- Insurance
- −$179
- HOA
- −$0
- Vacancy / Maint / Mgmt
- −$756
- Net cashflow
- $157
Break-even live
2-unit breakdown (identical units grouped — click to expand)
| Units | Beds | Baths | Est. rent |
|---|---|---|---|
| 2× units | 3 | 1 | $3,600 |
| #1 | 3 | 1 | $1,800 |
| #2 | 3 | 1 | $1,800 |
| Total (2 units) | $3,599 | ||
UW: 25.0% down · 7.5% · 30yr · 1.5% tax · 5.0% vac · 8.0% maint · 8.0% mgmt
Financing live
Cash to close
- Down payment
- $107,500
- Closing costs
- $12,900
- Reserves months
- —
- Total cash needed
- —
Loan-product check · same deal, 3 products live
Conventional
25% down · 7.5% · 30yr
- Down + closing
- —
- Monthly P&I
- —
- Monthly cashflow
- —
- DSCR
- —
- Eligible?
- —
Personal DTI + credit; lowest rate.
DSCR
20% down · 8.5% · 30yr
- Down + closing
- —
- Monthly P&I
- —
- Monthly cashflow
- —
- DSCR
- —
- Eligible?
- —
No personal income docs; deal must DSCR.
Hard money
10% down · 12.0% · 12mo
- Down + closing
- —
- Monthly P&I
- —
- Monthly cashflow
- —
- DSCR
- —
- Eligible?
- —
Short-term bridge; refi at stabilization.
Listing history 6 events
-
2026-06-18days on market $430,000 Active 6 DOM
-
2026-06-17days on market $430,000 Active 5 DOM
-
2026-06-16days on market $430,000 Active 4 DOM
-
2026-06-15days on market $430,000 Active 3 DOM
-
2026-06-14remarks 699-char remark
-
2026-06-14$430,000 Active 1 DOM
ⓘ Source: listings_history table (triggers on properties + properties_extension) + one-shot
backfill from property_details.listing_events for pre-trigger history.
Tax reassessment forecast CA · Resets to sale price
- Current annual tax
- $3,030 · $252/mo
- Projected year-2 tax
- $3,268 · $272/mo
- Expected delta
- +$238/yr (+$20/mo · 7.9%)
ⓘ Screening estimate from a state-policy table — verify with the county assessor before closing.
Climate risk First Street
- Flood 6/10 Major FEMA zone X · 27% chance over 30 yrs
- Wildfire 1/10 Low
- Heat 7/10 Severe 7 d/yr ≥103°F today · 15 d/yr by 30 yrs out
- Wind 1/10 Low
- Air quality 10/10 Extreme 30 unhealthy d/yr today · 30 by 30 yrs out
Nearby sold comps map
Loading sold comps map…
Walkable amenities ~0.75 mi
Loading nearby amenities…
Taxation est. · year 1
- Rental income
- $43,188
- − Mortgage interest
- −$24,087
- − Property taxes
- −$3,030
- − Insurance
- −$2,150
- − Repairs & maintenance
- −$3,455
- − Management
- −$3,455
- − Depreciation
- −$12,509
- Taxable loss
- −$5,498
- Est. tax savings @ 24.0%
- +$1,319
- After-tax cash flow
- $3,199/yr
For passive investors: Depreciation is non-cash, so a rental often shows a tax loss while cash-flowing — sheltering income. Rental losses are passive: they offset passive income freely, and up to $25,000/yr can offset ordinary (W-2) income if you actively participate and your MAGI is under $100k (phasing out to $0 by $150k); unused losses carry forward. On sale, claimed depreciation is recaptured at up to 25%, and gains may owe capital-gains tax (a 1031 exchange can defer both). Figures are a year-1 estimate at your 24.0% rate — not tax advice; consult a CPA.
Schools (NCES district)
- District
- Stockton Unified
- NCES district ID
- 0638010
- Math proficiency
- 23% ▲ 2.00%
- Reading proficiency
- 46% ▲ 16.00%
- Median HH income
- $37,563
- Composite
- 28.65/100
- National rank
- #6701
- State rank
- #295 of 517 in CA
Livability — Stockton
- Score
- 57/100
- State rank
- #734
- US rank
- #21638
Category grades
Schools grade is shown separately in the Schools card above.
Census & demographics
- Census place
- Stockton, CA
- County
- San Joaquin County · 729,570 people
- City population
- 332,006
- Metro
- Stockton, CA
- Population (ZIP)
- 15,930
- Household income
- $63,411
- Rent vs Own
- Severe rent burden
- 1034.0
Population outlook (San Joaquin County) Hauer SSP2
- Today (2025)
- 796,965 people
- By 2030
- 828,849 · +4.0%
- By 2040
- 885,611 · +11.1%
- By 2050
- 929,798 · +16.7%
- By 2075
- 994,578 · +24.8%
- By 2100
- 971,291 · +21.9%
Race, ethnicity, and origin ACS 2023
- Neighborhood character
- Diverse neighborhood (Simpson 0.62)
- Race & ethnicity
- Hispanic / Latino 58% White 17% Two or more races 14% Asian 10% Black 9% Native American 5%
- Hispanic origin (detail)
- Mexican 51%
- Common ancestry
- Serbian 1% Lithuanian 1%
- Foreign-born
- 25% · Canada, China
- Languages at home
- 54% English-only · Spanish 38% Other Asian/Pacific 4% Tagalog/Filipino 2%
Political lean MEDSL · San Joaquin
- 2024 margin
- Toss-up / Even · D 48.0% · R 48.9% · Other 3.0%
- 2008→2024 swing
- -11.6pp toward R · 2008: 10.7pp · 2024: -0.9pp
- All cycles
- 2024: R+0.9 2020: D+13.9 2016: D+12.9 2012: D+8.9 2008: D+10.7
Not yet ingested
- Civics
- —
Market trends
- HPI YoY
- ▼ -342.07%
- Current HPI
- 455.9551
- Rent YoY
- —
- Metro
- Stockton, CA
- State GDP YoY
- ▲ 3.21%
- F500 in state
- 116
Industry mix (Fortune 500 HQ in CA)
| Industry | F500 HQs | Revenue |
|---|---|---|
| Technology | 27 | $1,492B |
|
||
| Financial Services | 3 | $174B |
|
||
| Retail | 3 | $44B |
|
||
| Insurance | 3 | $26B |
|
||
| Media / Entertainment | 2 | $115B |
|
||
| Pharmaceuticals / Biotech | 2 | $62B |
|
||
Price history
1 event — show timeline
- 1984-06-01 Sold (Public Records) $64,100 Public Records
Property tax history
+2.0%/yrLatest (2025): $3,030 · +1.6% YoY. Source: county tax records.
Cash-flow waterfall
monthlySold comps — $/sqft
last 12 mo · ≤1 miLoading sold comps…