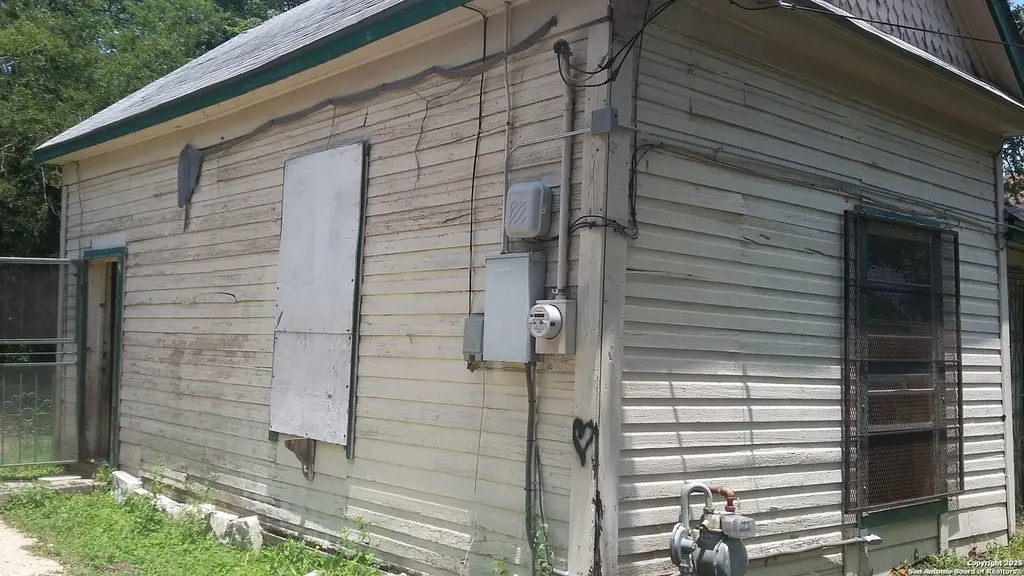
439 Vine St · San Antonio, TX
Flood risk 1/10 · Minimal
- FEMA flood zone
- X (unshaded)
- Chance of flooding over 30 yrs
- 0.0%
- Est. flood insurance / yr
- $507 – $1,088
Fire risk 1/10 · Minimal
- Est. fire insurance / yr
- $1,222 – $2,270
Heat risk 8/10 · Major
- Hot days now (above 108°F)
- 5 days/yr
- Hot days in 30 yrs
- 15 days/yr
Wind risk 8/10 · Major
- Chance of severe wind over 30 yrs
- 80.0%
Air-quality risk 2/10 · Minimal
- Unhealthy air days now
- 1 days/yr
- Unhealthy air days in 30 yrs
- 2 days/yr
Risk factors via First Street. Map © Google.
Why this score? — see what drove the C+ grade
The composite is a weighted blend of 9 inputs, each scored 0–100. Each bar is that input's sub-score; the figure is the points it added to the 100-point composite (weight × sub-score).
- Cash flow +22.7/30.0
- ARV discount +15.0/15.0
- 1% rule +7.5/10.0
- DSCR +7.3/10.0
- Livability +4.0/5.0
- Rent growth +2.8/5.0
- Condition / age +2.5/5.0
- Schools +1.4/10.0
- Appreciation +0.0/10.0
$95,000
🖨 Deal sheet 📄 Offer letter ✓ Due diligence
Listing remarks MLS
One bedroom, one bath home with a .1924 acre lot. 773 sq. ft. per Bexar CAD. Fixer upper.
Key facts
- 8,380 sq ft lot
- Built 1930
- Listed 498 days
Neighborhood map
What this means for you Summary
Snapshot
- This is a 2-bed/1.0-bath single-family listed at $95k.
Deal economics
- At list price, monthly cash flow is $164 ($2k/yr) — positive.
- The deal already cash-flows at list — no discount required.
- Meets the 1% rule at list price ($1k rent vs $95k).
- Recommended offer: $84k (12.0% below list) — sets the bar for market timing.
- Cap rate 8.4% vs local median 3.8% in San Antonio — top-decile yield for the area; either an underpriced asset or a hidden risk that comps aren't pricing in. Stress-test before assuming the spread holds.
Location & tenants
- Location reads 80/100 on livability (#31 in TX, #1,616 nationally) — a professional / high-income tenant draw. Strengths: amenities A+, commute A+, cost of living A+; Watch: schools C-, crime F.
- San Antonio ISD (urban): math 12% / reading 22% proficiency, ranked #805 of 826 in TX (top 98%) — low school quality limits family demand, transient renter base, plan for 1-2y turnover; 80% free/reduced lunch — lower-income household profile, screen leases tightly.
- Market conditions: Rents rising (+1.1%/yr); 269 active listings in the ZIP; 40 comparable units currently listed for rent nearby; rentals at typical pace (median 24d on market — plan ~3-4 weeks tenant-placement turnaround); 8,308 units permitted in Bexar County in 2024 (2,506 in 5+ unit buildings).
Forward outlook
- Local home prices are declining (-3.0%/yr); year-one equity from $657 of loan paydown is wiped out by about $3k of value loss. Plan a longer hold.
- Bexar County population projected at +50% by 2050 — long-run rental-demand tailwind backs the buy-and-hold thesis.
Negotiation context
- It's been on market 498 days — a 12% lower offer ($84k) is reasonable based on typical stale-listing flexibility.
- 3 sale attempts since 14y ago with the ask held roughly flat each time — persistent listings suggest the price (not the market) is what's stuck; bring a comps-based counter.
Risks & watch-outs
- Watch-outs: property tax is 3.0% of price; built in 1930 — expect roof / HVAC / electrical / plumbing capex.
- Climate carrying-cost: severe wind risk, 80% chance of damaging wind over 30y; extreme-heat days projected 5→15/yr by 2055 (HVAC capex compounding) — expect insurance premiums to compound above CPI over the hold.
Questions for the listing agent
- It's been on market 498 days. Have you received any prior offers? Is the seller open to a 12% concession, seller financing, or rate buy-down credit?
- Built in 1930 — when were the roof, HVAC, electrical panel, plumbing, and water heater last replaced?
- Property tax is high relative to price — has the assessment been appealed recently, and will the sale trigger a re-assessment?
- Why hasn't it sold? Are there any deal-killer items the seller is aware of (foundation, flood, title, zoning, code violations)?
- Is there a deadline driving the sale (1031 exchange, divorce, estate, relocation)? That informs how much negotiation room exists.
- Crime grade is F in this area — have there been break-ins, vandalism, or insurance claims at this property in the last 3 years? What carrier currently insures it and at what premium?
- What's the average days-on-market for RENTAL listings here right now (not sales)? A rising rental-DOM trend means longer vacancies and softer asking-rent achievability than the comps imply.
- What's the recent tenant-quality profile in this submarket — average credit score on applications, eviction rate, late-payment / NSF rate, and stable-employment percentage? A property-management company in the area should have these aggregated.
- How much new for-sale + rental construction is in the pipeline within 1–3 miles? Heavy new supply typically softens prices + rents 12–24 months out; constrained supply supports both.
Investment metrics
- 1% rule
- 1.25% ✓
- Cap rate
- 8.36%
- Cash-on-cash
- 7.39%
- DSCR
- 1.33
- GRM
- 6.7
CMA / ARV
- ARV (median comp)
- $165,276
- List price
- $95,000
- Delta
- -42.52%
- Verdict
- UNDERPRICED
- Comps
- 20 within 1.0 mi
Show comp detail 6 sales within ~0.75 mi
| Address | Dist | Beds/Ba | Sqft | Sold | Price | $/sf | Match |
|---|---|---|---|---|---|---|---|
| 330 Vine | 0.15mi | 2/1.0 | 796 (+3%) | 20mo | $95,900 | $120 | 71 |
| 116 Magendie St | 0.13mi | 2/1.0 | 660 (-15%) | 17mo | $65,000 | $98 | 55 |
| 1012 Porter St | 0.18mi | 2/1.0 | 690 (-11%) | 23mo | $65,000 | $94 | 54 |
| 2117 Virginia Blvd | 0.20mi | 2/1.0 | 876 (+13%) | 19mo | $95,000 | $108 | 53 |
| 1031 E Drexel Ave | 0.54mi | 2/1.0 | 810 (+5%) | 21mo | $219,900 | $271 | 50 |
| 339 Cooper St | 0.40mi | 2/1.0 | 665 (-14%) | 20mo | $130,000 | $195 | 41 |
Match score weights: distance 35% · size 25% · config 20% · recency 20%. Top-matched comps best support the ARV.
Projected returns pro-forma
-3.0% appreciation · 1.07% rent growth · sell at horizon
- IRR
- -7.4%
- Equity multiple
- 0.73×
- Total profit
- $-7,123
- Equity at exit
- $14,165
- IRR
- -0.8%
- Equity multiple
- 0.95×
- Total profit
- $-1,307
- Equity at exit
- $8,214
Cash invested: $26,600 (down + closing). Projections, not guarantees.
Landlord ↔ Tenant lean methodology
- Overall (STATE)
- 87 Strongly Landlord-Friendly
- State Texas
- 87 Strongly Landlord-Friendly · R+5
- County
- — inherits STATE
- City
- — inherits STATE
ZIP-level market 78210
- Rents YoY
- 1.1%
- Active inventory
- 269
- Price-to-rent
- 6.7×
Monthly cashflow live
- Estimated rent
- $1,184 high interval (Pro) →
- Mortgage (P&I)
- −$498
- Tax from tax record
- −$234 /mo · $2,807/yr
- Insurance
- −$40
- HOA
- −$0
- Vacancy / Maint / Mgmt
- −$249
- Net cashflow
- $164
Break-even live
UW: 25.0% down · 7.5% · 30yr · 1.5% tax · 5.0% vac · 8.0% maint · 8.0% mgmt
Financing live
Cash to close
- Down payment
- $23,750
- Closing costs
- $2,850
- Reserves months
- —
- Total cash needed
- —
Loan-product check · same deal, 3 products live
Conventional
25% down · 7.5% · 30yr
- Down + closing
- —
- Monthly P&I
- —
- Monthly cashflow
- —
- DSCR
- —
- Eligible?
- —
Personal DTI + credit; lowest rate.
DSCR
20% down · 8.5% · 30yr
- Down + closing
- —
- Monthly P&I
- —
- Monthly cashflow
- —
- DSCR
- —
- Eligible?
- —
No personal income docs; deal must DSCR.
Hard money
10% down · 12.0% · 12mo
- Down + closing
- —
- Monthly P&I
- —
- Monthly cashflow
- —
- DSCR
- —
- Eligible?
- —
Short-term bridge; refi at stabilization.
Rent comps 40 comps
| Address | Beds | Baths | Sqft | Rent | $/sqft | DOM | Units | Dist |
|---|---|---|---|---|---|---|---|---|
| 515 Clark Ave San Antonio, TX | 3.0 | 2.0 | 528 | $1,250 | $2.37 | 24d | 1 | 0.11mi |
| 342 Vine St Unit B San Antonio, TX | 2.0 | 1.0 | 768 | $875 | $1.14 | 44d | 1 | 0.12mi |
| 342 Vine St San Antonio, TX | 2.0 | 1.0 | 768 | $995 | $1.30 | 24d | 1 | 0.12mi |
| 125 Magendie St San Antonio, TX | 2.0 | 2.0 | 820 | $1,323 | $1.61 | 4d | 1 | 0.13mi |
| 526 Cooper St Unit B San Antonio, TX | 1.0 | 1.0 | 600 | $895 | $1.49 | 44d | 1 | 0.15mi |
| 420 Clark Ave San Antonio, TX | 2.0 | 1.0 | 756 | $1,295 | $1.71 | 18d | 1 | 0.16mi |
| 512 Cooper St San Antonio, TX | 2.0 | 1.0 | 1116 | $1,295 | $1.16 | 24d | 1 | 0.17mi |
| 1431 Aransas Ave San Antonio, TX | 3.0 | 1.0 | 1108 | $1,195 | $1.08 | 15d | 1 | 0.19mi |
| 616 Porter St Unit 618-p San Antonio, TX | 1.0 | 1.0 | 680 | $895 | $1.32 | 4d | 1 | 0.46mi |
| 143 Ranger Unit 101 San Antonio, TX | 3.0 | 2.0 | 876 | $1,099 | $1.25 | 2d | 1 | 0.48mi |
| 413 Nopal St Unit 102 San Antonio, TX | 2.0 | 1.0 | 743 | $1,450 | $1.95 | 2d | 1 | 0.53mi |
| 1005 Essex St Unit 101 San Antonio, TX | 2.0 | 2.0 | 800 | $1,425 | $1.78 | 2d | 1 | 0.53mi |
| 1005 Essex St Unit 202 San Antonio, TX | 2.0 | 2.0 | 800 | $1,450 | $1.81 | 44d | 1 | 0.53mi |
| 314 Maryland St Unit 102 San Antonio, TX | 2.0 | 2.5 | 1055 | $1,295 | $1.23 | 44d | 1 | 0.59mi |
| 926 E Drexel Ave Unit 1 San Antonio, TX | 1.0 | 1.0 | 850 | $975 | $1.15 | 24d | 1 | 0.60mi |
| 1303 Rigsby Ave Unit 610 San Antonio, TX | 1.0 | 1.0 | 750 | $984 | $1.31 | 3d | 1 | 0.61mi |
| 1303 Rigsby Ave Unit 710 San Antonio, TX | 2.0 | 2.0 | 950 | $1,173 | $1.23 | 3d | 1 | 0.61mi |
| 227 S Grimes St Unit 202 San Antonio, TX | 3.0 | 2.5 | 1089 | $1,550 | $1.42 | 44d | 1 | 0.65mi |
| 918 Hampton St Unit 1 San Antonio, TX | 3.0 | 1.0 | 912 | $975 | $1.07 | 44d | 1 | 0.69mi |
| 838 Hammond Ave San Antonio, TX | 2.0 | 1.0 | 888 | $1,300 | $1.46 | 44d | 1 | 0.71mi |
| 843 Rigsby Ave Unit 2 San Antonio, TX | 1.0 | 1.0 | 600 | $1,100 | $1.83 | 24d | 1 | 0.74mi |
| 241 Delmar St San Antonio, TX | 2.0 | 1.0 | 758 | $1,120 | $1.48 | 24d | 1 | 0.77mi |
| 730 Aransas Ave Unit 3 San Antonio, TX | 2.0 | 1.0 | 800 | $975 | $1.22 | 44d | 1 | 0.78mi |
| 136 Nelson Ave San Antonio, TX | 3.0 | 1.0 | 1092 | $1,316 | $1.21 | 44d | 1 | 0.78mi |
| 726 Denver Blvd Unit 3 San Antonio, TX | 1.0 | 1.0 | 525 | $865 | $1.65 | 44d | 1 | 0.83mi |
| 610 Belmont San Antonio, TX | 2.0 | 1.0 | 1050 | $1,195 | $1.14 | 44d | 1 | 0.84mi |
| 1829 E Highland Blvd San Antonio, TX | 2.0 | 1.0 | 640 | $950 | $1.48 | 44d | 1 | 0.84mi |
| 647 Hammond Ave Unit 201 San Antonio, TX | 2.0 | 1.0 | 780 | $1,110 | $1.42 | 24d | 1 | 0.85mi |
| 647 Hammond Ave San Antonio, TX | 2.0 | 1.0 | 660 | $1,040 | $1.58 | 18d | 1 | 0.85mi |
| 647 Hammond Ave San Antonio, TX | 2.0 | 1.0 | 780 | $1,110 | $1.42 | 20d | 1 | 0.85mi |
| 647 Hammond Ave Unit 101 San Antonio, TX | 2.0 | 1.0 | 660 | $1,040 | $1.58 | 24d | 1 | 0.85mi |
| 308 Belmont San Antonio, TX | 1.0 | 1.0 | 700 | $850 | $1.21 | 24d | 1 | 0.89mi |
| 311 Spriggsdale Ave Unit 710 San Antonio, TX | 2.0 | 2.0 | 890 | $981 | $1.10 | 3d | 1 | 0.91mi |
| 311 Spriggsdale Ave Unit 610 San Antonio, TX | 1.0 | 1.0 | 745 | $892 | $1.20 | 3d | 1 | 0.91mi |
| 1301 S Palmetto San Antonio, TX | 2.0 | 1.0 | 836 | $1,150 | $1.38 | 4d | 1 | 0.91mi |
| 1435 Gibbs San Antonio, TX | 3.0 | 1.0 | 975 | $1,435 | $1.47 | 24d | 1 | 0.96mi |
| 723 Sewanee St San Antonio, TX | 3.0 | 2.0 | 1028 | $1,264 | $1.23 | 12d | 1 | 0.99mi |
| 803 Piedmont Ave San Antonio, TX | 3.0 | 1.0 | 860 | $1,450 | $1.69 | 24d | 1 | 1.00mi |
| 803 Piedmont Ave San Antonio, TX | 3.0 | 1.0 | 1000 | $1,350 | $1.35 | 44d | 1 | 1.00mi |
| 3030 Martin Luther King Dr San Antonio, TX | 3.0 | 1.0 | 938 | $1,295 | $1.38 | 24d | 1 | 1.00mi |
Listing history 26 events
-
2026-06-18days on market $95,000 Active 498 DOM
-
2026-06-17days on market $95,000 Active 497 DOM
-
2026-06-16days on market $95,000 Active 496 DOM
-
2026-06-15days on market $95,000 Active 495 DOM
-
2026-06-13days on market $95,000 Active 493 DOM
-
2026-06-09days on market $95,000 Active 489 DOM
-
2026-06-08days on market $95,000 Active 488 DOM
-
2026-06-07days on market $95,000 Active 487 DOM
-
2026-06-04days on market $95,000 Active 484 DOM
-
2026-06-03days on market $95,000 Active 483 DOM
-
2026-06-02days on market $95,000 Active 482 DOM
-
2026-06-01days on market $95,000 Active 481 DOM
-
2026-05-31days on market $95,000 Active 480 DOM
-
2025-02-05$95,000 New
-
2019-08-07soldstatus
-
2019-08-06soldstatus Sold 91-char remark
Show marketing remark (91 chars)
One bedroom, one bath home with a .1924 acre lot. 773 sq. ft. per Bexar CAD. Fixer upper.
-
2019-08-04status Pending 91-char remark
Show marketing remark (91 chars)
One bedroom, one bath home with a .1924 acre lot. 773 sq. ft. per Bexar CAD. Fixer upper.
-
2019-07-22historical Active Option 91-char remark
Show marketing remark (91 chars)
One bedroom, one bath home with a .1924 acre lot. 773 sq. ft. per Bexar CAD. Fixer upper.
-
2019-07-02price $55,000 91-char remark
Show marketing remark (91 chars)
One bedroom, one bath home with a .1924 acre lot. 773 sq. ft. per Bexar CAD. Fixer upper.
-
2019-06-24price $62,000 91-char remark
Show marketing remark (91 chars)
One bedroom, one bath home with a .1924 acre lot. 773 sq. ft. per Bexar CAD. Fixer upper.
-
2019-06-23$72,000 New 91-char remark
Show marketing remark (91 chars)
One bedroom, one bath home with a .1924 acre lot. 773 sq. ft. per Bexar CAD. Fixer upper.
-
2012-06-11historical
-
2012-03-16$29,900
-
2003-08-18soldstatus
-
1999-12-02soldstatus
-
1994-12-01soldstatus
ⓘ Source: listings_history table (triggers on properties + properties_extension) + one-shot
backfill from property_details.listing_events for pre-trigger history.
Tax reassessment forecast TX · Resets to sale price
- Current annual tax
- $2,807 · $234/mo
- Projected year-2 tax
- $2,807 · $234/mo
- Expected delta
- $0/yr ($0/mo · 0.0%)
ⓘ Screening estimate from a state-policy table — verify with the county assessor before closing.
Climate risk First Street
- Flood 1/10 Low FEMA zone X (unshaded) · 0% chance over 30 yrs
- Wildfire 1/10 Low
- Heat 8/10 Severe 5 d/yr ≥108°F today · 15 d/yr by 30 yrs out
- Wind 8/10 Severe 80% chance of damaging wind over 30 yrs
- Air quality 2/10 Low 1 unhealthy d/yr today · 2 by 30 yrs out
Nearby sold comps map
Loading sold comps map…
Walkable amenities ~0.75 mi
Loading nearby amenities…
Taxation est. · year 1
- Rental income
- $14,211
- − Mortgage interest
- −$5,321
- − Property taxes
- −$2,807
- − Insurance
- −$475
- − Repairs & maintenance
- −$1,137
- − Management
- −$1,137
- − Depreciation
- −$2,764
- Taxable income
- $571
- Est. tax owed @ 24.0%
- −$137
- After-tax cash flow
- $1,830/yr
For passive investors: Depreciation is non-cash, so a rental often shows a tax loss while cash-flowing — sheltering income. Rental losses are passive: they offset passive income freely, and up to $25,000/yr can offset ordinary (W-2) income if you actively participate and your MAGI is under $100k (phasing out to $0 by $150k); unused losses carry forward. On sale, claimed depreciation is recaptured at up to 25%, and gains may owe capital-gains tax (a 1031 exchange can defer both). Figures are a year-1 estimate at your 24.0% rate — not tax advice; consult a CPA.
Schools (NCES district)
- District
- San Antonio ISD
- NCES district ID
- 4838730
- Math proficiency
- 12% ▼ -21.00%
- Reading proficiency
- 22% ▼ -7.00%
- Median HH income
- $30,952
- Composite
- 13.57/100
- National rank
- #9512
- State rank
- #805 of 826 in TX
Livability — San Antonio
- Score
- 80/100
- State rank
- #31
- US rank
- #1616
Category grades
Schools grade is shown separately in the Schools card above.
Census & demographics
- Census place
- San Antonio, TX
- County
- Bexar County · 1,990,555 people
- City population
- 1,806,925
- Metro
- San Antonio-New Braunfels, TX
- Population (ZIP)
- 34,940
- Household income
- $55,028
- Rent vs Own
- Severe rent burden
- 1708.0
Population outlook (Bexar County) Hauer SSP2
- Today (2025)
- 2,336,851 people
- By 2030
- 2,560,728 · +9.6%
- By 2040
- 3,020,569 · +29.3%
- By 2050
- 3,493,522 · +49.5%
- By 2075
- 4,668,459 · +99.8%
- By 2100
- 5,533,242 · +136.8%
Race, ethnicity, and origin ACS 2023
- Neighborhood character
- Predominantly Hispanic (83%)
- Race & ethnicity
- Hispanic / Latino 83% Two or more races 29% White 11% Black 4% Native American 2%
- Hispanic origin (detail)
- Mexican 72% Puerto Rican 2%
- Common ancestry
- Lithuanian 1%
- Foreign-born
- 12% · Canada
- Languages at home
- 55% English-only · Spanish 44%
Political lean MEDSL · Bexar
- 2024 margin
- Lean D (+9.8) · D 54.3% · R 44.6% · Other 1.1%
- 2008→2024 swing
- +4.2pp toward D · 2008: 5.6pp · 2024: 9.8pp
- All cycles
- 2024: D+9.8 2020: D+18.2 2016: D+13.5 2012: D+4.6 2008: D+5.6
Not yet ingested
- Civics
- —
Market trends
- HPI YoY
- ▼ -163.42%
- Current HPI
- 286.299
- Rent YoY
- ▲ 1.07%
- Metro
- San Antonio-New Braunfels, TX
- State GDP YoY
- ▲ 3.95%
- F500 in state
- 110
Industry mix (Fortune 500 HQ in TX)
| Industry | F500 HQs | Revenue |
|---|---|---|
| Energy | 16 | $1,198B |
|
||
| Technology | 5 | $198B |
|
||
| Engineering / Construction | 4 | $72B |
|
||
| Energy Services | 3 | $60B |
|
||
| Utilities | 3 | $41B |
|
||
| Healthcare | 2 | $330B |
|
||
Price history
+217.7% since first listed13 events — show timeline
- 2025-02-05 Listed $95,000 LERA
- 2019-08-07 Sold (Public Records) — Public Records
- 2019-08-06 Sold (MLS) — LERA
- 2019-08-04 Pending — LERA
- 2019-07-22 Contingent — LERA
- 2019-07-02 Price Changed $55,000 LERA
- 2019-06-24 Price Changed $62,000 LERA
- 2019-06-23 Listed $72,000 LERA
- 2012-06-11 Listing Removed — LERA
- 2012-03-16 Listed $29,900 LERA
- 2003-08-18 Sold (Public Records) — Public Records
- 1999-12-02 Sold (Public Records) — Public Records
- 1994-12-01 Sold (Public Records) — Public Records
Property tax history
+10.8%/yrLatest (2025): $2,807 · +0.0% YoY. Source: county tax records.
Cash-flow waterfall
monthlySold comps — $/sqft
last 12 mo · ≤1 miLoading sold comps…