7700 Nicole Dr · Plainfield, MI
Flood risk 1/10 · Minimal
- FEMA flood zone
- X (unshaded)
- Chance of flooding over 30 yrs
- 0.0%
- Est. flood insurance / yr
- $507 – $1,088
Fire risk 5/10 · Moderate
- Est. fire insurance / yr
- $784 – $1,456
Heat risk 1/10 · Minimal
- Hot days now (above 94°F)
- 7 days/yr
- Hot days in 30 yrs
- 13 days/yr
Wind risk 1/10 · Minimal
- Chance of severe wind over 30 yrs
- —
Air-quality risk 2/10 · Minimal
- Unhealthy air days now
- 0 days/yr
- Unhealthy air days in 30 yrs
- 1 days/yr
Risk factors via First Street. Map © Google.
Why this score? — see what drove the D grade
The composite is a weighted blend of 9 inputs, each scored 0–100. Each bar is that input's sub-score; the figure is the points it added to the 100-point composite (weight × sub-score).
- ARV discount +15.0/15.0
- Cash flow +9.1/30.0
- Appreciation +5.3/10.0
- Schools +3.6/10.0
- DSCR +2.5/10.0
- Rent growth +2.5/5.0
- Livability +2.5/5.0
- Condition / age +2.5/5.0
- 1% rule +1.9/10.0
$129,000
🖨 Deal sheet 📄 Offer letter ✓ Due diligence
Listing remarks MLS
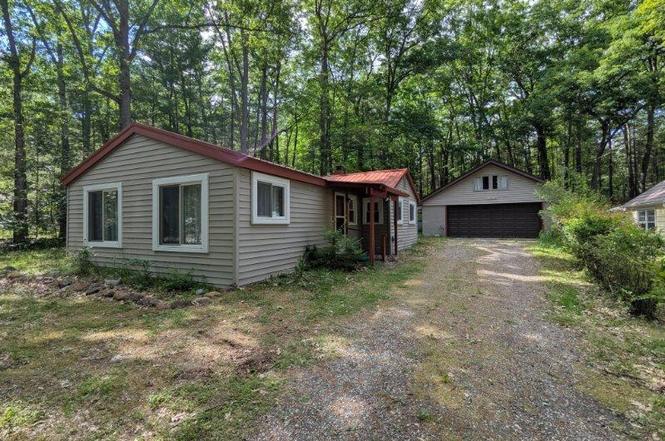
Very well maintained cottage with access to Jose Lake directly across the street from the house. This 2 bed 1 bath home has been loved by the current owner for may years and pride of ownership shows. Nice view of the lake looking out the living room window to watch the lake activities. 24x24 two car garage is perfect to store all your weekend or up north stuff. Ready yo move into and enjoy the summer of 2026. Located close to the Huron National Forest lands and the AuSable River.
Key facts
- Access to jose lake
- View of the lake
- 0.27 acre lot
Tags
Property features AI
Exterior
- Parking: Detached 2-car garage (24 x 24)
- Utilities: Private well water; Septic system; Electric water heater; Cable available
- Home design: Single-story residential home; Built in 1955
- Construction: Vinyl siding; Slab foundation
- Exterior features: Water view of an interior lake; Subdivision setting; Gravel road access
Interior
- Kitchen: Kitchen on main level (approx. 12 x 10); Vinyl flooring; Range/oven; Refrigerator; Dishwasher not listed
- Bedrooms: Two main-level bedrooms (each about 12 x 8) with carpet
- Flooring: Carpet in living areas, family room, dining room, and bedrooms; Vinyl in kitchen
- Bathrooms: One full bathroom on the main level
- Heating & cooling: Baseboard heating; Space heater; Heat sources: Electric and LP/propane
- Interior features: Fireplace; Pantry; Window treatments
- Laundry & utility: Washer and dryer; Laundry room on main level
Neighborhood map
What this means for you Summary
Snapshot
- This is a 2-bed/1.0-bath single-family listed at $129k.
Deal economics
- At list price, monthly cash flow is $-99 ($-1k/yr) — negative.
- To cash-flow at today's rent, offer at most $111k (13.6% below list).
- To meet the 1% rule (rent ≥ 1% of price), the offer needs to be $89k (31.3% below list).
- Recommended offer: $89k (31.3% below list) — sets the bar for 1% rule.
Location & tenants
- Location reads: area grade D — affects rentability + tenant quality, not the cash-flow math above.
- Hale Area Schools (rural): math 35% / reading 45% proficiency, ranked #402 of 760 in MI (top 53%) — families likely to look elsewhere, expect single-tenant / working-renter base with shorter leases.
- Market conditions: 19 active listings in the ZIP; 58 units permitted in Iosco County in 2024 (0 in 5+ unit buildings).
Forward outlook
- In year one you build about $2k of equity ($892 loan paydown + $698 appreciation (0.5% local appreciation)).
- Iosco County population projected at -14% by 2050 — secular population decline; favor cash flow + early exit over multi-decade hold.
Negotiation context
- Only 3 days on market — expect competitive offers; lowballing is unlikely to land.
- 4 sale attempts since 10y ago with the ask held roughly flat each time — persistent listings suggest the price (not the market) is what's stuck; bring a comps-based counter.
- Current owner paid $67k; list at $129k implies a 92% gain — meaningful room to come down on a strong offer.
Risks & watch-outs
- Watch-outs: built in 1955 — expect roof / HVAC / electrical / plumbing capex.
- Climate carrying-cost: moderate wildfire risk — expect insurance premiums to compound above CPI over the hold.
Questions for the listing agent
- What do current leases actually rent for vs. the listed asking? Can we see a recent rent roll and the last 12 months of T-12 income?
- Built in 1955 — when were the roof, HVAC, electrical panel, plumbing, and water heater last replaced?
- Is there a deadline driving the sale (1031 exchange, divorce, estate, relocation)? That informs how much negotiation room exists.
- The area grade is low — what's the realistic commute time and amenity access for the typical tenant pool here? Any planned neighborhood developments (good or bad) we should know about?
- What's the average days-on-market for RENTAL listings here right now (not sales)? A rising rental-DOM trend means longer vacancies and softer asking-rent achievability than the comps imply.
- What's the recent tenant-quality profile in this submarket — average credit score on applications, eviction rate, late-payment / NSF rate, and stable-employment percentage? A property-management company in the area should have these aggregated.
- How much new for-sale + rental construction is in the pipeline within 1–3 miles? Heavy new supply typically softens prices + rents 12–24 months out; constrained supply supports both.
Investment metrics
- 1% rule
- 0.69% ✗
- Cap rate
- 5.37%
- Cash-on-cash
- -3.29%
- DSCR
- 0.85
- GRM
- 12.1
CMA / ARV
- ARV (on-the-fly)
- $256,908
- Comps found
- 4
Show comp detail 4 sales within ~0.75 mi
| Address | Dist | Beds/Ba | Sqft | Sold | Price | $/sf | Match |
|---|---|---|---|---|---|---|---|
| 7752 Nicole Dr | 0.29mi | 2/1.0 | 1,000 (+6%) | 12mo | $175,000 | $175 | 67 |
| 6875 Jose Lake Rd | 0.43mi | 1/1.0 (-1) | 960 (+1%) | 11mo | $260,000 | $271 | 64 |
| 6970 Jose Lake Rd | 0.40mi | 2/1.0 | 854 (-10%) | 21mo | $85,000 | $100 | 47 |
| 7171 Jose Lake Rd | 0.31mi | 3/1.0 (+1) | 1,080 (+14%) | 13mo | $377,800 | $350 | 47 |
Match score weights: distance 35% · size 25% · config 20% · recency 20%. Top-matched comps best support the ARV.
Projected returns pro-forma
0.54% appreciation · 3.0% rent growth · sell at horizon
- IRR
- -3.9%
- Equity multiple
- 0.81×
- Total profit
- $-6,811
- Equity at exit
- $40,986
- IRR
- 1.6%
- Equity multiple
- 1.18×
- Total profit
- $6,528
- Equity at exit
- $52,180
Cash invested: $36,120 (down + closing). Projections, not guarantees.
Landlord ↔ Tenant lean methodology
- Overall (STATE)
- 62 Landlord-Friendly
- State Michigan
- 62 Landlord-Friendly · EVEN
- County
- — inherits STATE
- City
- — inherits STATE
ZIP-level market 48761
- Home prices YoY
- 0.3%
- Active inventory
- 19
- Price-to-rent
- 12.1×
Monthly cashflow live
- Estimated rent
- $887 medium interval (Pro) →
- Mortgage (P&I)
- −$676
- Tax from tax record
- −$69 /mo · $831/yr
- Insurance
- −$54
- HOA
- −$0
- Vacancy / Maint / Mgmt
- −$186
- Net cashflow
- $-99
Break-even live
UW: 25.0% down · 7.5% · 30yr · 1.5% tax · 5.0% vac · 8.0% maint · 8.0% mgmt
Financing live
Cash to close
- Down payment
- $32,250
- Closing costs
- $3,870
- Reserves months
- —
- Total cash needed
- —
Loan-product check · same deal, 3 products live
Conventional
25% down · 7.5% · 30yr
- Down + closing
- —
- Monthly P&I
- —
- Monthly cashflow
- —
- DSCR
- —
- Eligible?
- —
Personal DTI + credit; lowest rate.
DSCR
20% down · 8.5% · 30yr
- Down + closing
- —
- Monthly P&I
- —
- Monthly cashflow
- —
- DSCR
- —
- Eligible?
- —
No personal income docs; deal must DSCR.
Hard money
10% down · 12.0% · 12mo
- Down + closing
- —
- Monthly P&I
- —
- Monthly cashflow
- —
- DSCR
- —
- Eligible?
- —
Short-term bridge; refi at stabilization.
Listing history 5 events
-
2026-06-18days on market $129,000 Active 3 DOM
-
2026-06-17$129,000 Active 2 DOM
-
2026-06-17days on market $129,000 Active 2 DOM
-
2026-06-16remarks 484-char remark
-
2026-06-16$129,000 Active 1 DOM
ⓘ Source: listings_history table (triggers on properties + properties_extension) + one-shot
backfill from property_details.listing_events for pre-trigger history.
Tax reassessment forecast MI · Partial reset (capped growth)
- Current annual tax
- $831 · $69/mo
- Projected year-2 tax
- $1,409 · $117/mo
- Expected delta
- +$578/yr (+$48/mo · 69.6%)
ⓘ Screening estimate from a state-policy table — verify with the county assessor before closing.
Climate risk First Street
- Flood 1/10 Low FEMA zone X (unshaded) · 0% chance over 30 yrs
- Wildfire 5/10 Major
- Heat 1/10 Low 7 d/yr ≥94°F today · 13 d/yr by 30 yrs out
- Wind 1/10 Low
- Air quality 2/10 Low 0 unhealthy d/yr today · 1 by 30 yrs out
Nearby sold comps map
Loading sold comps map…
Walkable amenities ~0.75 mi
Loading nearby amenities…
Taxation est. · year 1
- Rental income
- $10,639
- − Mortgage interest
- −$7,226
- − Property taxes
- −$831
- − Insurance
- −$645
- − Repairs & maintenance
- −$851
- − Management
- −$851
- − Depreciation
- −$3,753
- Taxable loss
- −$3,518
- Est. tax savings @ 24.0%
- +$844
- After-tax cash flow
- $-345/yr
For passive investors: Depreciation is non-cash, so a rental often shows a tax loss while cash-flowing — sheltering income. Rental losses are passive: they offset passive income freely, and up to $25,000/yr can offset ordinary (W-2) income if you actively participate and your MAGI is under $100k (phasing out to $0 by $150k); unused losses carry forward. On sale, claimed depreciation is recaptured at up to 25%, and gains may owe capital-gains tax (a 1031 exchange can defer both). Figures are a year-1 estimate at your 24.0% rate — not tax advice; consult a CPA.
Schools (NCES district)
- District
- Hale Area Schools
- NCES district ID
- 2617370
- Math proficiency
- 35% ▲ 5.00%
- Reading proficiency
- 45% ▲ 10.00%
- Median HH income
- $35,292
- Composite
- 35.5/100
- National rank
- #9750
- State rank
- #402 of 760 in MI
Livability — Plainfield
No livability data for this city. (Only ~50 U.S. cities are tracked.)
Census & demographics
- Population (ZIP)
- 804
Population outlook (Iosco County) Hauer SSP2
- Today (2025)
- 24,366 people
- By 2030
- 23,622 · -3.1%
- By 2040
- 22,021 · -9.6%
- By 2050
- 20,877 · -14.3%
- By 2075
- 18,792 · -22.9%
- By 2100
- 15,465 · -36.5%
Race, ethnicity, and origin ACS 2023
- Neighborhood character
- Predominantly White (97%)
- Race & ethnicity
- White 97% Two or more races 3%
- Common ancestry
- Lithuanian 14% Romanian 13% Slovak 5%
- Foreign-born
- 1% · Canada
- Languages at home
- 98% English-only · Spanish 1%
Political lean MEDSL · Iosco
- 2024 margin
- Solid R (+30.6) · D 34.0% · R 64.5% · Other 1.5%
- 2008→2024 swing
- -35.7pp toward R · 2008: 5.1pp · 2024: -30.6pp
- All cycles
- 2024: R+30.6 2020: R+28.6 2016: R+30.0 2012: R+5.0 2008: D+5.1
Not yet ingested
- Civics
- —
Market trends
- HPI YoY
- ▲ 0.54%
- Current HPI
- 176.0313
- Rent YoY
- —
- Metro
- —
- State GDP YoY
- ▲ 1.37%
- F500 in state
- 28
Industry mix (Fortune 500 HQ in MI)
| Industry | F500 HQs | Revenue |
|---|---|---|
| Automotive Parts | 3 | $48B |
|
||
| Automotive | 2 | $372B |
|
||
| Chemicals | 1 | $45B |
|
||
| Automotive Retail | 1 | $29B |
|
||
| Healthcare / Medical Devices | 1 | $23B |
|
||
| Automotive Technology | 1 | $20B |
|
||
Price history
+92.0% since first listed7 events — show timeline
- 2026-06-15 Listed $129,000 REALCOMP
- 2026-06-15 Listed $129,000 MiRealSource-MiMLS
- 2017-05-20 Listing Removed — REALCOMP
- 2017-05-20 Listing Removed — MiRealSource-MiMLS
- 2016-05-20 Listed $63,000 REALCOMP
- 2016-05-20 Listed $63,000 MiRealSource-MiMLS
- 2008-07-01 Sold (Public Records) $67,200 Public Records
Property tax history
-0.4%/yrLatest (2025): $831 · +3.5% YoY. Source: county tax records.
Cash-flow waterfall
monthlySold comps — $/sqft
last 12 mo · ≤1 miLoading sold comps…