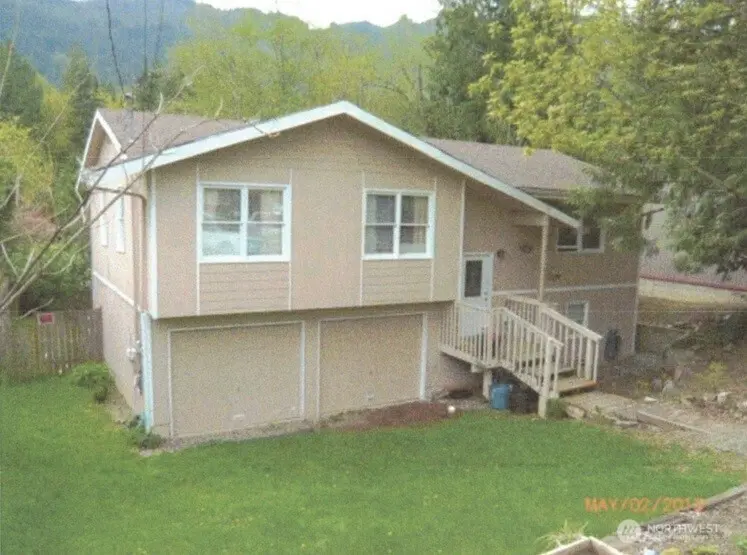
533 Reedway Way · Alger, WA
Flood risk 1/10 · Minimal
- FEMA flood zone
- X (unshaded)
- Chance of flooding over 30 yrs
- 0.0%
- Est. flood insurance / yr
- $507 – $1,088
Fire risk 2/10 · Minimal
- Est. fire insurance / yr
- $604 – $1,122
Heat risk 2/10 · Minimal
- Hot days now (above 84°F)
- 8 days/yr
- Hot days in 30 yrs
- 20 days/yr
Wind risk 1/10 · Minimal
- Chance of severe wind over 30 yrs
- —
Air-quality risk 7/10 · Major
- Unhealthy air days now
- 11 days/yr
- Unhealthy air days in 30 yrs
- 11 days/yr
Risk factors via First Street. Map © Google.
Why this score? — see what drove the D+ grade
The composite is a weighted blend of 9 inputs, each scored 0–100. Each bar is that input's sub-score; the figure is the points it added to the 100-point composite (weight × sub-score).
- ARV discount +15.0/15.0
- Appreciation +10.0/10.0
- Cash flow +8.2/30.0
- Schools +4.2/10.0
- Livability +2.9/5.0
- Rent growth +2.5/5.0
- Condition / age +2.5/5.0
- DSCR +2.2/10.0
- 1% rule +2.1/10.0
$392,500
🖨 Deal sheet 📄 Offer letter ✓ Due diligence
Listing remarks
Lotsa sqft - almost 2,500 - Home & property need TLC. Garage could be useable I believe with some grading. 5 bedroom, 2 bath home.
Key facts
- 7,405 sq ft lot
- 3 parking spots
- Community pool
Property features AI
Finance
- Other: Zoning: R2A; Lot number 12; lot dimensions 60 x 120 x 61 x 121; lot size ~0.17 acres; Pool: community pool available
- Financial info: Listing accepts cash and rehab loans
- HOA & community: Has HOA: Glenhaven Lakes Club; Annual association fee of $453 covering common area and road maintenance; Community features include CCRs, clubhouse, and park
Exterior
- Parking: Off-street parking and driveway with 3 uncovered spaces; Detached garage space approx. 154 square feet
- Security: Partially fenced
- Utilities: Electric energy source; Community water (Glenhaven); Sewer connected; Septic listed as sewer company; Power by PSE; Cable and internet connected (Astound)
- Home design: Single-family residence (split entry / multi-level); East-facing entry at main level; Has a view; Property listed as fixer
- Construction: Built on lot; Standard frame construction with wood materials; Composition roof; Concrete ribbon foundation; Style: Split entry
- Exterior features: Partial fencing; Wood exterior; Garden space; Paved lot; High-speed internet available; Community waterfront / private beach access; Sloped topography
Interior
- Kitchen: Dishwasher; Refrigerator; Stove/Range
- Bedrooms: 5 bedrooms total — 3 upstairs, 2 downstairs; Primary bedroom on second level
- Flooring: Laminate; Carpet
- Bathrooms: 1 full bath and 1 three-quarter bath (both on upper level); 1 bathtub and 2 showers
- Heating & cooling: Forced air heating; No cooling
- Interior features: Water heater; Daylight basement
- Laundry & utility: Utility room on lower level; Electric water heater located on lower level
Neighborhood map
What this means for you Summary
Snapshot
- This is a 9-bed/4.0-bath single-family listed at $392k.
Deal economics
- At list price, monthly cash flow is $-366 ($-4k/yr) — negative.
- To cash-flow at today's rent, offer at most $328k (16.5% below list).
- To meet the 1% rule (rent ≥ 1% of price), the offer needs to be $279k (29.0% below list).
- Recommended offer: $279k (29.0% below list) — sets the bar for 1% rule.
- Cap rate 5.2% vs local median 2.4% in Alger — top-decile yield for the area; either an underpriced asset or a hidden risk that comps aren't pricing in. Stress-test before assuming the spread holds.
Location & tenants
- Location reads 57/100 on livability (#527 in WA) — a working-class tenant base; expect higher turnover. Strengths: employment A; Watch: health & safety D, schools F, amenities F.
- Mount Baker School District (rural): math 40% / reading 53% proficiency, ranked #165 of 291 in WA (top 57%) — families likely to look elsewhere, expect single-tenant / working-renter base with shorter leases.
- Market conditions: 226 active listings in the ZIP; solid renter incomes; 1,190 units permitted in Whatcom County in 2024 (327 in 5+ unit buildings).
- This rent runs 36% of the median local income ($93k/yr) — at the standard rent-burdened threshold; future hikes will face affordability resistance.
Forward outlook
- In year one you build about $42k of equity ($3k loan paydown + $39k appreciation (10.0% local appreciation)).
- Whatcom County population projected at +28% by 2050 — long-run rental-demand tailwind backs the buy-and-hold thesis.
- By year 2, paydown + projected appreciation supports a ~$67k cash-out refi (75% LTV) — recoverable capital for the next deal without selling this one.
Negotiation context
- It's been on market 37 days — a 3% lower offer ($381k) is reasonable based on typical stale-listing flexibility.
- 3 sale attempts since 24y ago with the ask held roughly flat each time — persistent listings suggest the price (not the market) is what's stuck; bring a comps-based counter.
- Current owner paid $224k; list at $392k implies a 75% gain — meaningful room to come down on a strong offer.
Questions for the listing agent
- What do current leases actually rent for vs. the listed asking? Can we see a recent rent roll and the last 12 months of T-12 income?
- It's been on market 37 days. Have you received any prior offers? Is the seller open to a 29% concession, seller financing, or rate buy-down credit?
- Built in 1975 — when were the roof, HVAC, electrical panel, plumbing, and water heater last replaced?
- What does the HOA fee cover, when was the last increase, and are there any pending special assessments or reserve-fund shortfalls?
- Is there a deadline driving the sale (1031 exchange, divorce, estate, relocation)? That informs how much negotiation room exists.
- Schools are F-rated, which usually means shorter tenancies and higher turnover. Who's the typical renter profile here, and what's been the actual vacancy rate?
- The area grade is low — what's the realistic commute time and amenity access for the typical tenant pool here? Any planned neighborhood developments (good or bad) we should know about?
- What's the average days-on-market for RENTAL listings here right now (not sales)? A rising rental-DOM trend means longer vacancies and softer asking-rent achievability than the comps imply.
- What's the recent tenant-quality profile in this submarket — average credit score on applications, eviction rate, late-payment / NSF rate, and stable-employment percentage? A property-management company in the area should have these aggregated.
- How much new for-sale + rental construction is in the pipeline within 1–3 miles? Heavy new supply typically softens prices + rents 12–24 months out; constrained supply supports both.
Investment metrics
- 1% rule
- 0.71% ✗
- Cap rate
- 5.17%
- Cash-on-cash
- -4.00%
- DSCR
- 0.82
- GRM
- 11.7
CMA / ARV
- ARV (median comp)
- $630,170
- List price
- $392,500
- Delta
- -37.72%
- Verdict
- UNDERPRICED
- Comps
- 8 within 1.0 mi
Projected returns pro-forma
10.0% appreciation · 3.0% rent growth · sell at horizon
- IRR
- 21.4%
- Equity multiple
- 2.73×
- Total profit
- $190,406
- Equity at exit
- $353,595
- IRR
- 19.4%
- Equity multiple
- 6.27×
- Total profit
- $578,951
- Equity at exit
- $762,541
Cash invested: $109,900 (down + closing). Projections, not guarantees.
Landlord ↔ Tenant lean methodology
- Overall (STATE)
- 28 Tenant-Leaning
- State Washington
- 28 Tenant-Leaning · D+8
- County
- — inherits STATE
- City
- — inherits STATE
ZIP-level market 98284
- Home prices YoY
- 3.5%
- Active inventory
- 226
- Price-to-rent
- 11.7×
Monthly cashflow live
- Estimated rent
- $2,785 medium interval (Pro) →
- Mortgage (P&I)
- −$2,058
- Tax from tax record
- −$306 /mo · $3,676/yr
- Insurance
- −$164
- HOA
- −$38
- Vacancy / Maint / Mgmt
- −$585
- Net cashflow
- $-366
Break-even live
UW: 25.0% down · 7.5% · 30yr · 1.5% tax · 5.0% vac · 8.0% maint · 8.0% mgmt
Financing live
Cash to close
- Down payment
- $98,125
- Closing costs
- $11,775
- Reserves months
- —
- Total cash needed
- —
Loan-product check · same deal, 3 products live
Conventional
25% down · 7.5% · 30yr
- Down + closing
- —
- Monthly P&I
- —
- Monthly cashflow
- —
- DSCR
- —
- Eligible?
- —
Personal DTI + credit; lowest rate.
DSCR
20% down · 8.5% · 30yr
- Down + closing
- —
- Monthly P&I
- —
- Monthly cashflow
- —
- DSCR
- —
- Eligible?
- —
No personal income docs; deal must DSCR.
Hard money
10% down · 12.0% · 12mo
- Down + closing
- —
- Monthly P&I
- —
- Monthly cashflow
- —
- DSCR
- —
- Eligible?
- —
Short-term bridge; refi at stabilization.
HOA detail
- Monthly dues
- $38 · $456/yr
Listing history 24 events
-
2026-06-18days on market $392,500 Active 37 DOM
-
2026-06-17days on market $392,500 Active 36 DOM
-
2026-06-16days on market $392,500 Active 35 DOM
-
2026-06-15days on market $392,500 Active 34 DOM
-
2026-06-14days on market $392,500 Active 32 DOM
-
2026-06-13days on market $392,500 Active 31 DOM
-
2026-06-10days on market $392,500 Active 29 DOM
-
2026-06-09days on market $392,500 Active 28 DOM
-
2026-06-08days on market $392,500 Active 27 DOM
-
2026-06-07days on market $392,500 Active 26 DOM
-
2026-06-05days on market $392,500 Active 23 DOM
-
2026-06-02days on market $392,500 Active 21 DOM
-
2026-06-01days on market $392,500 Active 20 DOM
-
2026-05-31days on market $392,500 Active 19 DOM
-
2026-05-30days on market $392,500 Active 18 DOM
-
2026-05-12$392,500 Active
-
2006-08-21soldstatus $223,890
-
2006-08-21soldstatus $223,889
-
2006-06-21historical
-
2006-05-05$225,000
-
2002-04-24soldstatus $134,000
-
2002-04-01historical
-
2002-02-14$129,900
-
1992-09-18soldstatus $130,000
ⓘ Source: listings_history table (triggers on properties + properties_extension) + one-shot
backfill from property_details.listing_events for pre-trigger history.
Tax reassessment forecast WA · Resets to sale price
- Current annual tax
- $3,676 · $306/mo
- Projected year-2 tax
- $3,846 · $321/mo
- Expected delta
- +$170/yr (+$14/mo · 4.6%)
ⓘ Screening estimate from a state-policy table — verify with the county assessor before closing.
Climate risk First Street
- Flood 1/10 Low FEMA zone X (unshaded) · 0% chance over 30 yrs
- Wildfire 2/10 Low
- Heat 2/10 Low 8 d/yr ≥84°F today · 20 d/yr by 30 yrs out
- Wind 1/10 Low
- Air quality 7/10 Severe 11 unhealthy d/yr today · 11 by 30 yrs out
Nearby sold comps map
Loading sold comps map…
Walkable amenities ~0.75 mi
Loading nearby amenities…
Taxation est. · year 1
- Rental income
- $33,421
- − Mortgage interest
- −$21,986
- − Property taxes
- −$3,676
- − Insurance
- −$1,962
- − Repairs & maintenance
- −$2,674
- − Management
- −$2,674
- − HOA
- −$456
- − Depreciation
- −$11,418
- Taxable loss
- −$11,426
- Est. tax savings @ 24.0%
- +$2,742
- After-tax cash flow
- $-1,650/yr
For passive investors: Depreciation is non-cash, so a rental often shows a tax loss while cash-flowing — sheltering income. Rental losses are passive: they offset passive income freely, and up to $25,000/yr can offset ordinary (W-2) income if you actively participate and your MAGI is under $100k (phasing out to $0 by $150k); unused losses carry forward. On sale, claimed depreciation is recaptured at up to 25%, and gains may owe capital-gains tax (a 1031 exchange can defer both). Figures are a year-1 estimate at your 24.0% rate — not tax advice; consult a CPA.
Schools (NCES district)
- District
- Mount Baker School District
- NCES district ID
- 5305310
- Math proficiency
- 40% ▲ 3.00%
- Reading proficiency
- 53% ▼ -1.00%
- Median HH income
- $53,695
- Composite
- 42.37/100
- National rank
- #6931
- State rank
- #165 of 291 in WA
Livability — Alger
- Score
- 57/100
- State rank
- #527
- US rank
- #21801
Category grades
Schools grade is shown separately in the Schools card above.
Census & demographics
- County
- Skagit County · 118,108 people
- Metro
- Mount Vernon-Anacortes, WA
- Population (ZIP)
- 27,835
- Household income
- $93,006
- Rent vs Own
- Severe rent burden
- 502.0
Population outlook (Whatcom County) Hauer SSP2
- Today (2025)
- 240,408 people
- By 2030
- 254,667 · +5.9%
- By 2040
- 281,365 · +17.0%
- By 2050
- 307,592 · +27.9%
- By 2075
- 375,576 · +56.2%
- By 2100
- 421,637 · +75.4%
Race, ethnicity, and origin ACS 2023
- Neighborhood character
- Predominantly White (76%)
- Race & ethnicity
- White 76% Hispanic / Latino 14% Two or more races 8% Asian 2% Native American 1%
- Hispanic origin (detail)
- Mexican 12% Puerto Rican 1%
- Common ancestry
- Portuguese 6% Slovak 4% Italian 3%
- Foreign-born
- 5% · Canada, China
- Languages at home
- 88% English-only · Spanish 10% German/W. Germanic 1%
Political lean MEDSL · Whatcom
- 2024 margin
- Strong D (+24.9) · D 60.8% · R 35.9% · Other 3.3%
- 2008→2024 swing
- +6.9pp toward D · 2008: 18.0pp · 2024: 24.9pp
- All cycles
- 2024: D+24.9 2020: D+23.9 2016: D+17.7 2012: D+12.1 2008: D+18.0
Not yet ingested
- Civics
- —
Market trends
- HPI YoY
- ▲ 43.42%
- Current HPI
- 1280.83
- Rent YoY
- —
- Metro
- Mount Vernon-Anacortes, WA
- State GDP YoY
- ▲ 4.65%
- F500 in state
- 22
Industry mix (Fortune 500 HQ in WA)
| Industry | F500 HQs | Revenue |
|---|---|---|
| Retail | 2 | $269B |
|
||
| Technology / Retail | 1 | $638B |
|
||
| Technology | 1 | $245B |
|
||
| Telecommunications | 1 | $38B |
|
||
| Food / Beverage | 1 | $36B |
|
||
| Automotive / Trucks | 1 | $34B |
|
||
Price history
+201.9% since first listed9 events — show timeline
- 2026-05-12 Listed $392,500 NWMLS as Distributed by MLS Grid
- 2006-08-21 Sold (Public Records) $223,889 Public Records
- 2006-08-21 Sold (MLS) $223,890 NWMLS as Distributed by MLS Grid
- 2006-06-21 Delisted — NWMLS as Distributed by MLS Grid
- 2006-05-05 Listed $225,000 NWMLS as Distributed by MLS Grid
- 2002-04-24 Sold (MLS) $134,000 NWMLS as Distributed by MLS Grid
- 2002-04-01 Delisted — NWMLS as Distributed by MLS Grid
- 2002-02-14 Listed $129,900 NWMLS as Distributed by MLS Grid
- 1992-09-18 Sold (Public Records) $130,000 Public Records
Property tax history
+3.9%/yrLatest (2026): $3,676 · +24.1% YoY. Source: county tax records.
Cash-flow waterfall
monthlySold comps — $/sqft
last 12 mo · ≤1 miLoading sold comps…