2481 Kaanapali Pkwy Unit 919/F · Kaanapali, HI
Flood risk 6/10 · Moderate
- FEMA flood zone
- X (unshaded)
- Chance of flooding over 30 yrs
- 0.72%
- Est. flood insurance / yr
- $507 – $1,088
Fire risk No data
- Est. fire insurance / yr
- —
Heat risk No data
- Hot days now (above threshold)
- —
- Hot days in 30 yrs
- —
Wind risk No data
- Chance of severe wind over 30 yrs
- —
Air-quality risk 1/10 · Minimal
- Unhealthy air days now
- —
- Unhealthy air days in 30 yrs
- —
Risk factors via First Street. Map © Google.
Why this score? — see what drove the B grade
The composite is a weighted blend of 9 inputs, each scored 0–100. Each bar is that input's sub-score; the figure is the points it added to the 100-point composite (weight × sub-score).
- Cash flow +30.0/30.0
- 1% rule +10.0/10.0
- DSCR +10.0/10.0
- ARV discount +5.8/15.0
- Schools +3.7/10.0
- Livability +3.6/5.0
- Rent growth +3.5/5.0
- Condition / age +2.5/5.0
- Appreciation +1.2/10.0
$95,000
🖨 Deal sheet 📄 Offer letter ✓ Due diligence
Listing remarks MLS
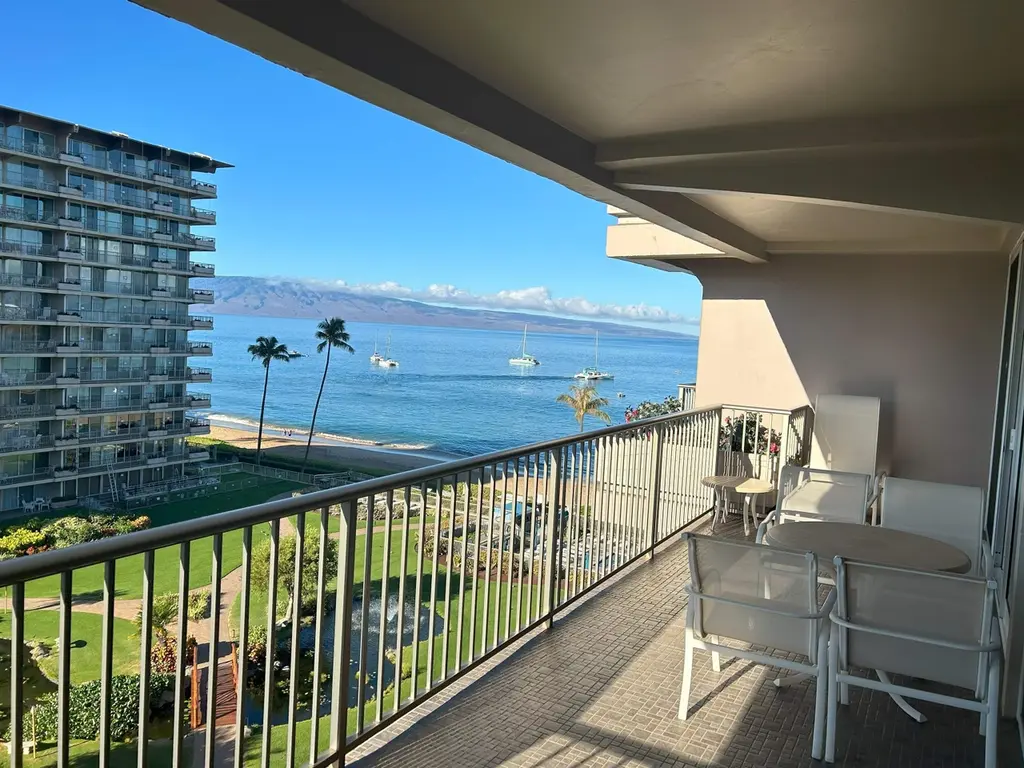
Perfect perch for the peak of whale season. Whaler 919 is the best seat in the house for the pinnacle weeks of the whale watching season. From its 9th-floor location on the courtyard side of Tower 1, enjoy expansive views from the West Maui Mountains, down to Kaanapali Beach, out to the island of Lanai. Purchase alongside other intervals currently on the market to own consecutive weeks and spend more time in paradise.
Key facts
- Expansive views
- West maui mountains
- 9th-floor location
Tags
Neighborhood map
What this means for you Summary
Snapshot
- This is a 1-bed/1.0-bath timeshare listed at $95k.
Deal economics
- At list price, monthly cash flow is $2k ($24k/yr) — positive.
- The deal already cash-flows at list — no discount required.
- Meets the 1% rule at list price ($3k rent vs $95k).
- Recommended offer: $89k (6.0% below list) — sets the bar for market timing.
Location & tenants
- Location reads 72/100 on livability (#19 in HI) — a middle-class / working-renter tenant base. Strengths: crime A+, employment A+, commute B+; Watch: health & safety C-, amenities F, cost of living F.
- Hawaii Department Of Education (suburban): math 32% / reading 50% proficiency, ranked #1 of 1 in HI (top 100%) — families likely to look elsewhere, expect single-tenant / working-renter base with shorter leases.
- Market conditions: Rents rising (+4.0%/yr); 637 active listings in the ZIP; solid renter incomes; 906 units permitted in Maui County in 2024 (289 in 5+ unit buildings).
- This rent runs 40% of the median local income ($101k/yr) — at the standard rent-burdened threshold; future hikes will face affordability resistance.
Forward outlook
- Local home prices are declining (-3.0%/yr); year-one equity from $657 of loan paydown is wiped out by about $3k of value loss. Plan a longer hold.
- Maui County population projected at +22% by 2050 — long-run rental-demand tailwind backs the buy-and-hold thesis.
- At projected returns (-3.0% appreciation + 4.0% rent growth), your $27k cash investment doubles in ~2 years — after that, you're playing with house money.
Negotiation context
- It's been on market 78 days — a 6% lower offer ($89k) is reasonable based on typical stale-listing flexibility.
- 2 sale attempts with the ask held roughly flat each time — persistent listings suggest the price (not the market) is what's stuck; bring a comps-based counter.
Risks & watch-outs
- Climate carrying-cost: major flood risk — expect insurance premiums to compound above CPI over the hold.
Questions for the listing agent
- It's been on market 78 days. Have you received any prior offers? Is the seller open to a 6% concession, seller financing, or rate buy-down credit?
- Built in 1976 — when were the roof, HVAC, electrical panel, plumbing, and water heater last replaced?
- Why hasn't it sold? Are there any deal-killer items the seller is aware of (foundation, flood, title, zoning, code violations)?
- Is there a deadline driving the sale (1031 exchange, divorce, estate, relocation)? That informs how much negotiation room exists.
- What's the average days-on-market for RENTAL listings here right now (not sales)? A rising rental-DOM trend means longer vacancies and softer asking-rent achievability than the comps imply.
- What's the recent tenant-quality profile in this submarket — average credit score on applications, eviction rate, late-payment / NSF rate, and stable-employment percentage? A property-management company in the area should have these aggregated.
- How much new for-sale + rental construction is in the pipeline within 1–3 miles? Heavy new supply typically softens prices + rents 12–24 months out; constrained supply supports both.
Investment metrics
- 1% rule
- 3.52% ✓
- Cap rate
- 31.37%
- Cash-on-cash
- 89.56%
- DSCR
- 4.99
- GRM
- 2.4
CMA / ARV
- ARV (median comp)
- $91,636
- List price
- $95,000
- Delta
- 3.67%
- Verdict
- FAIR
- Comps
- 20 within 1.0 mi
Show comp detail 6 sales within ~0.75 mi
| Address | Dist | Beds/Ba | Sqft | Sold | Price | $/sf | Match |
|---|---|---|---|---|---|---|---|
| 2481 Kaanapali Pkwy Unit 760 G | 0.00mi | 1/2.0 | 905 (+0%) | 5mo | $96,000 | $106 | 91 |
| 2481 Kaanapali Pkwy Unit 1259G | 0.04mi | 1/1.0 | 901 (0%) | 11mo | $79,000 | $88 | 89 |
| 2481 Kaanapali Pkwy Unit 719 D | 0.00mi | 1/1.0 | 901 (0%) | 15mo | $105,000 | $117 | 87 |
| 2481 Kaanapali Pkwy Unit 157 Z | 0.00mi | 1/2.0 | 905 (+0%) | 15mo | $25,000 | $28 | 83 |
| 2481 Kaanapali Pkwy Unit 610 Z | 0.00mi | 1/2.0 | 905 (+0%) | 16mo | $75,000 | $83 | 82 |
| 2481 Kaanapali Pkwy Unit 901/R | 0.04mi | 1/2.0 | 941 (+4%) | 11mo | $138,000 | $147 | 77 |
Match score weights: distance 35% · size 25% · config 20% · recency 20%. Top-matched comps best support the ARV.
Projected returns pro-forma
-3.0% appreciation · 3.97% rent growth · sell at horizon
- IRR
- 91.3%
- Equity multiple
- 5.30×
- Total profit
- $114,399
- Equity at exit
- $14,165
- IRR
- 94.4%
- Equity multiple
- 11.39×
- Total profit
- $276,435
- Equity at exit
- $8,214
Cash invested: $26,600 (down + closing). Projections, not guarantees.
Landlord ↔ Tenant lean methodology
- Overall (STATE)
- 37 Tenant-Leaning
- State Hawaii
- 37 Tenant-Leaning · D+13
- County
- — inherits STATE
- City
- — inherits STATE
ZIP-level market 96761
- Home prices YoY
- -1.9%
- Rents YoY
- 4.0%
- Active inventory
- 637
- Price-to-rent
- 2.4×
Monthly cashflow live
- Estimated rent
- $3,344 medium interval (Pro) →
- Mortgage (P&I)
- −$498
- Tax est. 1.5%
- −$119 /mo · $1,425/yr
- Insurance
- −$40
- HOA
- −$0
- Vacancy / Maint / Mgmt
- −$702
- Net cashflow
- $1,985
Break-even live
UW: 25.0% down · 7.5% · 30yr · 1.5% tax · 5.0% vac · 8.0% maint · 8.0% mgmt
Financing live
Cash to close
- Down payment
- $23,750
- Closing costs
- $2,850
- Reserves months
- —
- Total cash needed
- —
Loan-product check · same deal, 3 products live
Conventional
25% down · 7.5% · 30yr
- Down + closing
- —
- Monthly P&I
- —
- Monthly cashflow
- —
- DSCR
- —
- Eligible?
- —
Personal DTI + credit; lowest rate.
DSCR
20% down · 8.5% · 30yr
- Down + closing
- —
- Monthly P&I
- —
- Monthly cashflow
- —
- DSCR
- —
- Eligible?
- —
No personal income docs; deal must DSCR.
Hard money
10% down · 12.0% · 12mo
- Down + closing
- —
- Monthly P&I
- —
- Monthly cashflow
- —
- DSCR
- —
- Eligible?
- —
Short-term bridge; refi at stabilization.
Listing history 18 events
-
2026-06-18days on market $95,000 Active 78 DOM
-
2026-06-17days on market $95,000 Active 77 DOM
-
2026-06-16days on market $95,000 Active 76 DOM
-
2026-06-15days on market $95,000 Active 75 DOM
-
2026-06-13days on market $95,000 Active 73 DOM
-
2026-06-13days on market $95,000 Active 72 DOM
-
2026-06-10days on market $95,000 Active 70 DOM
-
2026-06-09days on market $95,000 Active 69 DOM
-
2026-06-08days on market $95,000 Active 68 DOM
-
2026-06-07days on market $95,000 Active 67 DOM
-
2026-06-05days on market $95,000 Active 64 DOM
-
2026-06-03days on market $95,000 Active 63 DOM
-
2026-06-02days on market $95,000 Active 62 DOM
-
2026-06-01days on market $95,000 Active 61 DOM
-
2026-05-31days on market $95,000 Active 60 DOM
-
2026-04-01$99,000 Active 423-char remark
Show marketing remark (423 chars)
Perfect perch for the peak of whale season. Whaler 919 is the best seat in the house for the pinnacle weeks of the whale watching season. From its 9th-floor location on the courtyard side of Tower 1, enjoy expansive views from the West Maui Mountains, down to Kaanapali Beach, out to the island of Lanai. Purchase alongside other intervals currently on the market to own consecutive weeks and spend more time in paradise.
-
2026-03-19historical
-
2025-11-26$99,000 Active
ⓘ Source: listings_history table (triggers on properties + properties_extension) + one-shot
backfill from property_details.listing_events for pre-trigger history.
Climate risk First Street
- Flood 6/10 Major FEMA zone X (unshaded) · 72% chance over 30 yrs
- Air quality 1/10 Low
Nearby sold comps map
Loading sold comps map…
Walkable amenities ~0.75 mi
Loading nearby amenities…
Taxation est. · year 1
- Rental income
- $40,130
- − Mortgage interest
- −$5,321
- − Property taxes
- −$1,425
- − Insurance
- −$475
- − Repairs & maintenance
- −$3,210
- − Management
- −$3,210
- − Depreciation
- −$2,764
- Taxable income
- $23,724
- Est. tax owed @ 24.0%
- −$5,694
- After-tax cash flow
- $18,130/yr
For passive investors: Depreciation is non-cash, so a rental often shows a tax loss while cash-flowing — sheltering income. Rental losses are passive: they offset passive income freely, and up to $25,000/yr can offset ordinary (W-2) income if you actively participate and your MAGI is under $100k (phasing out to $0 by $150k); unused losses carry forward. On sale, claimed depreciation is recaptured at up to 25%, and gains may owe capital-gains tax (a 1031 exchange can defer both). Figures are a year-1 estimate at your 24.0% rate — not tax advice; consult a CPA.
Schools (NCES district)
- District
- Hawaii Department Of Education
- NCES district ID
- 1500030
- Math proficiency
- 32% ▼ -10.00%
- Reading proficiency
- 50% ▼ -3.00%
- Median HH income
- $69,005
- Composite
- 37.07/100
- National rank
- #4504
- State rank
- #1 of 1 in HI
Livability — Kaanapali
- Score
- 72/100
- State rank
- #19
- US rank
- #6248
Category grades
Schools grade is shown separately in the Schools card above.
Census & demographics
- Census place
- Kaanapali, HI
- County
- Maui County · 114,195 people
- Metro
- Kahului-Wailuku-Lahaina, HI
- Population (ZIP)
- 20,952
- Household income
- $101,123
- Rent vs Own
- Severe rent burden
- 835.0
Population outlook (Maui County) Hauer SSP2
- Today (2025)
- 185,013 people
- By 2030
- 194,315 · +5.0%
- By 2040
- 210,917 · +14.0%
- By 2050
- 226,396 · +22.4%
- By 2075
- 270,475 · +46.2%
- By 2100
- 316,825 · +71.2%
Race, ethnicity, and origin ACS 2023
- Neighborhood character
- Highly diverse neighborhood (Simpson 0.78)
- Race & ethnicity
- White 35% Asian 29% Two or more races 25% Hispanic / Latino 13% Pacific Islander 6%
- Hispanic origin (detail)
- Mexican 7%
- Common ancestry
- Russian 3% Lithuanian 2% Iranian 1%
- Foreign-born
- 25% · Canada, Vietnam, China
- Languages at home
- 74% English-only · Other Asian/Pacific 12% Tagalog/Filipino 6% Spanish 5%
Political lean MEDSL · Maui
- 2024 margin
- Strong D (+25.9) · D 61.9% · R 36.0% · Other 2.2%
- 2008→2024 swing
- -29.3pp toward R · 2008: 55.2pp · 2024: 25.9pp
- All cycles
- 2024: D+25.9 2020: D+35.5 2016: D+38.6 2012: D+50.3 2008: D+55.2
Not yet ingested
- Civics
- —
Market trends
- HPI YoY
- ▼ -7.68%
- Current HPI
- 389.2894
- Rent YoY
- ▲ 3.97%
- Metro
- Kahului-Wailuku-Lahaina, HI
- State GDP YoY
- —
- F500 in state
- 0
Price history
+0.0% since first listed3 events — show timeline
- 2026-04-01 Listed $99,000 RAM MLS
- 2026-03-19 Listing Removed — RAM MLS
- 2025-11-26 Listed $99,000 RAM MLS
Cash-flow waterfall
monthlySold comps — $/sqft
last 12 mo · ≤1 miLoading sold comps…