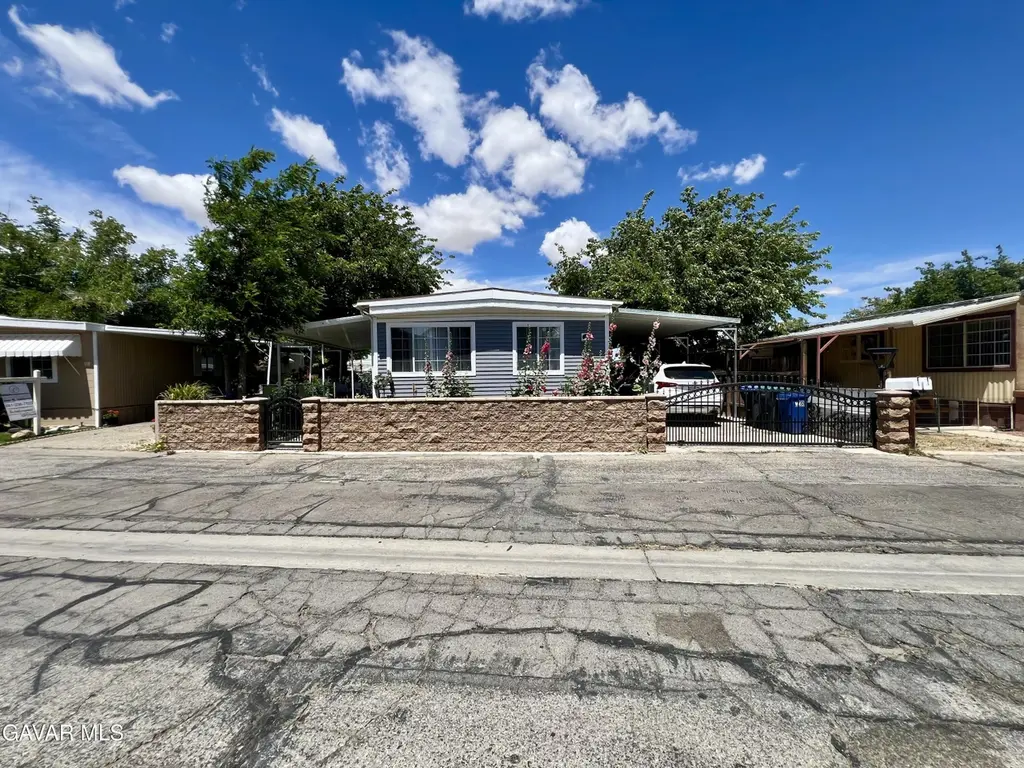
3255 E Avenue R Spc 97 · Palmdale, CA
Flood risk 1/10 · Minimal
- FEMA flood zone
- X (shaded)
- Chance of flooding over 30 yrs
- 0.0%
- Est. flood insurance / yr
- $507 – $1,088
Fire risk 7/10 · Major
- Est. fire insurance / yr
- $659 – $1,223
Heat risk 6/10 · Moderate
- Hot days now (above 100°F)
- 4 days/yr
- Hot days in 30 yrs
- 9 days/yr
Wind risk 1/10 · Minimal
- Chance of severe wind over 30 yrs
- —
Air-quality risk 10/10 · Severe
- Unhealthy air days now
- 25 days/yr
- Unhealthy air days in 30 yrs
- 29 days/yr
Risk factors via First Street. Map © Google.
Why this score? — see what drove the C grade
The composite is a weighted blend of 9 inputs, each scored 0–100. Each bar is that input's sub-score; the figure is the points it added to the 100-point composite (weight × sub-score).
- Cash flow +30.0/30.0
- DSCR +10.0/10.0
- 1% rule +8.7/10.0
- Rent growth +2.9/5.0
- Livability +2.8/5.0
- Schools +2.5/10.0
- Condition / age +2.5/5.0
- ARV discount +0.0/15.0
- Appreciation +0.0/10.0
$198,000
🖨 Deal sheet 📄 Offer letter ✓ Due diligence
Listing remarks
3 Bedrooms | 2 Bathrooms - Fully Rehabbed & Move-In Ready Mobile Home!! Fully rehabbed and move-in ready mobile home offering modern upgrades throughout! Originally built in 1969, this home has been thoughtfully renovated from top to bottom, featuring fresh interior paint, stylish laminate flooring, and drywall installed throughout all interior walls for a clean, modern finish. The upgraded kitchen showcases beautiful quartz countertops, stainless steel fixtures, and a built-in Sub-Zero refrigerator, combining both luxury and functionality. The home features 3 bedrooms and 2 bathrooms, with a flexible layout where the owner has partitioned one room to create a third bedroom, ideal for
Key facts
- Fully rehabbed
- Quartz countertops
- Modern upgrades
Tags
Property features AI
Finance
- Other: Park ID / labeling: LAJ2692; Label/Insignia A306202, A306201; Serial numbers: S2215X, S2215U; Model name: (X); APN: 8950-100-097
- HOA & community: Park amenities include RV parking, clubhouse/rec room, pool, recreation area, and basketball court; New space rent listed at $705 (may depend on application); Park manager: Jonnine Soto, (661) 947-4700
Exterior
- Utilities: Individual utility meter; Cable TV available; Natural gas available
- Home design: Mobile/manufactured home (Space 97); Located in Mountain View Estate mobile home park; All ages community; Manufactured in 1969
- Construction: Composition shingle roof; Siding exterior; Golden West manufacturer; Length 51 ft, Width 10 ft; Skirting: Other
- Exterior features: Block and wood fencing; Awning; Shed; Awning (additional)
Interior
- Kitchen: Gas range; Refrigerator
- Bathrooms: 2 full bathrooms
- Heating & cooling: Mini split heating and cooling
- Interior features: Built-in refrigerator
- Laundry & utility: Washer; Dryer
Neighborhood map
What this means for you Summary
Snapshot
- This is a 3-bed/2.0-bath manufactured listed at $198k.
Deal economics
- At list price, monthly cash flow is $774 ($9k/yr) — positive.
- The deal already cash-flows at list — no discount required.
- Meets the 1% rule at list price ($3k rent vs $198k).
- Recommended offer: $192k (3.0% below list) — sets the bar for market timing.
- Cap rate 11.0% vs local median 4.5% in Palmdale — top-decile yield for the area; either an underpriced asset or a hidden risk that comps aren't pricing in. Stress-test before assuming the spread holds.
Location & tenants
- Location reads 55/100 on livability (#861 in CA) — a working-class tenant base; expect higher turnover. Strengths: housing A+; Watch: schools F, crime F, amenities F.
- Palmdale Elementary (suburban): math 20% / reading 31% proficiency, ranked #1,147 of 1,400 in CA (top 82%) — low school quality limits family demand, transient renter base, plan for 1-2y turnover; 69% free/reduced lunch — lower-income household profile, screen leases tightly.
- Market conditions: Rents rising (+1.8%/yr); 410 active listings in the ZIP; 14 comparable units currently listed for rent nearby; rentals leasing fast (median 1d on market — plan ~1-2 weeks tenant-placement turnaround); 19,697 units permitted in Los Angeles County in 2024 (9,426 in 5+ unit buildings).
- At $2,712/mo this rent would consume 52% of the median local household income ($62k/yr) (locally 4384% of renters already pay >50% of income on rent) — very limited rent-growth headroom before tenants either downsize or default.
Forward outlook
- Local home prices are declining (-3.0%/yr); year-one equity from $1k of loan paydown is wiped out by about $6k of value loss. Plan a longer hold.
- Los Angeles County population projected at +9% by 2050 — modest demand growth; plan on rents tracking national, not racing it.
- At projected returns (-3.0% appreciation + 1.8% rent growth), your $55k cash investment doubles in ~8 years — after that, you're playing with house money.
Negotiation context
- It's been on market 44 days — a 3% lower offer ($192k) is reasonable based on typical stale-listing flexibility.
Risks & watch-outs
- Climate carrying-cost: major wildfire risk; extreme-heat days projected 4→9/yr by 2055 (HVAC capex compounding) — expect insurance premiums to compound above CPI over the hold.
Questions for the listing agent
- It's been on market 44 days. Have you received any prior offers? Is the seller open to a 3% concession, seller financing, or rate buy-down credit?
- Built in 1969 — when were the roof, HVAC, electrical panel, plumbing, and water heater last replaced?
- Is there a deadline driving the sale (1031 exchange, divorce, estate, relocation)? That informs how much negotiation room exists.
- Schools are F-rated, which usually means shorter tenancies and higher turnover. Who's the typical renter profile here, and what's been the actual vacancy rate?
- Crime grade is F in this area — have there been break-ins, vandalism, or insurance claims at this property in the last 3 years? What carrier currently insures it and at what premium?
- What's the average days-on-market for RENTAL listings here right now (not sales)? A rising rental-DOM trend means longer vacancies and softer asking-rent achievability than the comps imply.
- What's the recent tenant-quality profile in this submarket — average credit score on applications, eviction rate, late-payment / NSF rate, and stable-employment percentage? A property-management company in the area should have these aggregated.
- How much new for-sale + rental construction is in the pipeline within 1–3 miles? Heavy new supply typically softens prices + rents 12–24 months out; constrained supply supports both.
Investment metrics
- 1% rule
- 1.37% ✓
- Cap rate
- 10.99%
- Cash-on-cash
- 16.76%
- DSCR
- 1.75
- GRM
- 6.1
CMA / ARV
- ARV (on-the-fly)
- $152,880
- Comps found
- 12
Show comp detail 12 sales within ~0.75 mi
| Address | Dist | Beds/Ba | Sqft | Sold | Price | $/sf | Match |
|---|---|---|---|---|---|---|---|
| 3255 E Ave R #177 | 0.07mi | 3/2.0 | 1,020 (-2%) | 8mo | $159,900 | $157 | 87 |
| 3255 E Avenue R #27 | 0.00mi | 2/2.0 (-1) | 1,020 (-2%) | 12mo | $125,000 | $123 | 82 |
| 3255 E Ave R #168 | 0.00mi | 3/2.0 | 960 (-8%) | 10mo | $145,000 | $151 | 79 |
| 3524 E Avenue R Spc 312 | 0.33mi | 3/2.0 | 1,104 (+6%) | 1mo | $173,000 | $157 | 74 |
| 3524 E Avenue R #246 | 0.33mi | 3/2.0 | 1,008 (-3%) | 13mo | $155,000 | $154 | 69 |
| 3524 E Avenue R #121 | 0.33mi | 3/2.0 | 1,152 (+11%) | 2mo | $169,000 | $147 | 66 |
| 3524 E Avenue R #100 | 0.33mi | 3/2.0 | 1,108 (+6%) | 10mo | $140,000 | $126 | 65 |
| 3524 E Avenue R Spc 114 Unit . | 0.33mi | 3/2.0 | 1,152 (+11%) | 9mo | $115,000 | $100 | 60 |
| 3524 E Avenue R #156 | 0.33mi | 3/2.0 | 1,152 (+11%) | 14mo | $180,000 | $156 | 55 |
| 38015 E 30th St #27 | 0.48mi | 2/2.0 (-1) | 1,152 (+11%) | 5mo | $80,000 | $69 | 50 |
| 3524 E R Ave #298 | 0.33mi | 3/2.0 | 1,188 (+14%) | 13mo | $120,000 | $101 | 50 |
| 3524 East Avenue R, #157 | 0.44mi | 3/1.0 | 1,152 (+11%) | 12mo | $97,000 | $84 | 48 |
Match score weights: distance 35% · size 25% · config 20% · recency 20%. Top-matched comps best support the ARV.
Projected returns pro-forma
-3.0% appreciation · 1.76% rent growth · sell at horizon
- IRR
- 6.5%
- Equity multiple
- 1.25×
- Total profit
- $13,924
- Equity at exit
- $29,522
- IRR
- 14.8%
- Equity multiple
- 2.13×
- Total profit
- $62,407
- Equity at exit
- $17,119
Cash invested: $55,440 (down + closing). Projections, not guarantees.
Landlord ↔ Tenant lean methodology
- Overall (STATE)
- 18 Strongly Tenant-Friendly
- State California
- 18 Strongly Tenant-Friendly · D+13
- County
- — inherits STATE
- City
- — inherits STATE
ZIP-level market 93550
- Home prices YoY
- -29.4%
- Rents YoY
- 1.8%
- Active inventory
- 410
- Price-to-rent
- 6.1×
Monthly cashflow live
- Estimated rent
- $2,712 high interval (Pro) →
- Mortgage (P&I)
- −$1,038
- Tax est. 1.5%
- −$248 /mo · $2,970/yr
- Insurance
- −$82
- HOA
- −$0
- Vacancy / Maint / Mgmt
- −$570
- Net cashflow
- $774
Break-even live
UW: 25.0% down · 7.5% · 30yr · 1.5% tax · 5.0% vac · 8.0% maint · 8.0% mgmt
Financing live
Cash to close
- Down payment
- $49,500
- Closing costs
- $5,940
- Reserves months
- —
- Total cash needed
- —
Loan-product check · same deal, 3 products live
Conventional
25% down · 7.5% · 30yr
- Down + closing
- —
- Monthly P&I
- —
- Monthly cashflow
- —
- DSCR
- —
- Eligible?
- —
Personal DTI + credit; lowest rate.
DSCR
20% down · 8.5% · 30yr
- Down + closing
- —
- Monthly P&I
- —
- Monthly cashflow
- —
- DSCR
- —
- Eligible?
- —
No personal income docs; deal must DSCR.
Hard money
10% down · 12.0% · 12mo
- Down + closing
- —
- Monthly P&I
- —
- Monthly cashflow
- —
- DSCR
- —
- Eligible?
- —
Short-term bridge; refi at stabilization.
Rent comps 14 comps
| Address | Beds | Baths | Sqft | Rent | $/sqft | DOM | Units | Dist |
|---|---|---|---|---|---|---|---|---|
| 38300 30th St E Palmdale, CA | 1.0–2.0 | 1.0–2.0 | 796 | $2,100 | $2.64 | 1d | 7 | 0.23mi |
| 38532 33rd St E Palmdale, CA | 4.0 | 2.0 | 1157 | $2,646 | $2.29 | 1d | 1 | 0.54mi |
| 38527 Pond Ave Palmdale, CA | 4.0 | 2.0 | 1300 | $3,200 | $2.46 | 1d | 1 | 0.55mi |
| 3138 E Avenue Q4 Palmdale, CA | 4.0 | 2.0 | 1318 | $2,646 | $2.01 | 1d | 1 | 0.62mi |
| 38638 31st St E Palmdale, CA | 4.0 | 2.0 | 1186 | $2,700 | $2.28 | 10d | 1 | 0.73mi |
| 38659 Angele Trumpet Ct Palmdale, CA | 3.0 | 2.0 | 1453 | $2,950 | $2.03 | 1d | 1 | 0.92mi |
| 38121 25th St E Palmdale, CA | 1.0–2.0 | 1.0–2.0 | 840 | $2,100 | $2.50 | 1d | 7 | 0.93mi |
| 4206 East Avenue Q-14 Unit Q14 Palmdale, CA | 3.0 | 2.0 | 1150 | $2,850 | $2.48 | 1d | 1 | 0.93mi |
| 37347 Waterman Ave Palmdale, CA | 3.0 | 2.0 | 1383 | $3,350 | $2.42 | 1d | 1 | 0.95mi |
| 3559 E Avenue R14 Palmdale, CA | 4.0 | 2.5 | 1483 | $2,895 | $1.95 | 1d | 1 | 1.06mi |
| 2260 E Avenue Q4 #70 Palmdale, CA | 4.0 | 2.0 | 1443 | $2,999 | $2.08 | 1d | 1 | 1.17mi |
| 38657 Ladelle Ave Palmdale, CA | 3.0 | 1.0 | 1014 | $2,600 | $2.56 | 1d | 1 | 1.44mi |
| 38657 Ladelle Ave Palmdale, CA | 3.0 | 1.0 | 1014 | $2,800 | $2.76 | 16d | 1 | 1.44mi |
| 2554 Olive Dr Palmdale, CA | 2.0 | 2.0 | 831 | $1,775 | $2.13 | 6d | 2 | 1.50mi |
Listing history 15 events
-
2026-06-18days on market $198,000 Active 44 DOM
-
2026-06-17days on market $198,000 Active 43 DOM
-
2026-06-16days on market $198,000 Active 42 DOM
-
2026-06-15days on market $198,000 Active 41 DOM
-
2026-06-13days on market $198,000 Active 39 DOM
-
2026-06-13days on market $198,000 Active 38 DOM
-
2026-06-09days on market $198,000 Active 35 DOM
-
2026-06-08days on market $198,000 Active 34 DOM
-
2026-06-07days on market $198,000 Active 33 DOM
-
2026-06-04days on market $198,000 Active 30 DOM
-
2026-06-03days on market $198,000 Active 29 DOM
-
2026-06-02days on market $198,000 Active 28 DOM
-
2026-06-01days on market $198,000 Active 27 DOM
-
2026-05-31days on market $198,000 Active 26 DOM
-
2026-05-04$198,000 Active
ⓘ Source: listings_history table (triggers on properties + properties_extension) + one-shot
backfill from property_details.listing_events for pre-trigger history.
Climate risk First Street
- Flood 1/10 Low FEMA zone X (shaded) · 0% chance over 30 yrs
- Wildfire 7/10 Severe
- Heat 6/10 Major 4 d/yr ≥100°F today · 9 d/yr by 30 yrs out
- Wind 1/10 Low
- Air quality 10/10 Extreme 25 unhealthy d/yr today · 29 by 30 yrs out
Nearby sold comps map
Loading sold comps map…
Walkable amenities ~0.75 mi
Loading nearby amenities…
Taxation est. · year 1
- Rental income
- $32,545
- − Mortgage interest
- −$11,091
- − Property taxes
- −$2,970
- − Insurance
- −$990
- − Repairs & maintenance
- −$2,604
- − Management
- −$2,604
- − Depreciation
- −$5,760
- Taxable income
- $6,527
- Est. tax owed @ 24.0%
- −$1,566
- After-tax cash flow
- $7,724/yr
For passive investors: Depreciation is non-cash, so a rental often shows a tax loss while cash-flowing — sheltering income. Rental losses are passive: they offset passive income freely, and up to $25,000/yr can offset ordinary (W-2) income if you actively participate and your MAGI is under $100k (phasing out to $0 by $150k); unused losses carry forward. On sale, claimed depreciation is recaptured at up to 25%, and gains may owe capital-gains tax (a 1031 exchange can defer both). Figures are a year-1 estimate at your 24.0% rate — not tax advice; consult a CPA.
Schools (NCES district)
- District
- Palmdale Elementary
- NCES district ID
- 0629580
- Math proficiency
- 20% ▲ 1.00%
- Reading proficiency
- 31% ▲ 1.00%
- Median HH income
- $48,652
- Composite
- 25.34/100
- National rank
- #12888
- State rank
- #1147 of 1400 in CA
Livability — Palmdale
- Score
- 55/100
- State rank
- #861
- US rank
- #23501
Category grades
Schools grade is shown separately in the Schools card above.
Census & demographics
- Census place
- Palmdale, CA
- County
- Los Angeles County · 9,444,647 people
- City population
- 177,644
- Metro
- Los Angeles-Long Beach-Anaheim, CA
- Population (ZIP)
- 80,645
- Household income
- $62,078
- Rent vs Own
- Severe rent burden
- 4384.0
Population outlook (Los Angeles County) Hauer SSP2
- Today (2025)
- 10,940,515 people
- By 2030
- 11,256,481 · +2.9%
- By 2040
- 11,729,929 · +7.2%
- By 2050
- 11,948,407 · +9.2%
- By 2075
- 11,818,114 · +8.0%
- By 2100
- 10,842,928 · -0.9%
Race, ethnicity, and origin ACS 2023
- Neighborhood character
- Predominantly Hispanic (69%)
- Race & ethnicity
- Hispanic / Latino 69% Two or more races 15% Black 14% White 12% Asian 3% Native American 2%
- Hispanic origin (detail)
- Mexican 52%
- Foreign-born
- 26% · Canada
- Languages at home
- 42% English-only · Spanish 55% Tagalog/Filipino 1% Other Asian/Pacific 1%
Political lean MEDSL · Los Angeles
- 2024 margin
- Solid D (+32.9) · D 64.8% · R 31.9% · Other 3.3%
- 2008→2024 swing
- -7.4pp toward R · 2008: 40.4pp · 2024: 32.9pp
- All cycles
- 2024: D+32.9 2020: D+44.2 2016: D+48.0 2012: D+40.0 2008: D+40.4
Not yet ingested
- Civics
- —
Market trends
- HPI YoY
- ▼ -183.38%
- Current HPI
- 440.8844
- Rent YoY
- ▲ 1.76%
- Metro
- Los Angeles-Long Beach-Anaheim, CA
- State GDP YoY
- ▲ 3.21%
- F500 in state
- 116
Industry mix (Fortune 500 HQ in CA)
| Industry | F500 HQs | Revenue |
|---|---|---|
| Technology | 27 | $1,492B |
|
||
| Financial Services | 3 | $174B |
|
||
| Retail | 3 | $44B |
|
||
| Insurance | 3 | $26B |
|
||
| Media / Entertainment | 2 | $115B |
|
||
| Pharmaceuticals / Biotech | 2 | $62B |
|
||
Price history
1 event — show timeline
- 2026-05-04 Listed $198,000 AVMLS
Property tax history
+6.8%/yrLatest (2025): $297 · +6.8% YoY. Source: county tax records.
Cash-flow waterfall
monthlySold comps — $/sqft
last 12 mo · ≤1 miLoading sold comps…