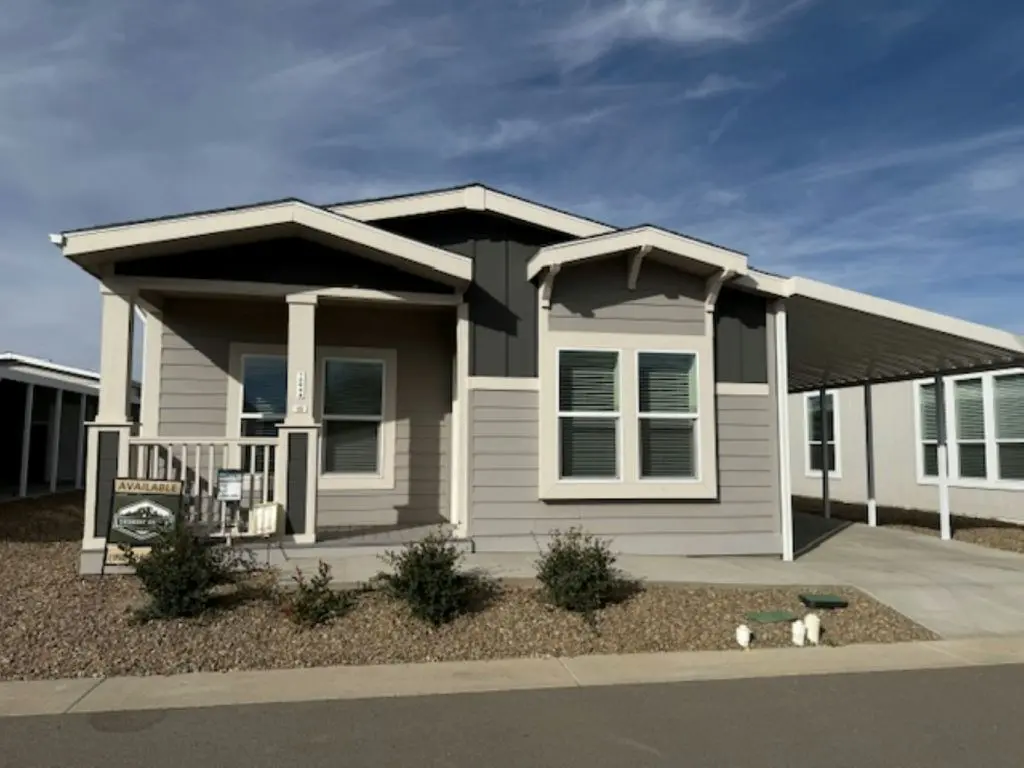
12048 E MCQUEEN DR Plan · Prescott Valley, AZ
Flood risk No data
- FEMA flood zone
- —
- Chance of flooding over 30 yrs
- —
- Est. flood insurance / yr
- —
Fire risk No data
- Est. fire insurance / yr
- —
Heat risk No data
- Hot days now (above threshold)
- —
- Hot days in 30 yrs
- —
Wind risk No data
- Chance of severe wind over 30 yrs
- —
Air-quality risk No data
- Unhealthy air days now
- —
- Unhealthy air days in 30 yrs
- —
Risk factors via First Street. Map © Google.
Why this score? — see what drove the D grade
The composite is a weighted blend of 9 inputs, each scored 0–100. Each bar is that input's sub-score; the figure is the points it added to the 100-point composite (weight × sub-score).
- Cash flow +15.0/30.0
- ARV discount +7.5/15.0
- DSCR +4.6/10.0
- 1% rule +4.1/10.0
- Condition / age +4.0/5.0
- Livability +3.1/5.0
- Schools +2.9/10.0
- Rent growth +2.5/5.0
- Appreciation +0.0/10.0
$220,000
🖨 Deal sheet 📄 Offer letter ✓ Due diligence
Listing remarks MLS
This Cypress model in site 22 is an experience unmatched. Step into a home that boasts 3 bedrooms, 2 bathrooms, and a spacious 1344 sq. ft. of open living. Designed with you in mind, it's a serene retreat in a vibrant community, conveniently close to shopping and dining. Ready for a new chapter? Let's introduce you to your new haven. Contact Eileen at 928-327-7100 or visit us in person to explore more!
Key facts
- Listed 213 days
Neighborhood map
What this means for you Summary
Snapshot
- This is a 3-bed/2.0-bath manufactured listed at $220k. Condition is rated good.
Deal economics
- At list price, monthly cash flow is $67 ($798/yr) — positive.
- The deal already cash-flows at list — no discount required.
- To meet the 1% rule (rent ≥ 1% of price), the offer needs to be $201k (8.7% below list).
- Recommended offer: $194k (12.0% below list) — sets the bar for market timing.
- Cap rate 6.7% vs local median 3.2% in Prescott Valley — top-decile yield for the area; either an underpriced asset or a hidden risk that comps aren't pricing in. Stress-test before assuming the spread holds.
Location & tenants
- Location reads 62/100 on livability (#126 in AZ) — a middle-class / working-renter tenant base. Strengths: housing A+, crime A-; Watch: schools C-, amenities F, commute F.
- Humboldt Unified District (4469) (suburban): math 31% / reading 37% proficiency, ranked #94 of 249 in AZ (top 38%) — families likely to look elsewhere, expect single-tenant / working-renter base with shorter leases.
- Market conditions: 266 active listings in the ZIP; 9 comparable units currently listed for rent nearby; rentals lingering (median 44d on market — plan ~5-8 weeks vacancy on turnover, expect pricing pressure); 56% of comp listings sitting > 30 days — soft ceiling on asking rent; 2,062 units permitted in Yavapai County in 2024 (98 in 5+ unit buildings).
- This rent runs 34% of the median local income ($72k/yr) — at the standard rent-burdened threshold; future hikes will face affordability resistance.
Forward outlook
- Local home prices are declining (-3.0%/yr); year-one equity from $2k of loan paydown is wiped out by about $7k of value loss. Plan a longer hold.
- Yavapai County population projected at +10% by 2050 — modest demand growth; plan on rents tracking national, not racing it.
Negotiation context
- It's been on market 213 days — a 12% lower offer ($194k) is reasonable based on typical stale-listing flexibility.
Questions for the listing agent
- It's been on market 213 days. Have you received any prior offers? Is the seller open to a 12% concession, seller financing, or rate buy-down credit?
- Why hasn't it sold? Are there any deal-killer items the seller is aware of (foundation, flood, title, zoning, code violations)?
- Is there a deadline driving the sale (1031 exchange, divorce, estate, relocation)? That informs how much negotiation room exists.
- The area grade is low — what's the realistic commute time and amenity access for the typical tenant pool here? Any planned neighborhood developments (good or bad) we should know about?
- What's the average days-on-market for RENTAL listings here right now (not sales)? A rising rental-DOM trend means longer vacancies and softer asking-rent achievability than the comps imply.
- What's the recent tenant-quality profile in this submarket — average credit score on applications, eviction rate, late-payment / NSF rate, and stable-employment percentage? A property-management company in the area should have these aggregated.
- How much new for-sale + rental construction is in the pipeline within 1–3 miles? Heavy new supply typically softens prices + rents 12–24 months out; constrained supply supports both.
Investment metrics
- 1% rule
- 0.91% ✗
- Cap rate
- 6.66%
- Cash-on-cash
- 1.30%
- DSCR
- 1.06
- GRM
- 9.1
CMA / ARV
- ARV (median comp)
- $146,500
- List price
- $220,000
- Delta
- 50.17%
- Verdict
- OVERPRICED
- Comps
- 3 within 1.0 mi
Show comp detail 7 sales within ~0.75 mi
| Address | Dist | Beds/Ba | Sqft | Sold | Price | $/sf | Match |
|---|---|---|---|---|---|---|---|
| 2142 Jackrabbit Dr #2142 | 0.49mi | 2/2.0 (-1) | 1,380 (+3%) | 0mo | $185,000 | $134 | 68 |
| 12002 E Mcqueen Dr | 0.03mi | 3/2.0 | 1,171 (-13%) | 22mo | $217,232 | $186 | 59 |
| 2211 Dove Dr | 0.72mi | 2/2.0 (-1) | 1,333 (-1%) | 10mo | $235,000 | $176 | 52 |
| 631 N Blue Spruce Dr | 0.69mi | 2/2.0 (-1) | 1,344 (0%) | 23mo | $349,000 | $260 | 44 |
| 617 N Blue Spruce Dr | 0.70mi | 2/2.0 (-1) | 1,324 (-2%) | 19mo | $353,700 | $267 | 44 |
| 11250 E State Route 69 #2229 | 0.66mi | 2/2.0 (-1) | 1,232 (-8%) | 22mo | $207,000 | $168 | 32 |
| 614 N Blue Spruce Lot #144 Dr | 0.70mi | 2/2.0 (-1) | 1,211 (-10%) | 20mo | $340,000 | $281 | 30 |
Match score weights: distance 35% · size 25% · config 20% · recency 20%. Top-matched comps best support the ARV.
Projected returns pro-forma
-3.0% appreciation · 3.0% rent growth · sell at horizon
- IRR
- -14.2%
- Equity multiple
- 0.49×
- Total profit
- $-31,382
- Equity at exit
- $32,803
- IRR
- -5.4%
- Equity multiple
- 0.65×
- Total profit
- $-21,748
- Equity at exit
- $19,022
Cash invested: $61,600 (down + closing). Projections, not guarantees.
Landlord ↔ Tenant lean methodology
- Overall (STATE)
- 87 Strongly Landlord-Friendly
- State Arizona
- 87 Strongly Landlord-Friendly · R+3
- County
- — inherits STATE
- City
- — inherits STATE
ZIP-level market 86327
- Home prices YoY
- -11.8%
- Active inventory
- 266
- Price-to-rent
- 9.1×
Monthly cashflow live
- Estimated rent
- $2,009 high interval (Pro) →
- Mortgage (P&I)
- −$1,154
- Tax est. 1.5%
- −$275 /mo · $3,300/yr
- Insurance
- −$92
- HOA
- −$0
- Vacancy / Maint / Mgmt
- −$422
- Net cashflow
- $67
Break-even live
UW: 25.0% down · 7.5% · 30yr · 1.5% tax · 5.0% vac · 8.0% maint · 8.0% mgmt
Financing live
Cash to close
- Down payment
- $55,000
- Closing costs
- $6,600
- Reserves months
- —
- Total cash needed
- —
Loan-product check · same deal, 3 products live
Conventional
25% down · 7.5% · 30yr
- Down + closing
- —
- Monthly P&I
- —
- Monthly cashflow
- —
- DSCR
- —
- Eligible?
- —
Personal DTI + credit; lowest rate.
DSCR
20% down · 8.5% · 30yr
- Down + closing
- —
- Monthly P&I
- —
- Monthly cashflow
- —
- DSCR
- —
- Eligible?
- —
No personal income docs; deal must DSCR.
Hard money
10% down · 12.0% · 12mo
- Down + closing
- —
- Monthly P&I
- —
- Monthly cashflow
- —
- DSCR
- —
- Eligible?
- —
Short-term bridge; refi at stabilization.
Rent comps 9 comps
| Address | Beds | Baths | Sqft | Rent | $/sqft | DOM | Units | Dist |
|---|---|---|---|---|---|---|---|---|
| 873 N Old Chisholm Trl Unit A Dewey, AZ | 2.0 | 2.0 | 1200 | $1,800 | $1.50 | 44d | 1 | 0.32mi |
| 1298 Tapadero Dr Unit A Dewey, AZ | 2.0 | 2.0 | 1134 | $1,750 | $1.54 | 21d | 1 | 0.41mi |
| 1131 Tapadero Dr Dewey, AZ | 3.0 | 2.0 | 1590 | $1,695 | $1.07 | 44d | 1 | 0.48mi |
| 11501 E Wingfoot Ct Dewey, AZ | 2.0 | 2.5 | 1467 | $2,200 | $1.50 | 44d | 1 | 0.50mi |
| 887 N Cochise Dr Dewey, AZ | 2.0 | 2.0 | 1544 | $1,625 | $1.05 | 21d | 1 | 0.96mi |
| 175 N Village Way Dewey, AZ | 2.0–3.0 | 2.0 | 1088 | $2,400 | $2.20 | 13d | 20 | 1.00mi |
| 556 N Robles St Dewey, AZ | 3.0 | 2.0 | 1484 | $2,200 | $1.48 | 21d | 1 | 1.01mi |
| 12933 E Santiago St Dewey, AZ | 3.0 | 2.0 | 1484 | $1,950 | $1.31 | 44d | 1 | 1.31mi |
| 1251 Barzona Ave #2 Dewey, AZ | 3.0 | 2.0 | 1254 | $1,745 | $1.39 | 44d | 1 | 1.45mi |
Listing history 16 events
-
2026-06-18days on market $220,000 Active 213 DOM
-
2026-06-17days on market $220,000 Active 212 DOM
-
2026-06-16days on market $220,000 Active 211 DOM
-
2026-06-15days on market $220,000 Active 210 DOM
-
2026-06-14days on market $220,000 Active 208 DOM
-
2026-06-13days on market $220,000 Active 207 DOM
-
2026-06-10days on market $220,000 Active 205 DOM
-
2026-06-09days on market $220,000 Active 204 DOM
-
2026-06-08days on market $220,000 Active 203 DOM
-
2026-06-07days on market $220,000 Active 202 DOM
-
2026-06-02days on market $220,000 Active 197 DOM
-
2026-06-01days on market $220,000 Active 196 DOM
-
2026-05-31days on market $220,000 Active 195 DOM
-
2026-05-30days on market $220,000 Active 194 DOM
-
2025-12-01price $220,000 405-char remark
Show marketing remark (405 chars)
This Cypress model in site 22 is an experience unmatched. Step into a home that boasts 3 bedrooms, 2 bathrooms, and a spacious 1344 sq. ft. of open living. Designed with you in mind, it's a serene retreat in a vibrant community, conveniently close to shopping and dining. Ready for a new chapter? Let's introduce you to your new haven. Contact Eileen at 928-327-7100 or visit us in person to explore more!
-
2025-11-18$234,900 Active 405-char remark
Show marketing remark (405 chars)
This Cypress model in site 22 is an experience unmatched. Step into a home that boasts 3 bedrooms, 2 bathrooms, and a spacious 1344 sq. ft. of open living. Designed with you in mind, it's a serene retreat in a vibrant community, conveniently close to shopping and dining. Ready for a new chapter? Let's introduce you to your new haven. Contact Eileen at 928-327-7100 or visit us in person to explore more!
ⓘ Source: listings_history table (triggers on properties + properties_extension) + one-shot
backfill from property_details.listing_events for pre-trigger history.
Nearby sold comps map
Loading sold comps map…
Walkable amenities ~0.75 mi
Loading nearby amenities…
Taxation est. · year 1
- Rental income
- $24,105
- − Mortgage interest
- −$12,323
- − Property taxes
- −$3,300
- − Insurance
- −$1,100
- − Repairs & maintenance
- −$1,928
- − Management
- −$1,928
- − Depreciation
- −$6,400
- Taxable loss
- −$2,875
- Est. tax savings @ 24.0%
- +$690
- After-tax cash flow
- $1,488/yr
For passive investors: Depreciation is non-cash, so a rental often shows a tax loss while cash-flowing — sheltering income. Rental losses are passive: they offset passive income freely, and up to $25,000/yr can offset ordinary (W-2) income if you actively participate and your MAGI is under $100k (phasing out to $0 by $150k); unused losses carry forward. On sale, claimed depreciation is recaptured at up to 25%, and gains may owe capital-gains tax (a 1031 exchange can defer both). Figures are a year-1 estimate at your 24.0% rate — not tax advice; consult a CPA.
Condition & rehab AI · 12 photos
This well-maintained, move-in-ready manufactured home offers a serene retreat with modern amenities and a vibrant community setting.
Value-add opportunities
- Both Paint exterior siding — Enhances curb appeal and value
- Both Replace blinds with energy-efficient windows — Improves energy efficiency and aesthetics
- Both Install smart home devices — Enhances convenience and marketability
Renovation cost estimate screening
Value-add ROI direction
- Both Paint exterior siding — Enhances curb appeal and value ↑
- Both Replace blinds with energy-efficient windows — Improves energy efficiency and aesthetics ↑
- Both Install smart home devices — Enhances convenience and marketability ↑
ⓘ Cost ranges are severity-bucket heuristics (US national rule-of-thumb). Get contractor quotes + a written scope before underwriting a rehab budget.
Schools (NCES district)
- District
- Humboldt Unified District (4469)
- NCES district ID
- 0403870
- Math proficiency
- 31% ▼ -13.00%
- Reading proficiency
- 37% ▼ -14.00%
- Median HH income
- $45,326
- Composite
- 29.06/100
- National rank
- #6605
- State rank
- #94 of 249 in AZ
Livability — Prescott Valley
- Score
- 62/100
- State rank
- #126
- US rank
- #16160
Category grades
Schools grade is shown separately in the Schools card above.
Census & demographics
- Census place
- Prescott Valley, AZ
- County
- Yavapai County · 190,406 people
- City population
- 63,155
- Metro
- Prescott Valley-Prescott, AZ
- Population (ZIP)
- 12,154
- Household income
- $71,512
- Rent vs Own
- Severe rent burden
- 70.0
Population outlook (Yavapai County) Hauer SSP2
- Today (2025)
- 241,389 people
- By 2030
- 249,523 · +3.4%
- By 2040
- 259,966 · +7.7%
- By 2050
- 264,736 · +9.7%
- By 2075
- 269,334 · +11.6%
- By 2100
- 256,505 · +6.3%
Race, ethnicity, and origin ACS 2023
- Neighborhood character
- Predominantly White (86%)
- Race & ethnicity
- White 86% Hispanic / Latino 9% Two or more races 6%
- Hispanic origin (detail)
- Mexican 8%
- Common ancestry
- Lithuanian 4% Romanian 3% Slovak 2%
- Foreign-born
- 3% · Canada
- Languages at home
- 95% English-only · Spanish 3% German/W. Germanic 1% French/Haitian/Cajun 1%
Political lean MEDSL · Yavapai
- 2024 margin
- Solid R (+33.9) · D 32.6% · R 66.5%
- 2008→2024 swing
- -9.5pp toward R · 2008: -24.4pp · 2024: -33.9pp
- All cycles
- 2024: R+33.9 2020: R+29.3 2016: R+31.4 2012: R+30.7 2008: R+24.4
Not yet ingested
- Civics
- —
Market trends
- HPI YoY
- ▼ -43.08%
- Current HPI
- 320.6301
- Rent YoY
- —
- Metro
- Prescott Valley-Prescott, AZ
- State GDP YoY
- ▲ 4.54%
- F500 in state
- 20
Industry mix (Fortune 500 HQ in AZ)
| Industry | F500 HQs | Revenue |
|---|---|---|
| Technology | 2 | $13B |
|
||
| Mining / Metals | 1 | $23B |
|
||
| Environmental Services | 1 | $16B |
|
||
| Metals / Steel | 1 | $14B |
|
||
| Technology Distribution | 1 | $9B |
|
||
| Homebuilding | 1 | $8B |
|
||
Price history
-6.3% since first listed2 events — show timeline
- 2025-12-01 Price Changed $220,000 Zillow
- 2025-11-18 Listed $234,900 Zillow
Cash-flow waterfall
monthlySold comps — $/sqft
last 12 mo · ≤1 miLoading sold comps…