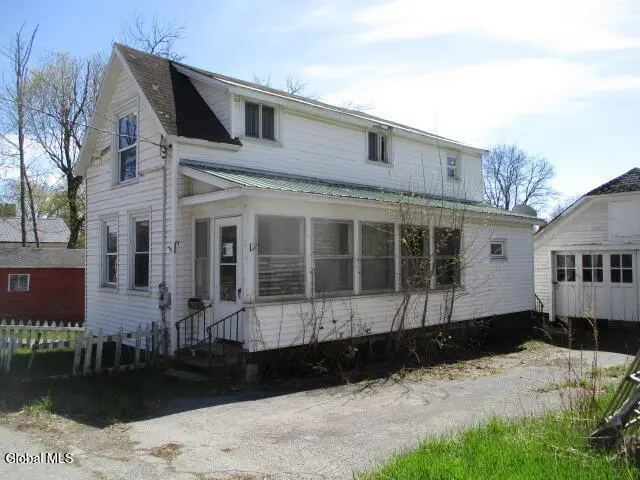
49 Skene St · Whitehall, NY
Flood risk 1/10 · Minimal
- FEMA flood zone
- X
- Chance of flooding over 30 yrs
- 0.0%
- Est. flood insurance / yr
- $473 – $860
Fire risk 3/10 · Minor
- Est. fire insurance / yr
- $691 – $1,283
Heat risk 3/10 · Minor
- Hot days now (above 99°F)
- 7 days/yr
- Hot days in 30 yrs
- 17 days/yr
Wind risk 2/10 · Minimal
- Chance of severe wind over 30 yrs
- 3.0%
Air-quality risk 1/10 · Minimal
- Unhealthy air days now
- 0 days/yr
- Unhealthy air days in 30 yrs
- 0 days/yr
Risk factors via First Street. Map © Google.
Why this score? — see what drove the A- grade
The composite is a weighted blend of 9 inputs, each scored 0–100. Each bar is that input's sub-score; the figure is the points it added to the 100-point composite (weight × sub-score).
- Cash flow +28.6/30.0
- ARV discount +15.0/15.0
- 1% rule +10.0/10.0
- DSCR +10.0/10.0
- Appreciation +10.0/10.0
- Schools +3.3/10.0
- Livability +2.8/5.0
- Rent growth +2.5/5.0
- Condition / age +2.5/5.0
$70,000
🖨 Deal sheet 📄 Offer letter ✓ Due diligence
Listing remarks
Nice two bedroom house with a large two car garage. Close to school and park.
Key facts
- 2,613 sq ft lot
- 2 garage spots
- Built 1918
Property features AI
Exterior
- Parking: Detached garage; Driveway; 2-car garage (2 garage spaces) — total parking for 4 vehicles
- Utilities: Public water; Public sewer
- Home design: Single family residence; Entry on the first floor
- Construction: Aluminum siding; Vinyl siding
- Exterior features: Exterior lighting
Interior
- Kitchen: Kitchen on the first floor; Appliances: Other
- Bedrooms: Two bedrooms on the second floor
- Bathrooms: One full bathroom (located on the second floor)
- Heating & cooling: Oil heating
- Interior features: Partial basement; 6 total rooms; Lighting (exterior lighting noted)
- Laundry & utility: Utilities: Public water and public sewer
Neighborhood map
What this means for you Summary
Snapshot
- This is a 2-bed/1.0-bath single-family listed at $70k.
Deal economics
- At list price, monthly cash flow is $230 ($3k/yr) — positive.
- The deal already cash-flows at list — no discount required.
- Meets the 1% rule at list price ($1k rent vs $70k).
- Recommended offer: $68k (3.0% below list) — sets the bar for market timing.
Location & tenants
- Location reads 56/100 on livability (#1,103 in NY) — a working-class tenant base; expect higher turnover. Strengths: cost of living A+, housing A+, crime B+; Watch: amenities F, commute F, employment F.
- Whitehall Central School District (rural): math 32% / reading 47% proficiency, ranked #530 of 590 in NY (top 90%) — families likely to look elsewhere, expect single-tenant / working-renter base with shorter leases.
- Zoned schools: Whitehall Elementary School (math 17% / reading 37%, grade F, #1,786 of 2,108 statewide, top 86%, 353 students, 63% FRL); Whitehall Junior-Senior High School (math 47% / reading 62%, grade C-, #912 of 1,100 statewide, top 85%, 320 students, 54% FRL) — zoned schools average 58% FRL vs 43% district-wide (16 pts higher); higher-poverty schools than district average — tighter screening recommended.
- Market conditions: 39 active listings in the ZIP; 106 units permitted in Washington County in 2024 (0 in 5+ unit buildings).
Forward outlook
- In year one you build about $7k of equity ($484 loan paydown + $7k appreciation (10.0% local appreciation)).
- Washington County population projected at -20% by 2050 — secular population decline; favor cash flow + early exit over multi-decade hold.
- At projected returns (10.0% appreciation + 3.0% rent growth), your $20k cash investment doubles in ~2 years — after that, you're playing with house money.
- By year 5, paydown + projected appreciation supports a ~$35k cash-out refi (75% LTV) — recoverable capital for the next deal without selling this one.
Negotiation context
- It's been on market 50 days — a 3% lower offer ($68k) is reasonable based on typical stale-listing flexibility.
- 7 sale attempts since 24y ago; this cycle's ask has dropped $5k (7%) from the opening price — seller is motivated, your offer sets the floor, not the list.
Risks & watch-outs
- Watch-outs: property tax is 3.9% of price; built in 1918 — expect roof / HVAC / electrical / plumbing capex.
Questions for the listing agent
- It's been on market 50 days. Have you received any prior offers? Is the seller open to a 3% concession, seller financing, or rate buy-down credit?
- Built in 1918 — when were the roof, HVAC, electrical panel, plumbing, and water heater last replaced?
- Property tax is high relative to price — has the assessment been appealed recently, and will the sale trigger a re-assessment?
- Is there a deadline driving the sale (1031 exchange, divorce, estate, relocation)? That informs how much negotiation room exists.
- Schools are F-rated, which usually means shorter tenancies and higher turnover. Who's the typical renter profile here, and what's been the actual vacancy rate?
- What's the average days-on-market for RENTAL listings here right now (not sales)? A rising rental-DOM trend means longer vacancies and softer asking-rent achievability than the comps imply.
- What's the recent tenant-quality profile in this submarket — average credit score on applications, eviction rate, late-payment / NSF rate, and stable-employment percentage? A property-management company in the area should have these aggregated.
- How much new for-sale + rental construction is in the pipeline within 1–3 miles? Heavy new supply typically softens prices + rents 12–24 months out; constrained supply supports both.
Investment metrics
- 1% rule
- 1.55% ✓
- Cap rate
- 10.24%
- Cash-on-cash
- 14.08%
- DSCR
- 1.63
- GRM
- 5.4
CMA / ARV
- ARV (median comp)
- $127,434
- List price
- $70,000
- Delta
- -45.07%
- Verdict
- UNDERPRICED
- Comps
- 20 within 1.0 mi
Show comp detail 8 sales within ~0.75 mi
| Address | Dist | Beds/Ba | Sqft | Sold | Price | $/sf | Match |
|---|---|---|---|---|---|---|---|
| 61 Poultney St | 0.08mi | 2/1.0 | 956 (-5%) | 22mo | $149,000 | $156 | 70 |
| 10 Pauline St | 0.27mi | 3/1.0 (+1) | 1,001 (-0%) | 19mo | $124,000 | $124 | 66 |
| 57 & 62 West St St | 0.42mi | 3/1.5 (+1) | 960 (-5%) | 16mo | $77,000 | $80 | 52 |
| 5 Lamb St | 0.54mi | 3/1.0 (+1) | 1,020 (+1%) | 24mo | $17,500 | $17 | 48 |
| 50 Champlain Ave | 0.47mi | 2/1.0 | 864 (-14%) | 18mo | $110,000 | $127 | 40 |
| 7 Lamb St | 0.54mi | 3/1.5 (+1) | 1,065 (+6%) | 22mo | $139,000 | $131 | 40 |
| 62 Saunders St | 0.65mi | 3/1.0 (+1) | 1,064 (+6%) | 19mo | $150,000 | $141 | 39 |
| 145 N Williams St | 0.73mi | 2/1.0 | 1,080 (+7%) | 24mo | $38,000 | $35 | 34 |
Match score weights: distance 35% · size 25% · config 20% · recency 20%. Top-matched comps best support the ARV.
Projected returns pro-forma
10.0% appreciation · 3.0% rent growth · sell at horizon
- IRR
- 34.7%
- Equity multiple
- 3.70×
- Total profit
- $52,876
- Equity at exit
- $63,062
- IRR
- 29.9%
- Equity multiple
- 8.37×
- Total profit
- $144,397
- Equity at exit
- $135,995
Cash invested: $19,600 (down + closing). Projections, not guarantees.
Landlord ↔ Tenant lean methodology
- Overall (STATE)
- 15 Strongly Tenant-Friendly
- State New York
- 15 Strongly Tenant-Friendly · D+10
- County
- — inherits STATE
- City
- — inherits STATE
ZIP-level market 12887
- Active inventory
- 39
- Price-to-rent
- 5.4×
Monthly cashflow live
- Estimated rent
- $1,082 medium interval (Pro) →
- Mortgage (P&I)
- −$367
- Tax from tax record
- −$228 /mo · $2,740/yr
- Insurance
- −$29
- HOA
- −$0
- Vacancy / Maint / Mgmt
- −$227
- Net cashflow
- $230
Break-even live
UW: 25.0% down · 7.5% · 30yr · 1.5% tax · 5.0% vac · 8.0% maint · 8.0% mgmt
Financing live
Cash to close
- Down payment
- $17,500
- Closing costs
- $2,100
- Reserves months
- —
- Total cash needed
- —
Loan-product check · same deal, 3 products live
Conventional
25% down · 7.5% · 30yr
- Down + closing
- —
- Monthly P&I
- —
- Monthly cashflow
- —
- DSCR
- —
- Eligible?
- —
Personal DTI + credit; lowest rate.
DSCR
20% down · 8.5% · 30yr
- Down + closing
- —
- Monthly P&I
- —
- Monthly cashflow
- —
- DSCR
- —
- Eligible?
- —
No personal income docs; deal must DSCR.
Hard money
10% down · 12.0% · 12mo
- Down + closing
- —
- Monthly P&I
- —
- Monthly cashflow
- —
- DSCR
- —
- Eligible?
- —
Short-term bridge; refi at stabilization.
Listing history 32 events
-
2026-06-18days on market $70,000 Active 50 DOM
-
2026-06-17days on market $70,000 Active 49 DOM
-
2026-06-16days on market $70,000 Active 48 DOM
-
2026-06-15days on market $70,000 Active 47 DOM
-
2026-06-13days on market $70,000 Active 45 DOM
-
2026-06-12days on market $70,000 Active 44 DOM
-
2026-06-09days on market $70,000 Active 41 DOM
-
2026-06-08days on market $70,000 Active 40 DOM
-
2026-06-07days on market $70,000 Active 39 DOM
-
2026-06-07days on market $70,000 Active 38 DOM
-
2026-06-04days on market $70,000 Active 35 DOM
-
2026-06-02days on market $70,000 Active 34 DOM
-
2026-06-01days on market $70,000 Active 33 DOM
-
2026-05-31days on market $70,000 Active 32 DOM
-
2026-05-31price $70,000 Active 31 DOM
-
2026-04-27$75,000 Active 77-char remark
-
2023-06-23historical
-
2022-12-27$71,000 Active
-
2022-12-04historical
-
2022-11-14price $71,000
-
2022-06-03$74,900 Active
-
2019-03-01historical
-
2019-03-01historical
-
2015-01-29$80,000
-
2012-01-09$79,900
-
2005-11-15soldstatus $66,250
-
2005-10-24soldstatus $66,250
-
2004-11-05$69,000
-
2003-01-14soldstatus $60,000
-
2002-09-04soldstatus $31,000
-
2002-08-22soldstatus $31,000
-
2002-06-06$42,900
ⓘ Source: listings_history table (triggers on properties + properties_extension) + one-shot
backfill from property_details.listing_events for pre-trigger history.
Tax reassessment forecast NY · Partial reset (capped growth)
- Current annual tax
- $2,740 · $228/mo
- Projected year-2 tax
- $2,740 · $228/mo
- Expected delta
- $0/yr ($0/mo · 0.0%)
ⓘ Screening estimate from a state-policy table — verify with the county assessor before closing.
Climate risk First Street
- Flood 1/10 Low FEMA zone X · 0% chance over 30 yrs
- Wildfire 3/10 Moderate
- Heat 3/10 Moderate 7 d/yr ≥99°F today · 17 d/yr by 30 yrs out
- Wind 2/10 Low 3% chance of damaging wind over 30 yrs
- Air quality 1/10 Low 0 unhealthy d/yr today · 0 by 30 yrs out
Nearby sold comps map
Loading sold comps map…
Walkable amenities ~0.75 mi
Loading nearby amenities…
Taxation est. · year 1
- Rental income
- $12,981
- − Mortgage interest
- −$3,921
- − Property taxes
- −$2,740
- − Insurance
- −$350
- − Repairs & maintenance
- −$1,039
- − Management
- −$1,039
- − Depreciation
- −$2,036
- Taxable income
- $1,857
- Est. tax owed @ 24.0%
- −$446
- After-tax cash flow
- $2,315/yr
For passive investors: Depreciation is non-cash, so a rental often shows a tax loss while cash-flowing — sheltering income. Rental losses are passive: they offset passive income freely, and up to $25,000/yr can offset ordinary (W-2) income if you actively participate and your MAGI is under $100k (phasing out to $0 by $150k); unused losses carry forward. On sale, claimed depreciation is recaptured at up to 25%, and gains may owe capital-gains tax (a 1031 exchange can defer both). Figures are a year-1 estimate at your 24.0% rate — not tax advice; consult a CPA.
Schools (NCES district)
- District
- Whitehall Central School District
- NCES district ID
- 3631290
- Math proficiency
- 32% ▼ -1.00%
- Reading proficiency
- 47% ▲ 5.00%
- Median HH income
- $43,563
- Composite
- 33.4/100
- National rank
- #5477
- State rank
- #530 of 590 in NY
Livability — Whitehall
- Score
- 56/100
- State rank
- #1103
- US rank
- #22538
Category grades
Schools grade is shown separately in the Schools card above.
Census & demographics
- Census place
- Whitehall, NY
- Population (ZIP)
- 4,629
Population outlook (Washington County) Hauer SSP2
- Today (2025)
- 59,576 people
- By 2030
- 57,618 · -3.3%
- By 2040
- 52,751 · -11.5%
- By 2050
- 47,514 · -20.2%
- By 2075
- 35,690 · -40.1%
- By 2100
- 24,807 · -58.4%
Race, ethnicity, and origin ACS 2023
- Neighborhood character
- Predominantly White (88%)
- Race & ethnicity
- White 88% Two or more races 9% Hispanic / Latino 3%
- Common ancestry
- Lithuanian 15% Polish 5% Romanian 3%
- Foreign-born
- 2% · Canada
- Languages at home
- 95% English-only · German/W. Germanic 3% Spanish 1%
Political lean MEDSL · Washington
- 2024 margin
- Strong R (+21.2) · D 39.4% · R 60.6%
- 2008→2024 swing
- -22.0pp toward R · 2008: 0.8pp · 2024: -21.2pp
- All cycles
- 2024: R+21.2 2020: R+15.6 2016: R+20.2 2012: D+1.6 2008: D+0.8
Not yet ingested
- Civics
- —
Market trends
- HPI YoY
- ▲ 122.64%
- Current HPI
- 354.5975
- Rent YoY
- —
- Metro
- —
- State GDP YoY
- ▲ 2.60%
- F500 in state
- 92
Industry mix (Fortune 500 HQ in NY)
| Industry | F500 HQs | Revenue |
|---|---|---|
| Financial Services | 10 | $950B |
|
||
| Consumer Goods | 9 | $162B |
|
||
| Insurance | 4 | $225B |
|
||
| Telecommunications | 2 | $144B |
|
||
| Pharmaceuticals | 2 | $112B |
|
||
| Media / Entertainment | 2 | $69B |
|
||
Price history
+63.2% since first listed18 events — show timeline
- 2026-05-30 Price Changed $70,000 Global MLS
- 2026-04-27 Listed $75,000 Global MLS
- 2023-06-23 Listing Removed — Global MLS
- 2022-12-27 Listed $71,000 Global MLS
- 2022-12-04 Listing Removed — Global MLS
- 2022-11-14 Price Changed $71,000 Global MLS
- 2022-06-03 Listed $74,900 Global MLS
- 2019-03-01 Listing Removed — Global MLS
- 2019-03-01 Listing Removed — Global MLS
- 2015-01-29 Listed $80,000 Global MLS
- 2012-01-09 Listed $79,900 Global MLS
- 2005-11-15 Sold (Public Records) $66,250 Public Records
- 2005-10-24 Sold (MLS) $66,250 Global MLS
- 2004-11-05 Listed $69,000 Global MLS
- 2003-01-14 Sold (Public Records) $60,000 Public Records
- 2002-09-04 Sold (Public Records) $31,000 Public Records
- 2002-08-22 Sold (MLS) $31,000 Global MLS
- 2002-06-06 Listed $42,900 Global MLS
Property tax history
+1.3%/yrLatest (2025): $2,740 · +10.6% YoY. Source: county tax records.
Cash-flow waterfall
monthlySold comps — $/sqft
last 12 mo · ≤1 miLoading sold comps…