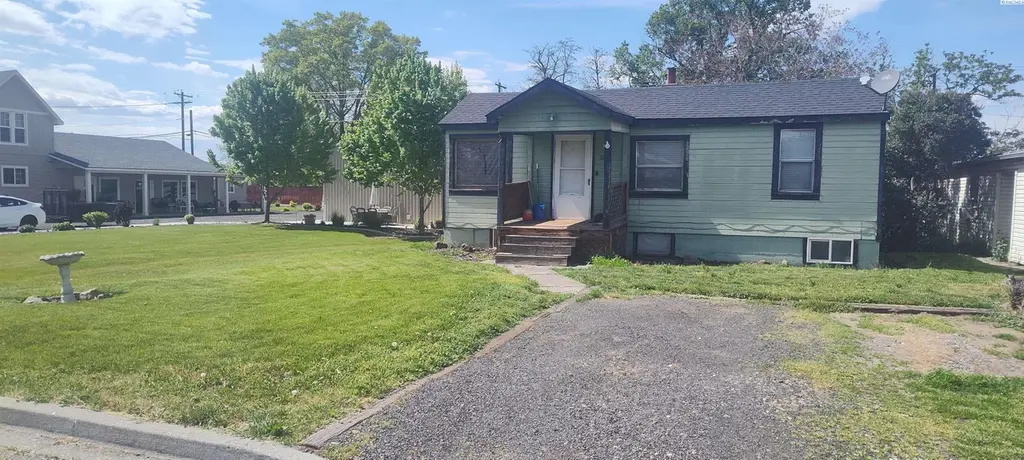
1116 Sherman Ave · Prosser, WA
Flood risk 1/10 · Minimal
- FEMA flood zone
- X
- Chance of flooding over 30 yrs
- 0.0%
- Est. flood insurance / yr
- $473 – $860
Fire risk 5/10 · Moderate
- Est. fire insurance / yr
- $604 – $1,122
Heat risk 5/10 · Moderate
- Hot days now (above 98°F)
- 7 days/yr
- Hot days in 30 yrs
- 15 days/yr
Wind risk 1/10 · Minimal
- Chance of severe wind over 30 yrs
- —
Air-quality risk 9/10 · Severe
- Unhealthy air days now
- 13 days/yr
- Unhealthy air days in 30 yrs
- 13 days/yr
Risk factors via First Street. Map © Google.
Why this score? — see what drove the B- grade
The composite is a weighted blend of 9 inputs, each scored 0–100. Each bar is that input's sub-score; the figure is the points it added to the 100-point composite (weight × sub-score).
- Cash flow +25.6/30.0
- ARV discount +15.0/15.0
- DSCR +8.5/10.0
- 1% rule +6.2/10.0
- Livability +4.0/5.0
- Schools +3.8/10.0
- Rent growth +2.5/5.0
- Condition / age +2.5/5.0
- Appreciation +0.0/10.0
$215,000
🖨 Deal sheet 📄 Offer letter ✓ Due diligence
Listing remarks
Opportunity awaits! If you've been looking for an investment opportunity or a house thats listed for an affordable price, this might be the house for you. If your not afraid to put in the work, this home offers 3 bedroom 2 baths and 1360 sq. ft of living space. Nestled in the heart of Prosser on a large city lot, zoned for down town commercial, the options on this property are endless for someone willing to do the work. Its adjacent to medium density residential zoning so you can keep it as residential use and add aditional units, use it as commercial use or even do a commercial/residential combination. Motivated sellers, looking for a quick sale!
Key facts
- Large city lot
- 6,969 sq ft lot
- Built 1940
Tags
Property features AI
Exterior
- Parking: No garage / no dedicated parking
- Utilities: Public water; Electricity on property; Electricity connected; Sewer connected
- Home design: Single-family residence; Site built on owned lot; One story
- Construction: Frame construction with wood siding; Concrete perimeter foundation; New construction
- Exterior features: Composition roof; Lot approximately 0.16 acres; Zoned Commercial General
Interior
- Flooring: Carpet
- Bathrooms: 1 full bathroom; 1 three-quarter bathroom
- Heating & cooling: Window unit(s) for cooling
- Interior features: Carpet flooring; Daylight basement
Neighborhood map
What this means for you Summary
Snapshot
- This is a 3-bed/2.0-bath single-family listed at $215k.
Deal economics
- At list price, monthly cash flow is $508 ($6k/yr) — positive.
- The deal already cash-flows at list — no discount required.
- Meets the 1% rule at list price ($2k rent vs $215k).
- Recommended offer: $212k (1.5% below list) — sets the bar for market timing.
- Cap rate 9.1% vs local median 2.8% in Prosser — top-decile yield for the area; either an underpriced asset or a hidden risk that comps aren't pricing in. Stress-test before assuming the spread holds.
Location & tenants
- Location reads 80/100 on livability (#91 in WA, #1,785 nationally) — a professional / high-income tenant draw. Strengths: commute A+, housing A+, health & safety A+; Watch: schools C-, amenities D+, employment D.
- Prosser School District (town): math 36% / reading 46% proficiency, ranked #208 of 291 in WA (top 72%) — families likely to look elsewhere, expect single-tenant / working-renter base with shorter leases.
- Market conditions: 231 active listings in the ZIP; 1 comparable units currently listed for rent nearby; 1,532 units permitted in Benton County in 2024 (389 in 5+ unit buildings).
Forward outlook
- Local home prices are declining (-3.0%/yr); year-one equity from $1k of loan paydown is wiped out by about $6k of value loss. Plan a longer hold.
- Benton County population projected at +32% by 2050 — long-run rental-demand tailwind backs the buy-and-hold thesis.
Negotiation context
- It's been on market 28 days — a 2% lower offer ($212k) is reasonable based on typical stale-listing flexibility.
- 4 sale attempts since 23y ago with the ask held roughly flat each time — persistent listings suggest the price (not the market) is what's stuck; bring a comps-based counter.
- Current owner paid $78k; list at $215k implies a 177% gain — meaningful room to come down on a strong offer.
Risks & watch-outs
- Watch-outs: built in 1940 — expect roof / HVAC / electrical / plumbing capex.
- Climate carrying-cost: moderate wildfire risk; extreme-heat days projected 7→15/yr by 2055 (HVAC capex compounding) — expect insurance premiums to compound above CPI over the hold.
Questions for the listing agent
- Built in 1940 — when were the roof, HVAC, electrical panel, plumbing, and water heater last replaced?
- Is there a deadline driving the sale (1031 exchange, divorce, estate, relocation)? That informs how much negotiation room exists.
- What's the average days-on-market for RENTAL listings here right now (not sales)? A rising rental-DOM trend means longer vacancies and softer asking-rent achievability than the comps imply.
- What's the recent tenant-quality profile in this submarket — average credit score on applications, eviction rate, late-payment / NSF rate, and stable-employment percentage? A property-management company in the area should have these aggregated.
- How much new for-sale + rental construction is in the pipeline within 1–3 miles? Heavy new supply typically softens prices + rents 12–24 months out; constrained supply supports both.
Investment metrics
- 1% rule
- 1.12% ✓
- Cap rate
- 9.13%
- Cash-on-cash
- 10.12%
- DSCR
- 1.45
- GRM
- 7.5
CMA / ARV
- ARV (on-the-fly)
- $331,840
- Comps found
- 12
Show comp detail 12 sales within ~0.75 mi
| Address | Dist | Beds/Ba | Sqft | Sold | Price | $/sf | Match |
|---|---|---|---|---|---|---|---|
| 1111 Sherman Ave | 0.03mi | 3/1.5 | 1,296 (-5%) | 9mo | $360,000 | $278 | 81 |
| 304 Basalt Lp Loop | 0.40mi | 4/2.0 (+1) | 1,423 (+5%) | 3mo | $325,000 | $228 | 66 |
| 366 Aeon Ave | 0.48mi | 3/2.5 | 1,268 (-7%) | 1mo | $331,914 | $262 | 64 |
| 935 Court St | 0.59mi | 3/2.0 | 1,288 (-5%) | 1mo | $171,000 | $133 | 63 |
| 912 Court St | 0.54mi | 3/2.0 | 1,400 (+3%) | 8mo | $341,900 | $244 | 63 |
| 326 Casi Ct | 0.51mi | 3/2.0 | 1,320 (-3%) | 13mo | $360,000 | $273 | 61 |
| 371 Aeon Ave | 0.73mi | 3/2.0 | 1,408 (+4%) | 2mo | $363,373 | $258 | 59 |
| 1511 Bennett Ave | 0.45mi | 4/1.0 (+1) | 1,481 (+9%) | 2mo | $359,000 | $242 | 53 |
| 919 Brown St | 0.54mi | 3/2.0 | 1,192 (-12%) | 4mo | $360,000 | $302 | 51 |
| 827 Court St | 0.46mi | 2/2.0 (-1) | 1,514 (+11%) | 5mo | $333,500 | $220 | 51 |
| 929 Parkside Dr | 0.59mi | 3/2.0 | 1,514 (+11%) | 9mo | $370,000 | $244 | 46 |
| 923 Brown St | 0.55mi | 3/2.0 | 1,550 (+14%) | 14mo | $345,000 | $223 | 40 |
Match score weights: distance 35% · size 25% · config 20% · recency 20%. Top-matched comps best support the ARV.
Projected returns pro-forma
-3.0% appreciation · 3.0% rent growth · sell at horizon
- IRR
- -1.1%
- Equity multiple
- 0.96×
- Total profit
- $-2,533
- Equity at exit
- $32,057
- IRR
- 8.6%
- Equity multiple
- 1.65×
- Total profit
- $39,329
- Equity at exit
- $18,589
Cash invested: $60,200 (down + closing). Projections, not guarantees.
Landlord ↔ Tenant lean methodology
- Overall (STATE)
- 28 Tenant-Leaning
- State Washington
- 28 Tenant-Leaning · D+8
- County
- — inherits STATE
- City
- — inherits STATE
ZIP-level market 99350
- Home prices YoY
- -31.6%
- Active inventory
- 231
- Price-to-rent
- 7.5×
Monthly cashflow live
- Estimated rent
- $2,400 medium interval (Pro) →
- Mortgage (P&I)
- −$1,127
- Tax from tax record
- −$171 /mo · $2,056/yr
- Insurance
- −$90
- HOA
- −$0
- Vacancy / Maint / Mgmt
- −$504
- Net cashflow
- $508
Break-even live
UW: 25.0% down · 7.5% · 30yr · 1.5% tax · 5.0% vac · 8.0% maint · 8.0% mgmt
Financing live
Cash to close
- Down payment
- $53,750
- Closing costs
- $6,450
- Reserves months
- —
- Total cash needed
- —
Loan-product check · same deal, 3 products live
Conventional
25% down · 7.5% · 30yr
- Down + closing
- —
- Monthly P&I
- —
- Monthly cashflow
- —
- DSCR
- —
- Eligible?
- —
Personal DTI + credit; lowest rate.
DSCR
20% down · 8.5% · 30yr
- Down + closing
- —
- Monthly P&I
- —
- Monthly cashflow
- —
- DSCR
- —
- Eligible?
- —
No personal income docs; deal must DSCR.
Hard money
10% down · 12.0% · 12mo
- Down + closing
- —
- Monthly P&I
- —
- Monthly cashflow
- —
- DSCR
- —
- Eligible?
- —
Short-term bridge; refi at stabilization.
Rent comps 1 comps
| Address | Beds | Baths | Sqft | Rent | $/sqft | DOM | Units | Dist |
|---|---|---|---|---|---|---|---|---|
| 50 Molly Rose Ct Prosser, WA | 3.0 | 2.0 | 1580 | $2,400 | $1.52 | 44d | 1 | 1.27mi |
Listing history 21 events
-
2026-06-18days on market $215,000 Active 28 DOM
-
2026-06-17days on market $215,000 Active 27 DOM
-
2026-06-16days on market $215,000 Active 26 DOM
-
2026-06-15days on market $215,000 Active 25 DOM
-
2026-06-15days on market $215,000 Active 24 DOM
-
2026-06-13days on market $215,000 Active 23 DOM
-
2026-06-12days on market $215,000 Active 22 DOM
-
2026-06-09days on market $215,000 Active 19 DOM
-
2026-06-08days on market $215,000 Active 18 DOM
-
2026-06-08days on market $215,000 Active 17 DOM
-
2026-06-07days on market $215,000 Active 16 DOM
-
2026-06-03days on market $215,000 Active 13 DOM
-
2026-06-02days on market $215,000 Active 12 DOM
-
2026-06-01days on market $215,000 Active 11 DOM
-
2026-05-31days on market $215,000 Active 10 DOM
-
2026-05-22$215,000 Active
-
2016-11-09$135,000
-
2016-11-09$135,000
-
2003-11-21soldstatus $77,500
-
2003-11-21soldstatus $77,500
-
2003-08-21$83,000
ⓘ Source: listings_history table (triggers on properties + properties_extension) + one-shot
backfill from property_details.listing_events for pre-trigger history.
Tax reassessment forecast WA · Resets to sale price
- Current annual tax
- $2,056 · $171/mo
- Projected year-2 tax
- $2,107 · $176/mo
- Expected delta
- +$51/yr (+$4/mo · 2.5%)
ⓘ Screening estimate from a state-policy table — verify with the county assessor before closing.
Climate risk First Street
- Flood 1/10 Low FEMA zone X · 0% chance over 30 yrs
- Wildfire 5/10 Major
- Heat 5/10 Major 7 d/yr ≥98°F today · 15 d/yr by 30 yrs out
- Wind 1/10 Low
- Air quality 9/10 Extreme 13 unhealthy d/yr today · 13 by 30 yrs out
Nearby sold comps map
Loading sold comps map…
Walkable amenities ~0.75 mi
Loading nearby amenities…
Taxation est. · year 1
- Rental income
- $28,800
- − Mortgage interest
- −$12,043
- − Property taxes
- −$2,056
- − Insurance
- −$1,075
- − Repairs & maintenance
- −$2,304
- − Management
- −$2,304
- − Depreciation
- −$6,255
- Taxable income
- $2,763
- Est. tax owed @ 24.0%
- −$663
- After-tax cash flow
- $5,428/yr
For passive investors: Depreciation is non-cash, so a rental often shows a tax loss while cash-flowing — sheltering income. Rental losses are passive: they offset passive income freely, and up to $25,000/yr can offset ordinary (W-2) income if you actively participate and your MAGI is under $100k (phasing out to $0 by $150k); unused losses carry forward. On sale, claimed depreciation is recaptured at up to 25%, and gains may owe capital-gains tax (a 1031 exchange can defer both). Figures are a year-1 estimate at your 24.0% rate — not tax advice; consult a CPA.
Schools (NCES district)
- District
- Prosser School District
- NCES district ID
- 5306900
- Math proficiency
- 36% ▼ -2.00%
- Reading proficiency
- 46% ▬ 0.00%
- Median HH income
- $52,089
- Composite
- 37.89/100
- National rank
- #8699
- State rank
- #208 of 291 in WA
Livability — Prosser
- Score
- 80/100
- State rank
- #91
- US rank
- #1785
Category grades
Schools grade is shown separately in the Schools card above.
Census & demographics
- Census place
- Prosser, WA
- Population (ZIP)
- 14,278
Population outlook (Benton County) Hauer SSP2
- Today (2025)
- 219,421 people
- By 2030
- 233,813 · +6.6%
- By 2040
- 262,134 · +19.5%
- By 2050
- 290,100 · +32.2%
- By 2075
- 363,525 · +65.7%
- By 2100
- 418,667 · +90.8%
Race, ethnicity, and origin ACS 2023
- Race & ethnicity
- White 50% Hispanic / Latino 46% Two or more races 17% Asian 2% Native American 1%
- Hispanic origin (detail)
- Mexican 43%
- Common ancestry
- Italian 3% Iranian 3% Slovak 2%
- Foreign-born
- 15% · Canada
- Languages at home
- 64% English-only · Spanish 34% Other Asian/Pacific 1%
Political lean MEDSL · Benton
- 2024 margin
- Strong R (+21.9) · D 37.7% · R 59.6% · Other 2.7%
- 2008→2024 swing
- +4.2pp toward D · 2008: -26.1pp · 2024: -21.9pp
- All cycles
- 2024: R+21.9 2020: R+21.0 2016: R+26.6 2012: R+27.0 2008: R+26.1
Not yet ingested
- Civics
- —
Market trends
- HPI YoY
- ▼ -118.73%
- Current HPI
- 256.9999
- Rent YoY
- —
- Metro
- —
- State GDP YoY
- ▲ 4.65%
- F500 in state
- 22
Industry mix (Fortune 500 HQ in WA)
| Industry | F500 HQs | Revenue |
|---|---|---|
| Retail | 2 | $269B |
|
||
| Technology / Retail | 1 | $638B |
|
||
| Technology | 1 | $245B |
|
||
| Telecommunications | 1 | $38B |
|
||
| Food / Beverage | 1 | $36B |
|
||
| Automotive / Trucks | 1 | $34B |
|
||
Price history
+159.0% since first listed6 events — show timeline
- 2026-05-22 Listed $215,000 PACMLS
- 2016-11-09 Listed $135,000 YAMLS
- 2016-11-09 Listed $135,000 PACMLS
- 2003-11-21 Sold (Public Records) $77,500 Public Records
- 2003-11-21 Sold (MLS) $77,500 PACMLS
- 2003-08-21 Listed $83,000 PACMLS
Property tax history
+6.7%/yrLatest (2026): $2,056 · +0.2% YoY. Source: county tax records.
Cash-flow waterfall
monthlySold comps — $/sqft
last 12 mo · ≤1 miLoading sold comps…