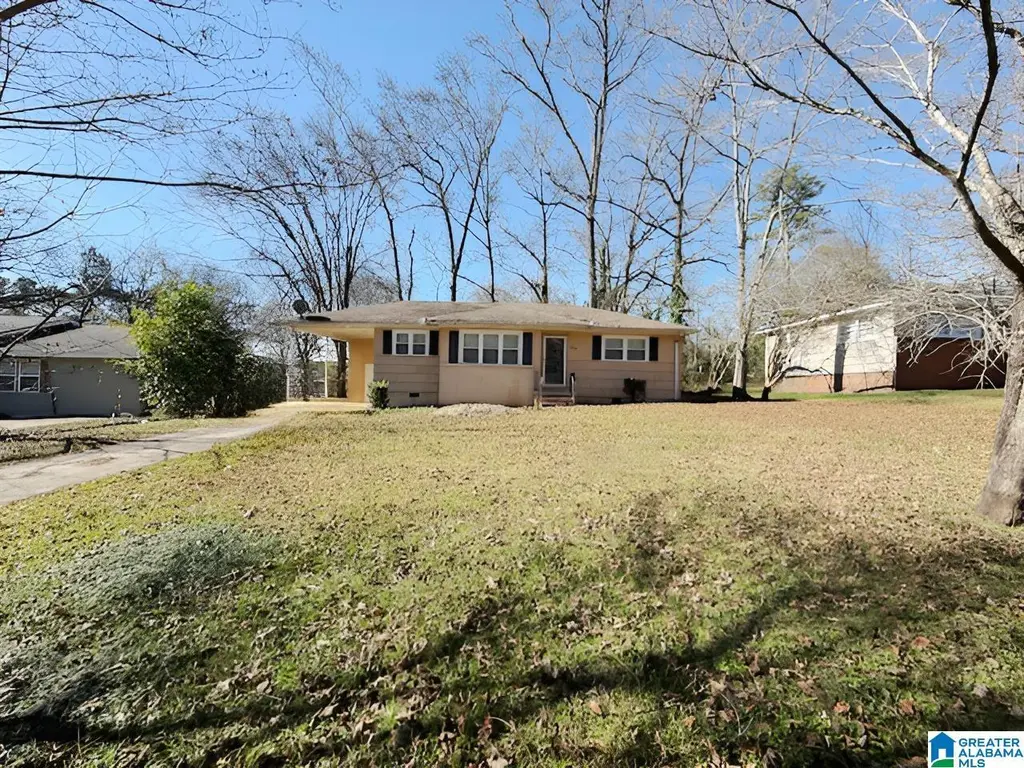
1124 Dogwood Ln · Birmingham, AL
Flood risk 1/10 · Minimal
- FEMA flood zone
- X (unshaded)
- Chance of flooding over 30 yrs
- 0.0%
- Est. flood insurance / yr
- $507 – $1,088
Fire risk 3/10 · Minor
- Est. fire insurance / yr
- $916 – $1,700
Heat risk 6/10 · Moderate
- Hot days now (above 106°F)
- 7 days/yr
- Hot days in 30 yrs
- 19 days/yr
Wind risk 6/10 · Moderate
- Chance of severe wind over 30 yrs
- 27.0%
Air-quality risk 5/10 · Moderate
- Unhealthy air days now
- 7 days/yr
- Unhealthy air days in 30 yrs
- 9 days/yr
Risk factors via First Street. Map © Google.
Why this score? — see what drove the B grade
The composite is a weighted blend of 9 inputs, each scored 0–100. Each bar is that input's sub-score; the figure is the points it added to the 100-point composite (weight × sub-score).
- Cash flow +29.0/30.0
- ARV discount +15.0/15.0
- DSCR +10.0/10.0
- 1% rule +8.0/10.0
- Livability +3.4/5.0
- Rent growth +3.3/5.0
- Condition / age +2.5/5.0
- Schools +0.9/10.0
- Appreciation +0.0/10.0
$99,900
🖨 Deal sheet 📄 Offer letter ✓ Due diligence
Listing remarks MLS
This 3-bedroom, 1-bath home presents a great opportunity to create something truly special. Featuring a functional layout with comfortable living spaces, the property offers a solid starting point for personalization and design. A convenient carport provides covered parking, while the spacious rear deck is ideal for outdoor entertaining, relaxing evenings, or future enhancements. The lot offers ample space to expand or elevate the outdoor setting to suit your vision. Inside, the home showcases classic elements ready to be refreshed and reimagined, making it an excellent option for those looking to add value over time. Whether you're an investor or a buyer with an eye for potential, this property offers a promising canvas in an established setting with room to make it your own.
Key facts
- Classic elements
- Carport
- Rear deck
Tags
Neighborhood map
What this means for you Summary
Snapshot
- This is a 3-bed/1.0-bath single-family listed at $100k.
Deal economics
- At list price, monthly cash flow is $341 ($4k/yr) — positive.
- The deal already cash-flows at list — no discount required.
- Meets the 1% rule at list price ($1k rent vs $100k).
- Recommended offer: $97k (3.0% below list) — sets the bar for market timing.
- Cap rate 10.4% vs local median 6.2% in Birmingham — top-decile yield for the area; either an underpriced asset or a hidden risk that comps aren't pricing in. Stress-test before assuming the spread holds.
Location & tenants
- Location reads 67/100 on livability (#78 in AL) — a middle-class / working-renter tenant base. Strengths: commute A+, cost of living A+, housing A+; Watch: amenities C-, schools F, crime F.
- Birmingham City (urban): math 4% / reading 20% proficiency, ranked #116 of 129 in AL (top 90%) — low school quality limits family demand, transient renter base, plan for 1-2y turnover; 82% free/reduced lunch — lower-income household profile, screen leases tightly.
- Market conditions: Rents rising (+3.0%/yr); 334 active listings in the ZIP; 40 comparable units currently listed for rent nearby; rentals at typical pace (median 24d on market — plan ~3-4 weeks tenant-placement turnaround); 2,114 units permitted in Jefferson County in 2024 (556 in 5+ unit buildings).
Forward outlook
- Local home prices are declining (-3.0%/yr); year-one equity from $691 of loan paydown is wiped out by about $3k of value loss. Plan a longer hold.
- Jefferson County population projected to shrink 4% by 2050 — rents likely to lag national; underwrite the cash flow, not the appreciation.
- At projected returns (-3.0% appreciation + 3.0% rent growth), your $28k cash investment doubles in ~8 years — after that, you're playing with house money.
Negotiation context
- It's been on market 57 days — a 3% lower offer ($97k) is reasonable based on typical stale-listing flexibility.
- 2 sale attempts since 12y ago with the ask held roughly flat each time — persistent listings suggest the price (not the market) is what's stuck; bring a comps-based counter.
Risks & watch-outs
- Watch-outs: built in 1956 — expect roof / HVAC / electrical / plumbing capex.
- Climate carrying-cost: major wind risk, 27% chance of damaging wind over 30y; extreme-heat days projected 7→19/yr by 2055 (HVAC capex compounding) — expect insurance premiums to compound above CPI over the hold.
Questions for the listing agent
- It's been on market 57 days. Have you received any prior offers? Is the seller open to a 3% concession, seller financing, or rate buy-down credit?
- Built in 1956 — when were the roof, HVAC, electrical panel, plumbing, and water heater last replaced?
- Is there a deadline driving the sale (1031 exchange, divorce, estate, relocation)? That informs how much negotiation room exists.
- Schools are F-rated, which usually means shorter tenancies and higher turnover. Who's the typical renter profile here, and what's been the actual vacancy rate?
- Crime grade is F in this area — have there been break-ins, vandalism, or insurance claims at this property in the last 3 years? What carrier currently insures it and at what premium?
- What's the average days-on-market for RENTAL listings here right now (not sales)? A rising rental-DOM trend means longer vacancies and softer asking-rent achievability than the comps imply.
- What's the recent tenant-quality profile in this submarket — average credit score on applications, eviction rate, late-payment / NSF rate, and stable-employment percentage? A property-management company in the area should have these aggregated.
- How much new for-sale + rental construction is in the pipeline within 1–3 miles? Heavy new supply typically softens prices + rents 12–24 months out; constrained supply supports both.
Investment metrics
- 1% rule
- 1.30% ✓
- Cap rate
- 10.39%
- Cash-on-cash
- 14.65%
- DSCR
- 1.65
- GRM
- 6.4
CMA / ARV
- ARV (median comp)
- $134,219
- List price
- $99,900
- Delta
- -25.57%
- Verdict
- UNDERPRICED
- Comps
- 20 within 1.0 mi
Show comp detail 12 sales within ~0.75 mi
| Address | Dist | Beds/Ba | Sqft | Sold | Price | $/sf | Match |
|---|---|---|---|---|---|---|---|
| 508 Camellia Rd | 0.28mi | 3/1.0 | 1,048 (+4%) | 6mo | $20,000 | $19 | 75 |
| 936 Parkway Dr | 0.50mi | 2/1.0 (-1) | 1,062 (+5%) | 3mo | $104,500 | $98 | 61 |
| 421 Wedgeworth Rd | 0.47mi | 3/1.5 | 1,092 (+8%) | 2mo | $116,400 | $107 | 61 |
| 1209 Rose Lynn Ln | 0.65mi | 3/1.0 | 1,080 (+7%) | 0mo | $150,000 | $139 | 58 |
| 1153 Linwood St | 0.55mi | 3/1.0 | 1,068 (+6%) | 10mo | $75,500 | $71 | 56 |
| 1317 5th Pl NW | 0.69mi | 3/1.0 | 1,086 (+8%) | 1mo | $92,500 | $85 | 54 |
| 808 Meadowbrook Dr | 0.69mi | 3/1.0 | 1,112 (+10%) | 1mo | $149,900 | $135 | 50 |
| 1316 Glenwood St | 0.68mi | 2/2.0 (-1) | 1,024 (+1%) | 9mo | $130,000 | $127 | 49 |
| 424 13th Ct NW | 0.73mi | 3/1.0 | 1,118 (+11%) | 1mo | $92,500 | $83 | 47 |
| 940 Meadowbrook Dr | 0.43mi | 4/1.0 (+1) | 1,149 (+14%) | 6mo | $108,000 | $94 | 47 |
| 308 13th Ave NW | 0.65mi | 3/1.0 | 1,144 (+13%) | 7mo | $87,500 | $76 | 42 |
| 409 13th Ct NW | 0.72mi | 3/1.5 | 1,118 (+11%) | 6mo | $98,672 | $88 | 42 |
Match score weights: distance 35% · size 25% · config 20% · recency 20%. Top-matched comps best support the ARV.
Projected returns pro-forma
-3.0% appreciation · 3.04% rent growth · sell at horizon
- IRR
- 5.2%
- Equity multiple
- 1.20×
- Total profit
- $5,631
- Equity at exit
- $14,895
- IRR
- 14.7%
- Equity multiple
- 2.19×
- Total profit
- $33,196
- Equity at exit
- $8,638
Cash invested: $27,972 (down + closing). Projections, not guarantees.
Landlord ↔ Tenant lean methodology
- Overall (STATE)
- 90 Strongly Landlord-Friendly
- State Alabama
- 90 Strongly Landlord-Friendly · R+15
- County
- — inherits STATE
- City
- — inherits STATE
ZIP-level market 35215
- Home prices YoY
- -34.4%
- Rents YoY
- 3.0%
- Active inventory
- 334
- Price-to-rent
- 6.4×
Monthly cashflow live
- Estimated rent
- $1,302 high interval (Pro) →
- Mortgage (P&I)
- −$524
- Tax from tax record
- −$122 /mo · $1,463/yr
- Insurance
- −$42
- HOA
- −$0
- Vacancy / Maint / Mgmt
- −$274
- Net cashflow
- $341
Break-even live
UW: 25.0% down · 7.5% · 30yr · 1.5% tax · 5.0% vac · 8.0% maint · 8.0% mgmt
Financing live
Cash to close
- Down payment
- $24,975
- Closing costs
- $2,997
- Reserves months
- —
- Total cash needed
- —
Loan-product check · same deal, 3 products live
Conventional
25% down · 7.5% · 30yr
- Down + closing
- —
- Monthly P&I
- —
- Monthly cashflow
- —
- DSCR
- —
- Eligible?
- —
Personal DTI + credit; lowest rate.
DSCR
20% down · 8.5% · 30yr
- Down + closing
- —
- Monthly P&I
- —
- Monthly cashflow
- —
- DSCR
- —
- Eligible?
- —
No personal income docs; deal must DSCR.
Hard money
10% down · 12.0% · 12mo
- Down + closing
- —
- Monthly P&I
- —
- Monthly cashflow
- —
- DSCR
- —
- Eligible?
- —
Short-term bridge; refi at stabilization.
Rent comps 40 comps
| Address | Beds | Baths | Sqft | Rent | $/sqft | DOM | Units | Dist |
|---|---|---|---|---|---|---|---|---|
| 1112 Violet Dr Birmingham, AL | 3.0 | 2.0 | 1414 | $1,600 | $1.13 | 11d | 1 | 0.09mi |
| 433 Orchid Rd Birmingham, AL | 3.0 | 1.0 | 1162 | $1,255 | $1.08 | 15d | 1 | 0.27mi |
| 520 Camellia Rd Birmingham, AL | 3.0 | 1.0 | 1053 | $1,100 | $1.04 | 3d | 1 | 0.31mi |
| 940 Meadowbrook Dr Birmingham, AL | 4.0 | 1.0 | 1149 | $1,300 | $1.13 | 43d | 1 | 0.44mi |
| 945 Elizabeth Dr Birmingham, AL | 3.0 | 1.0 | 1227 | $1,125 | $0.92 | 3d | 1 | 0.49mi |
| 932 Five Mile Rd Birmingham, AL | 3.0 | 1.5 | 1200 | $1,175 | $0.98 | 19d | 1 | 0.50mi |
| 217 Killough Dr Birmingham, AL | 3.0 | 2.0 | 1212 | $1,200 | $0.99 | 14d | 1 | 0.53mi |
| 120 Shawnee Ln NW Birmingham, AL | 3.0 | 1.0 | 1120 | $1,075 | $0.96 | 43d | 1 | 0.53mi |
| 912 Meadowbrook Dr Birmingham, AL | 3.0 | 1.0 | 1178 | $1,100 | $0.93 | 43d | 1 | 0.53mi |
| 1153 Linwood St Birmingham, AL | 3.0 | 2.0 | 1250 | $1,295 | $1.04 | 2d | 1 | 0.56mi |
| 208 Sam Pate Dr Birmingham, AL | 3.0 | 2.0 | 988 | $1,385 | $1.40 | 1d | 1 | 0.58mi |
| 1232 Oakwood St Birmingham, AL | 3.0 | 1.5 | 1301 | $1,223 | $0.94 | 23d | 1 | 0.59mi |
| 241 Mamie Ln Birmingham, AL | 3.0 | 2.0 | 1242 | $1,495 | $1.20 | 3d | 1 | 0.60mi |
| 1225 Birchwood St Birmingham, AL | 3.0 | 2.0 | 1092 | $1,175 | $1.08 | 3d | 1 | 0.60mi |
| 832 Meadowbrook Dr Birmingham, AL | 3.0 | 2.0 | 1228 | $1,225 | $1.00 | 23d | 1 | 0.61mi |
| 1301 5th Pl NW Center Point, AL | 3.0 | 1.0 | 1170 | $1,100 | $0.94 | 3d | 1 | 0.63mi |
| 400 13th Ave NW Birmingham, AL | 2.0 | 1.0 | 1100 | $890 | $0.81 | 43d | 1 | 0.64mi |
| 1305 5th Pl NW Center Point, AL | 3.0 | 2.0 | 1092 | $1,200 | $1.10 | 43d | 1 | 0.65mi |
| 818 Sunset Dr Birmingham, AL | 3.0 | 1.0 | 992 | $1,000 | $1.01 | 43d | 1 | 0.66mi |
| 1237 Linwood St Birmingham, AL | 3.0 | 1.5 | 1066 | $995 | $0.93 | 43d | 1 | 0.67mi |
| 1328 5th Pl NW Center Point, AL | 3.0 | 1.0 | 1250 | $1,050 | $0.84 | 15d | 1 | 0.72mi |
| 405 13th Ct NW Center Point, AL | 4.0 | 1.5 | 1248 | $1,415 | $1.13 | 21d | 1 | 0.72mi |
| 957 Hickory Cir Birmingham, AL | 3.0 | 2.0 | 1364 | $1,195 | $0.88 | 3d | 1 | 0.73mi |
| 1333 5th Pl NW Center Point, AL | 3.0 | 2.0 | 1056 | $1,275 | $1.21 | 43d | 1 | 0.75mi |
| 848 Old Trail Rd Birmingham, AL | 2.0 | 1.5 | 930 | $925 | $0.99 | 23d | 1 | 0.76mi |
| 108 13th Ave NW Center Point, AL | 4.0 | 2.0 | 1444 | $1,265 | $0.88 | 23d | 1 | 0.79mi |
| 324 13th Ter NW Center Point, AL | 3.0 | 1.5 | 1418 | $1,295 | $0.91 | 23d | 1 | 0.79mi |
| 1356 5th Pl NW Center Point, AL | 3.0 | 1.0 | 1064 | $1,105 | $1.04 | 43d | 1 | 0.81mi |
| 628 Annie Laura Dr Birmingham, AL | 3.0 | 1.0 | 844 | $1,195 | $1.42 | 43d | 1 | 0.90mi |
| 621 15th Ave NW Birmingham, AL | 4.0 | 2.0 | 1070 | $1,200 | $1.12 | 15d | 1 | 0.95mi |
| 837 Wear Dr Birmingham, AL | 3.0 | 2.0 | 936 | $1,295 | $1.38 | 1d | 1 | 0.97mi |
| 500 15th Ave NW Center Point, AL | 3.0 | 1.0 | 1079 | $1,050 | $0.97 | 2d | 1 | 0.98mi |
| 529 Robison Dr Birmingham, AL | 2.0 | 1.0 | 960 | $960 | $1.00 | 21d | 1 | 0.99mi |
| 252 Westwood Dr Birmingham, AL | 3.0 | 1.5 | 1124 | $1,400 | $1.25 | 1d | 1 | 1.03mi |
| 736 Gene Reed Rd Birmingham, AL | 3.0 | 2.0 | 1353 | $1,220 | $0.90 | 43d | 1 | 1.09mi |
| 316 Pine St Birmingham, AL | 3.0 | 1.0 | 1232 | $1,100 | $0.89 | 43d | 1 | 1.09mi |
| 925 Eldorado Dr Birmingham, AL | 3.0 | 1.0 | 1312 | $1,231 | $0.94 | 43d | 1 | 1.10mi |
| 252 Meadowdale Ave Birmingham, AL | 3.0 | 1.0 | 920 | $995 | $1.08 | 43d | 1 | 1.13mi |
| 769 15th Ct NW Birmingham, AL | 3.0 | 1.5 | 1130 | $1,310 | $1.16 | 11d | 1 | 1.14mi |
| 434 15th Ter NW Center Point, AL | 3.0 | 2.0 | 1053 | $1,200 | $1.14 | 43d | 1 | 1.14mi |
Listing history 19 events
-
2026-06-18days on market $99,900 Active 57 DOM
-
2026-06-17days on market $99,900 Active 56 DOM
-
2026-06-16days on market $99,900 Active 55 DOM
-
2026-06-15days on market $99,900 Active 54 DOM
-
2026-06-13days on market $99,900 Active 52 DOM
-
2026-06-10days on market $99,900 Active 49 DOM
-
2026-06-09days on market $99,900 Active 48 DOM
-
2026-06-08days on market $99,900 Active 47 DOM
-
2026-06-07days on market $99,900 Active 46 DOM
-
2026-06-03days on market $99,900 Active 42 DOM
-
2026-06-02days on market $99,900 Active 41 DOM
-
2026-06-01days on market $99,900 Active 40 DOM
-
2026-05-31days on market $99,900 Active 39 DOM
-
2026-04-21$99,900 Active 787-char remark
Show marketing remark (787 chars)
This 3-bedroom, 1-bath home presents a great opportunity to create something truly special. Featuring a functional layout with comfortable living spaces, the property offers a solid starting point for personalization and design. A convenient carport provides covered parking, while the spacious rear deck is ideal for outdoor entertaining, relaxing evenings, or future enhancements. The lot offers ample space to expand or elevate the outdoor setting to suit your vision. Inside, the home showcases classic elements ready to be refreshed and reimagined, making it an excellent option for those looking to add value over time. Whether you're an investor or a buyer with an eye for potential, this property offers a promising canvas in an established setting with room to make it your own.
-
2025-12-19soldstatus $951,400
-
2018-10-25soldstatus $148,000
-
2015-01-02soldstatus $34,000 59-char remark
Show marketing remark (59 chars)
Buyers are responsible for rekey of property after closing.
-
2014-11-19$30,000 59-char remark
Show marketing remark (59 chars)
Buyers are responsible for rekey of property after closing.
-
2010-01-27soldstatus $64,900
ⓘ Source: listings_history table (triggers on properties + properties_extension) + one-shot
backfill from property_details.listing_events for pre-trigger history.
Tax reassessment forecast AL · Resets to sale price
- Current annual tax
- $1,463 · $122/mo
- Projected year-2 tax
- $1,463 · $122/mo
- Expected delta
- $0/yr ($0/mo · 0.0%)
ⓘ Screening estimate from a state-policy table — verify with the county assessor before closing.
Climate risk First Street
- Flood 1/10 Low FEMA zone X (unshaded) · 0% chance over 30 yrs
- Wildfire 3/10 Moderate
- Heat 6/10 Major 7 d/yr ≥106°F today · 19 d/yr by 30 yrs out
- Wind 6/10 Major 27% chance of damaging wind over 30 yrs
- Air quality 5/10 Major 7 unhealthy d/yr today · 9 by 30 yrs out
Nearby sold comps map
Loading sold comps map…
Walkable amenities ~0.75 mi
Loading nearby amenities…
Taxation est. · year 1
- Rental income
- $15,629
- − Mortgage interest
- −$5,596
- − Property taxes
- −$1,463
- − Insurance
- −$500
- − Repairs & maintenance
- −$1,250
- − Management
- −$1,250
- − Depreciation
- −$2,906
- Taxable income
- $2,664
- Est. tax owed @ 24.0%
- −$639
- After-tax cash flow
- $3,458/yr
For passive investors: Depreciation is non-cash, so a rental often shows a tax loss while cash-flowing — sheltering income. Rental losses are passive: they offset passive income freely, and up to $25,000/yr can offset ordinary (W-2) income if you actively participate and your MAGI is under $100k (phasing out to $0 by $150k); unused losses carry forward. On sale, claimed depreciation is recaptured at up to 25%, and gains may owe capital-gains tax (a 1031 exchange can defer both). Figures are a year-1 estimate at your 24.0% rate — not tax advice; consult a CPA.
Schools (NCES district)
- District
- Birmingham City
- NCES district ID
- 0100390
- Math proficiency
- 4% ▼ -17.00%
- Reading proficiency
- 20% ▼ -4.00%
- Median HH income
- $31,988
- Composite
- 9.49/100
- National rank
- #9850
- State rank
- #116 of 129 in AL
Livability — Birmingham
- Score
- 67/100
- State rank
- #78
- US rank
- #10412
Category grades
Schools grade is shown separately in the Schools card above.
Census & demographics
- Census place
- Birmingham, AL
- County
- Jefferson County · 527,445 people
- City population
- 210,422
- Metro
- Birmingham-Hoover, AL
- Population (ZIP)
- 43,903
- Household income
- $52,793
- Rent vs Own
- Severe rent burden
- 1729.0
Population outlook (Jefferson County) Hauer SSP2
- Today (2025)
- 669,185 people
- By 2030
- 669,694 · +0.1%
- By 2040
- 661,388 · -1.2%
- By 2050
- 643,086 · -3.9%
- By 2075
- 577,267 · -13.7%
- By 2100
- 474,758 · -29.1%
Race, ethnicity, and origin ACS 2023
- Neighborhood character
- Predominantly Black (75%)
- Race & ethnicity
- Black 75% White 15% Hispanic / Latino 7% Two or more races 3%
- Hispanic origin (detail)
- Mexican 4%
- Common ancestry
- Lithuanian 1% Italian 1% Slovak 1%
- Foreign-born
- 4% · Canada
- Languages at home
- 92% English-only · Spanish 7%
Political lean MEDSL · Jefferson
- 2024 margin
- D (+10.4) · D 54.6% · R 44.2% · Other 1.2%
- 2008→2024 swing
- +5.4pp toward D · 2008: 5.1pp · 2024: 10.4pp
- All cycles
- 2024: D+10.4 2020: D+13.2 2016: D+7.2 2012: D+6.0 2008: D+5.1
Not yet ingested
- Civics
- —
Market trends
- HPI YoY
- ▼ -112.97%
- Current HPI
- 215.0607
- Rent YoY
- ▲ 3.04%
- Metro
- Birmingham-Hoover, AL
- State GDP YoY
- ▲ 2.94%
- F500 in state
- 4
Industry mix (Fortune 500 HQ in AL)
| Industry | F500 HQs | Revenue |
|---|---|---|
| Financial Services | 1 | $8B |
|
||
| Healthcare | 1 | $5B |
|
||
Price history
+53.9% since first listed6 events — show timeline
- 2026-04-21 Listed $99,900 Greater Alabama MLS
- 2025-12-19 Sold (Public Records) $951,400 Public Records
- 2018-10-25 Sold (Public Records) $148,000 Public Records
- 2015-01-02 Sold (MLS) $34,000 Greater Alabama MLS
- 2014-11-19 Listed $30,000 Greater Alabama MLS
- 2010-01-27 Sold (Public Records) $64,900 Public Records
Property tax history
+11.0%/yrLatest (2025): $1,463 · +0.0% YoY. Source: county tax records.
Cash-flow waterfall
monthlySold comps — $/sqft
last 12 mo · ≤1 miLoading sold comps…