10725 S Ocean Dr #162 · Hutchinson Island South, FL
Flood risk 9/10 · Severe
- FEMA flood zone
- AE
- Chance of flooding over 30 yrs
- 0.99%
- Est. flood insurance / yr
- $1,737 – $8,500
Fire risk 1/10 · Minimal
- Est. fire insurance / yr
- $947 – $1,759
Heat risk 10/10 · Severe
- Hot days now (above 106°F)
- 7 days/yr
- Hot days in 30 yrs
- 24 days/yr
Wind risk 10/10 · Severe
- Chance of severe wind over 30 yrs
- 99.0%
Air-quality risk 2/10 · Minimal
- Unhealthy air days now
- 1 days/yr
- Unhealthy air days in 30 yrs
- 2 days/yr
Risk factors via First Street. Map © Google.
Why this score? — see what drove the F grade
The composite is a weighted blend of 9 inputs, each scored 0–100. Each bar is that input's sub-score; the figure is the points it added to the 100-point composite (weight × sub-score).
- Cash flow +11.0/30.0
- 1% rule +5.7/10.0
- Schools +3.7/10.0
- DSCR +3.2/10.0
- Livability +3.1/5.0
- Rent growth +2.8/5.0
- Condition / age +2.5/5.0
- ARV discount +0.0/15.0
- Appreciation +0.0/10.0
$167,500
🖨 Deal sheet 📄 Offer letter ✓ Due diligence
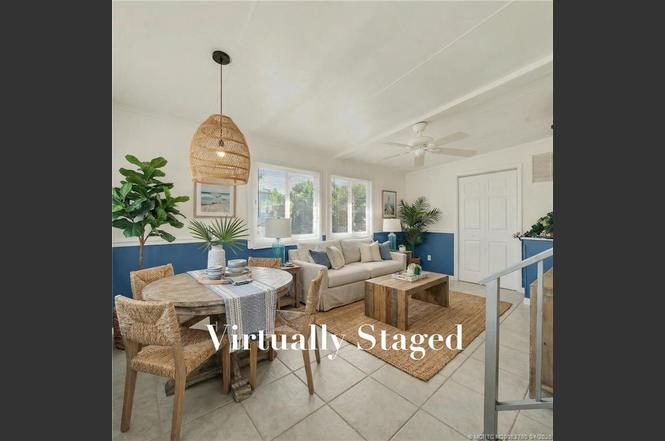
Listing remarks
Little house, large lifestyle! This 2-bedroom beach getaway on Hutchinson Island is your ticket to island time. Park with ease on the oversized driveway, grab your beach bag, and stroll through the nearby tunnel to your private stretch of sand. Low HOA fees (yes, cable and water are included!). Your four-legged friend is totally invited, because paradise should be shared. The Holiday Out community buzzes with life: pickleball showdowns, sunset barbecues on the oceanfront deck, and impromptu happy hours after a swim in the oceanside pool. Feeling nautical? Enjoy access to the neighboring community's marina for affordable boat slip rentals. Plus, you’re about a mile from 5 great restaur
Key facts
- Oceanside pool
- Oversized driveway
- Pet friendly
Tags
Property features AI
Finance
- Other: Pets allowed (with limits)
- HOA & community: Homeowners association with $292 monthly fee; Association covers management, common areas, cable TV, grounds maintenance, pool(s), recreation facilities, reserve fund, sewer and water; Community amenities include barbecue, beach access, billiard room, bocce court, clubhouse, dog park, game room, kitchen facilities, library, pickleball, on-site property manager, pool, shuffleboard, street lights, sidewalks, trails/paths, and gated entry
Exterior
- Parking: Driveway
- Security: Gated community; Smoke detectors
- Utilities: Cable available; Electricity available and connected; Sewer available; Water available
- Home design: Manufactured home; Single-story; Resale property; Vinyl siding
- Construction: Vinyl siding construction; Manufactured construction
- Exterior features: Storm/security shutters; Community pool; Beach access; Zero lot line; Paved private road
Interior
- Kitchen: Dishwasher; Electric range; Microwave; Disposal; Refrigerator
- Flooring: Ceramic tile
- Bathrooms: 1 full bathroom
- Heating & cooling: Central heating; Central air conditioning; Electrical: 110V and 220V
- Interior features: Partially furnished; Built-in features; Ceramic tile flooring
- Laundry & utility: Washer; Dryer; Water heater
Neighborhood map
What this means for you Summary
Snapshot
- This is a 2-bed/1.0-bath manufactured listed at $168k.
Deal economics
- At list price, monthly cash flow is $-497 ($-6k/yr) — negative.
- To cash-flow at today's rent, offer at most $80k (52.4% below list).
- Meets the 1% rule at list price ($2k rent vs $168k).
- Recommended offer: $80k (52.4% below list) — sets the bar for cash-flow.
- Cap rate 5.8% vs local median 1.9% in Hutchinson Island South — top-decile yield for the area; either an underpriced asset or a hidden risk that comps aren't pricing in. Stress-test before assuming the spread holds.
Location & tenants
- Location reads 61/100 on livability (#783 in FL) — a middle-class / working-renter tenant base. Strengths: crime A+, housing B; Watch: cost of living C-, schools D, amenities F.
- St. Lucie (urban): math 40% / reading 48% proficiency, ranked #51 of 73 in FL (top 70%) — families likely to look elsewhere, expect single-tenant / working-renter base with shorter leases.
- Market conditions: Rents rising (+1.0%/yr); 536 active listings in the ZIP; 4,868 units permitted in St. Lucie County in 2024 (268 in 5+ unit buildings).
- This rent runs 31% of the median local income ($70k/yr) — at the standard rent-burdened threshold; future hikes will face affordability resistance.
Forward outlook
- Local home prices are declining (-3.0%/yr); year-one equity from $1k of loan paydown is wiped out by about $5k of value loss. Plan a longer hold.
- St. Lucie County population projected at +20% by 2050 — long-run rental-demand tailwind backs the buy-and-hold thesis.
Negotiation context
- It's been on market 227 days — a 12% lower offer ($147k) is reasonable based on typical stale-listing flexibility.
- 5 sale attempts since 26y ago; this cycle's ask has dropped $20k (11%) from the opening price — seller is motivated, your offer sets the floor, not the list.
Risks & watch-outs
- Watch-outs: flood insurance adds $427/mo.
- Climate carrying-cost: in FEMA flood zone AE (mandatory federal flood insurance); severe wind risk, 99% chance of damaging wind over 30y; extreme-heat days projected 7→24/yr by 2055 (HVAC capex compounding) — expect insurance premiums to compound above CPI over the hold.
Questions for the listing agent
- What do current leases actually rent for vs. the listed asking? Can we see a recent rent roll and the last 12 months of T-12 income?
- It's been on market 227 days. Have you received any prior offers? Is the seller open to a 52% concession, seller financing, or rate buy-down credit?
- What's the actual annual flood-insurance premium (NFIP or private), and is the property in a SFHA with mandatory coverage?
- What does the HOA fee cover, when was the last increase, and are there any pending special assessments or reserve-fund shortfalls?
- Why hasn't it sold? Are there any deal-killer items the seller is aware of (foundation, flood, title, zoning, code violations)?
- Is there a deadline driving the sale (1031 exchange, divorce, estate, relocation)? That informs how much negotiation room exists.
- Schools are D-rated, which usually means shorter tenancies and higher turnover. Who's the typical renter profile here, and what's been the actual vacancy rate?
- The area grade is low — what's the realistic commute time and amenity access for the typical tenant pool here? Any planned neighborhood developments (good or bad) we should know about?
- What's the average days-on-market for RENTAL listings here right now (not sales)? A rising rental-DOM trend means longer vacancies and softer asking-rent achievability than the comps imply.
- What's the recent tenant-quality profile in this submarket — average credit score on applications, eviction rate, late-payment / NSF rate, and stable-employment percentage? A property-management company in the area should have these aggregated.
- How much new for-sale + rental construction is in the pipeline within 1–3 miles? Heavy new supply typically softens prices + rents 12–24 months out; constrained supply supports both.
Investment metrics
- 1% rule
- 1.07% ✓
- Cap rate
- 5.79%
- Cash-on-cash
- -1.79%
- DSCR
- 0.92
- GRM
- 7.8
CMA / ARV
- ARV (on-the-fly)
- $133,376
- Comps found
- 1
Show comp detail 1 sale within ~0.75 mi
| Address | Dist | Beds/Ba | Sqft | Sold | Price | $/sf | Match |
|---|---|---|---|---|---|---|---|
| 10725 S Ocean Dr #370 | 0.00mi | 1/1.0 (-1) | 288 (+12%) | 15mo | $150,000 | $521 | 62 |
Match score weights: distance 35% · size 25% · config 20% · recency 20%. Top-matched comps best support the ARV.
Projected returns pro-forma
-3.0% appreciation · 1.0% rent growth · sell at horizon
- IRR
- -44.0%
- Equity multiple
- -0.32×
- Total profit
- $-61,817
- Equity at exit
- $24,975
- IRR
- —
- Equity multiple
- -1.27×
- Total profit
- $-106,501
- Equity at exit
- $14,482
Cash invested: $46,900 (down + closing). Projections, not guarantees.
Landlord ↔ Tenant lean methodology
- Overall (STATE)
- 87 Strongly Landlord-Friendly
- State Florida
- 87 Strongly Landlord-Friendly · R+3
- County
- — inherits STATE
- City
- — inherits STATE
ZIP-level market 34957
- Rents YoY
- 1.0%
- Active inventory
- 536
- Price-to-rent
- 7.8×
Monthly cashflow live
- Estimated rent
- $1,792 medium interval (Pro) →
- Mortgage (P&I)
- −$878
- Tax from tax record
- −$246 /mo · $2,946/yr
- Insurance
- −$70
- Flood insurance flood zone
- −$427 /mo · $5,118/yr
- HOA
- −$292
- Vacancy / Maint / Mgmt
- −$376
- Net cashflow
- $-497
Break-even live
UW: 25.0% down · 7.5% · 30yr · 1.5% tax · 5.0% vac · 8.0% maint · 8.0% mgmt
Financing live
Cash to close
- Down payment
- $41,875
- Closing costs
- $5,025
- Reserves months
- —
- Total cash needed
- —
Loan-product check · same deal, 3 products live
Conventional
25% down · 7.5% · 30yr
- Down + closing
- —
- Monthly P&I
- —
- Monthly cashflow
- —
- DSCR
- —
- Eligible?
- —
Personal DTI + credit; lowest rate.
DSCR
20% down · 8.5% · 30yr
- Down + closing
- —
- Monthly P&I
- —
- Monthly cashflow
- —
- DSCR
- —
- Eligible?
- —
No personal income docs; deal must DSCR.
Hard money
10% down · 12.0% · 12mo
- Down + closing
- —
- Monthly P&I
- —
- Monthly cashflow
- —
- DSCR
- —
- Eligible?
- —
Short-term bridge; refi at stabilization.
HOA detail
- Monthly dues
- $292 · $3,504/yr
- Likely covers
- watercablepool
Listing history 33 events
-
2026-06-18days on market $167,500 Active 227 DOM
-
2026-06-17days on market $167,500 Active 226 DOM
-
2026-06-16days on market $167,500 Active 225 DOM
-
2026-06-15days on market $167,500 Active 224 DOM
-
2026-06-14days on market $167,500 Active 222 DOM
-
2026-06-13days on market $167,500 Active 221 DOM
-
2026-06-10days on market $167,500 Active 219 DOM
-
2026-06-09days on market $167,500 Active 218 DOM
-
2026-06-08days on market $167,500 Active 217 DOM
-
2026-06-07days on market $167,500 Active 216 DOM
-
2026-06-05days on market $167,500 Active 213 DOM
-
2026-06-03days on market $167,500 Active 212 DOM
-
2026-06-02days on market $167,500 Active 211 DOM
-
2026-06-01days on market $167,500 Active 210 DOM
-
2026-05-31days on market $167,500 Active 209 DOM
-
2026-05-30days on market $167,500 Active 208 DOM
-
2026-05-22price $167,500
-
2026-05-06status Active
-
2026-04-24historical
-
2026-04-09price $172,500
-
2026-01-30price $177,500
-
2025-10-22$187,500 Active
-
2025-08-04price $1,850
-
2025-07-28$1,950
-
2025-07-26historical $1,950
-
2025-04-17$1,950
-
2024-11-13soldstatus $160,000
-
2022-04-12soldstatus $185,000
-
2018-04-25soldstatus $65,000
-
2003-03-14soldstatus $45,000
-
2001-09-27soldstatus $30,000
-
2001-07-17historical
-
2000-07-17$35,900
ⓘ Source: listings_history table (triggers on properties + properties_extension) + one-shot
backfill from property_details.listing_events for pre-trigger history.
Tax reassessment forecast FL · Resets to sale price
- Current annual tax
- $2,946 · $246/mo
- Projected year-2 tax
- $2,946 · $246/mo
- Expected delta
- $0/yr ($0/mo · 0.0%)
ⓘ Screening estimate from a state-policy table — verify with the county assessor before closing.
Climate risk First Street
- Flood 9/10 Extreme FEMA zone AE · 99% chance over 30 yrs
- Wildfire 1/10 Low
- Heat 10/10 Extreme 7 d/yr ≥106°F today · 24 d/yr by 30 yrs out
- Wind 10/10 Extreme 99% chance of damaging wind over 30 yrs
- Air quality 2/10 Low 1 unhealthy d/yr today · 2 by 30 yrs out
Nearby sold comps map
Loading sold comps map…
Walkable amenities ~0.75 mi
Loading nearby amenities…
Taxation est. · year 1
- Rental income
- $21,503
- − Mortgage interest
- −$9,383
- − Property taxes
- −$2,946
- − Insurance
- −$5,956
- − Repairs & maintenance
- −$1,720
- − Management
- −$1,720
- − HOA
- −$3,504
- − Depreciation
- −$4,873
- Taxable loss
- −$8,599
- Est. tax savings @ 24.0%
- +$2,064
- After-tax cash flow
- $-3,896/yr
For passive investors: Depreciation is non-cash, so a rental often shows a tax loss while cash-flowing — sheltering income. Rental losses are passive: they offset passive income freely, and up to $25,000/yr can offset ordinary (W-2) income if you actively participate and your MAGI is under $100k (phasing out to $0 by $150k); unused losses carry forward. On sale, claimed depreciation is recaptured at up to 25%, and gains may owe capital-gains tax (a 1031 exchange can defer both). Figures are a year-1 estimate at your 24.0% rate — not tax advice; consult a CPA.
Schools (NCES district)
- District
- St. Lucie
- NCES district ID
- 1201770
- Math proficiency
- 40% ▼ -11.00%
- Reading proficiency
- 48% ▼ -4.00%
- Median HH income
- $44,737
- Composite
- 37.28/100
- National rank
- #4449
- State rank
- #51 of 73 in FL
Livability — Hutchinson Island South
- Score
- 61/100
- State rank
- #783
- US rank
- #17768
Category grades
Schools grade is shown separately in the Schools card above.
Census & demographics
- Census place
- Hutchinson Island South, FL
- County
- Martin County · 165,223 people
- City population
- 23,462
- Metro
- Port St. Lucie, FL
- Population (ZIP)
- 23,462
- Household income
- $70,403
- Rent vs Own
- Severe rent burden
- 946.0
Population outlook (St. Lucie County) Hauer SSP2
- Today (2025)
- 338,016 people
- By 2030
- 355,687 · +5.2%
- By 2040
- 385,521 · +14.1%
- By 2050
- 406,106 · +20.1%
- By 2075
- 441,054 · +30.5%
- By 2100
- 436,885 · +29.2%
Race, ethnicity, and origin ACS 2023
- Neighborhood character
- Predominantly White (85%)
- Race & ethnicity
- White 85% Hispanic / Latino 7% Two or more races 6% Asian 2% Black 2%
- Hispanic origin (detail)
- Mexican 1% Puerto Rican 2% Cuban 1%
- Common ancestry
- Romanian 4% Slovak 3% Lithuanian 3%
- Foreign-born
- 10% · Canada, Jamaica
- Languages at home
- 90% English-only · Spanish 5% Other Indo-European 2% Tagalog/Filipino 1%
Political lean MEDSL · St. Lucie
- 2024 margin
- Lean R (+9.1) · D 45.1% · R 54.2%
- 2008→2024 swing
- -21.2pp toward R · 2008: 12.1pp · 2024: -9.1pp
- All cycles
- 2024: R+9.1 2020: R+1.6 2016: R+2.5 2012: D+7.9 2008: D+12.1
Not yet ingested
- Civics
- —
Market trends
- HPI YoY
- ▼ -319.66%
- Current HPI
- 340.0172
- Rent YoY
- ▲ 1.00%
- Metro
- Port St. Lucie, FL
- State GDP YoY
- ▲ 3.28%
- F500 in state
- 36
Industry mix (Fortune 500 HQ in FL)
| Industry | F500 HQs | Revenue |
|---|---|---|
| Industrial Technology | 2 | $29B |
|
||
| Insurance | 2 | $17B |
|
||
| Retail | 1 | $60B |
|
||
| Technology Distribution | 1 | $58B |
|
||
| Homebuilding | 1 | $35B |
|
||
| Technology Manufacturing | 1 | $35B |
|
||
Price history
+366.6% since first listed17 events — show timeline
- 2026-05-22 Price Changed $167,500 MCRTC
- 2026-05-06 Relisted — MCRTC
- 2026-04-24 Listing Removed — MCRTC
- 2026-04-09 Price Changed $172,500 MCRTC
- 2026-01-30 Price Changed $177,500 MCRTC
- 2025-10-22 Listed $187,500 MCRTC
- 2025-08-04 Price Changed $1,850 REDFIN
- 2025-07-28 Listed for Rent $1,950 REDFIN
- 2025-07-26 Rental Removed $1,950 GFLMLS
- 2025-04-17 Listed for Rent $1,950 GFLMLS
- 2024-11-13 Sold (Public Records) $160,000 Public Records
- 2022-04-12 Sold (Public Records) $185,000 Public Records
- 2018-04-25 Sold (Public Records) $65,000 Public Records
- 2003-03-14 Sold (Public Records) $45,000 Public Records
- 2001-09-27 Sold (Public Records) $30,000 Public Records
- 2001-07-17 Listing Removed — MCRTC
- 2000-07-17 Listed $35,900 MCRTC
Property tax history
+11.9%/yrLatest (2025): $2,946 · +2.2% YoY. Source: county tax records.
Cash-flow waterfall
monthlySold comps — $/sqft
last 12 mo · ≤1 miLoading sold comps…