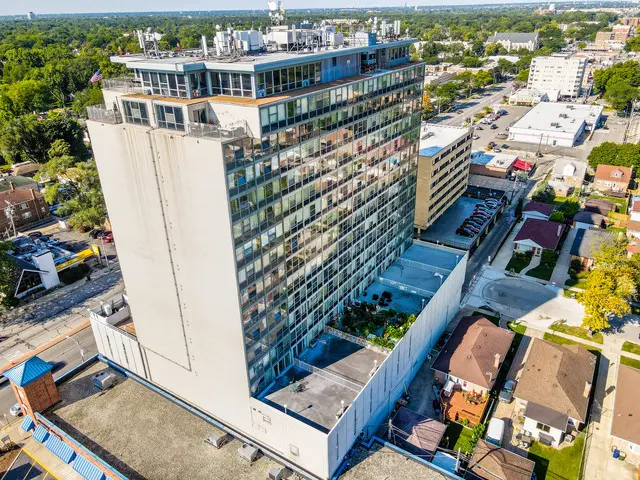
7234 W North Ave #1902 · Elmwood Park, IL
Flood risk 6/10 · Moderate
- FEMA flood zone
- X (unshaded)
- Chance of flooding over 30 yrs
- 0.72%
- Est. flood insurance / yr
- $507 – $1,088
Fire risk 1/10 · Minimal
- Est. fire insurance / yr
- $804 – $1,492
Heat risk 3/10 · Minor
- Hot days now (above 100°F)
- 7 days/yr
- Hot days in 30 yrs
- 14 days/yr
Wind risk 2/10 · Minimal
- Chance of severe wind over 30 yrs
- 0.0%
Air-quality risk 5/10 · Moderate
- Unhealthy air days now
- 6 days/yr
- Unhealthy air days in 30 yrs
- 8 days/yr
Risk factors via First Street. Map © Google.
Why this score? — see what drove the B grade
The composite is a weighted blend of 9 inputs, each scored 0–100. Each bar is that input's sub-score; the figure is the points it added to the 100-point composite (weight × sub-score).
- Cash flow +30.0/30.0
- 1% rule +10.0/10.0
- DSCR +10.0/10.0
- ARV discount +7.5/15.0
- Rent growth +4.3/5.0
- Livability +4.2/5.0
- Condition / age +3.8/5.0
- Schools +1.9/10.0
- Appreciation +0.0/10.0
$65,000
🖨 Deal sheet 📄 Offer letter ✓ Due diligence
Listing remarks
Located just west of North and Harlem Avenue intersection in Elmwood Park, and steps to the New Rush hospital campus! This is an ideal location! A unique combined two unit commercial, flex or residential deconstructed space. Cameo Towers has 178 residential units, and 20 commercial units. This is the perfect opportunity design your custom office space, flex space or condo living unit. The spaces, unit 1902 and 1905 are situated on the Penthouse 19th floor. Building offers large panoramic party room, outdoor swimming pool, sun deck, and indoor parking space. Nearby retailers include Walgreens, Panera Bread, CVS, several restaurants and more. HOA includes special assessment that seller i
Key facts
- Indoor parking space
- Penthouse 19th floor
- Sun deck
Tags
Property features AI
Finance
- Other: Parcel number 12364300411211
- Financial info: Special service area: No
- HOA & community: Monthly association fee of $430 that includes water; Manager off-site; Pets allowed (cats and dogs), maximum pet weight 30 lbs
Exterior
- Parking: Attached garage with garage door opener (1 garage space, 1 total parking)
- Utilities: Lake Michigan water source; Shared septic sewer
- Home design: Attached single condo; Entry at level 19
- Construction: Brick construction; Rubber roof; Built 51–60 years ago; Built before 1978
- Exterior features: Common lot/grounds; Commuter bus access
Interior
- Kitchen: Kitchen (16 x 16)
- Bedrooms: 2 bedrooms
- Heating & cooling: Natural gas heating; Wall air conditioning units
- Interior features: Four main rooms
- Laundry & utility: Laundry room
Neighborhood map
What this means for you Summary
Snapshot
- This is a 2-bed/?-bath condo listed at $65k. Condition is rated good.
Deal economics
- At list price, monthly cash flow is $567 ($7k/yr) — positive.
- The deal already cash-flows at list — no discount required.
- Meets the 1% rule at list price ($2k rent vs $65k).
- Recommended offer: $57k (12.0% below list) — sets the bar for market timing.
- Cap rate 16.8% vs local median 4.4% in Elmwood Park — top-decile yield for the area; either an underpriced asset or a hidden risk that comps aren't pricing in. Stress-test before assuming the spread holds.
Location & tenants
- Location reads 83/100 on livability (#41 in IL, #865 nationally) — a professional / high-income tenant draw. Strengths: commute A+, housing A+, crime A-; Watch: schools D+.
- Elmwood Park CUSD 401 (suburban): math 15% / reading 26% proficiency, ranked #403 of 620 in IL (top 65%) — low school quality limits family demand, transient renter base, plan for 1-2y turnover.
- Market conditions: Rents rising fast (+7.2%/yr); 58 active listings in the ZIP; 16 comparable units currently listed for rent nearby; rentals at typical pace (median 19d on market — plan ~3-4 weeks tenant-placement turnaround); solid renter incomes; 6,272 units permitted in Cook County in 2024 (4,658 in 5+ unit buildings).
Forward outlook
- Local home prices are declining (-3.0%/yr); year-one equity from $449 of loan paydown is wiped out by about $2k of value loss. Plan a longer hold.
- At projected returns (-3.0% appreciation + 7.2% rent growth), your $18k cash investment doubles in ~3 years — after that, you're playing with house money.
Negotiation context
- It's been on market 128 days — a 12% lower offer ($57k) is reasonable based on typical stale-listing flexibility.
- 6 sale attempts; this cycle's ask has dropped $15k (19%) from the opening price — seller is motivated, your offer sets the floor, not the list.
Risks & watch-outs
- Watch-outs: HOA is 23% of rent.
- Climate carrying-cost: major flood risk — expect insurance premiums to compound above CPI over the hold.
Questions for the listing agent
- It's been on market 128 days. Have you received any prior offers? Is the seller open to a 12% concession, seller financing, or rate buy-down credit?
- Built in 1975 — when were the roof, HVAC, electrical panel, plumbing, and water heater last replaced?
- What does the HOA fee cover, when was the last increase, and are there any pending special assessments or reserve-fund shortfalls?
- Any open or pending special assessments — roof, HVAC, plumbing, elevator, façade? What's the per-unit balance and payoff schedule, and is the seller paying it off at close or rolling it to the buyer?
- Why hasn't it sold? Are there any deal-killer items the seller is aware of (foundation, flood, title, zoning, code violations)?
- Is there a deadline driving the sale (1031 exchange, divorce, estate, relocation)? That informs how much negotiation room exists.
- Schools are D-rated, which usually means shorter tenancies and higher turnover. Who's the typical renter profile here, and what's been the actual vacancy rate?
- What's the average days-on-market for RENTAL listings here right now (not sales)? A rising rental-DOM trend means longer vacancies and softer asking-rent achievability than the comps imply.
- What's the recent tenant-quality profile in this submarket — average credit score on applications, eviction rate, late-payment / NSF rate, and stable-employment percentage? A property-management company in the area should have these aggregated.
- How much new apartment / multifamily construction is in the pipeline within 1–3 miles? Heavy new supply (>2% of stock underway) typically softens rents 12–24 months out; light construction supports rent growth.
Investment metrics
- 1% rule
- 2.82% ✓
- Cap rate
- 16.76%
- Cash-on-cash
- 37.38%
- DSCR
- 2.66
- GRM
- 3.0
CMA / ARV
No comps found within radius.
Projected returns pro-forma
-3.0% appreciation · 7.21% rent growth · sell at horizon
- IRR
- 40.1%
- Equity multiple
- 2.87×
- Total profit
- $33,950
- Equity at exit
- $9,692
- IRR
- 49.2%
- Equity multiple
- 7.23×
- Total profit
- $113,423
- Equity at exit
- $5,620
Cash invested: $18,200 (down + closing). Projections, not guarantees.
Landlord ↔ Tenant lean methodology
- Overall (STATE)
- 43 Moderately Tenant-Leaning
- State Illinois
- 43 Moderately Tenant-Leaning · D+7
- County
- — inherits STATE
- City
- — inherits STATE
ZIP-level market 60707
- Rents YoY
- 7.2%
- Active inventory
- 58
- Price-to-rent
- 3.0×
Monthly cashflow live
- Estimated rent
- $1,831 high interval (Pro) →
- Mortgage (P&I)
- −$341
- Tax est. 1.5%
- −$81 /mo · $975/yr
- Insurance
- −$27
- HOA
- −$430
- Vacancy / Maint / Mgmt
- −$384
- Net cashflow
- $567
Break-even live
UW: 25.0% down · 7.5% · 30yr · 1.5% tax · 5.0% vac · 8.0% maint · 8.0% mgmt
Financing live
Cash to close
- Down payment
- $16,250
- Closing costs
- $1,950
- Reserves months
- —
- Total cash needed
- —
Loan-product check · same deal, 3 products live
Conventional
25% down · 7.5% · 30yr
- Down + closing
- —
- Monthly P&I
- —
- Monthly cashflow
- —
- DSCR
- —
- Eligible?
- —
Personal DTI + credit; lowest rate.
DSCR
20% down · 8.5% · 30yr
- Down + closing
- —
- Monthly P&I
- —
- Monthly cashflow
- —
- DSCR
- —
- Eligible?
- —
No personal income docs; deal must DSCR.
Hard money
10% down · 12.0% · 12mo
- Down + closing
- —
- Monthly P&I
- —
- Monthly cashflow
- —
- DSCR
- —
- Eligible?
- —
Short-term bridge; refi at stabilization.
Rent comps 16 comps
| Address | Beds | Baths | Sqft | Rent | $/sqft | DOM | Units | Dist |
|---|---|---|---|---|---|---|---|---|
| 7234 W North Ave #508 Elmwood Park, IL | 1.0 | 1.0 | 750 | $1,600 | $2.13 | 7d | 1 | 0.02mi |
| 1619 N Neva Ave Chicago, IL | 1.0–3.0 | 1.0–2.5 | 1654 | $3,226 | $1.95 | 1d | 41 | 0.24mi |
| 2242 73rd Ave Unit GE Elmwood Park, IL | 2.0 | 1.0 | 1000 | $1,600 | $1.60 | 24d | 1 | 0.86mi |
| 2300 N Harlem Ave Elmwood Park, IL | 1.0–2.0 | 1.0–2.0 | 850 | $1,895 | $2.23 | 2d | 11 | 0.90mi |
| 2310 N Harlem Ave Apt 304 Elmwood Park, IL | 2.0 | 1.0 | 950 | $1,750 | $1.84 | 43d | 1 | 0.91mi |
| 2336 N 72nd Ct Elmwood Park, IL | 2.0 | 1.0 | 990 | $1,640 | $1.66 | 24d | 1 | 0.97mi |
| 2412 N 76th Ave Unit 3W Elmwood Park, IL | 2.0 | 1.0 | 700 | $1,600 | $2.29 | 44d | 1 | 1.11mi |
| 2402 N 76th Ct Unit G Elmwood Park, IL | 2.0 | 1.0 | 850 | $1,700 | $2.00 | 7d | 1 | 1.12mi |
| 2112 N Nashville Ave Chicago, IL | 2.0–4.0 | 2.0–3.0 | 1482 | $2,639 | $1.78 | 3d | 15 | 1.18mi |
| 7709 W Marwood Ave Unit 3S Elmwood Park, IL | 2.0 | 1.0 | 750 | $1,995 | $2.66 | 24d | 1 | 1.28mi |
| 2618 73rd Ave Unit 1 Elmwood Park, IL | 3.0 | 1.0 | 900 | $2,100 | $2.33 | 20d | 1 | 1.31mi |
| 2446 N 78th Ct Unit 2R Elmwood Park, IL | 2.0 | 1.0 | 730 | $1,695 | $2.32 | 18d | 1 | 1.33mi |
| 1000 Lake St Oak Park, IL | 2.0 | 1.0–2.0 | 929 | $4,631 | $4.98 | 1d | 32 | 1.44mi |
| 2714 N 74th Ct Unit 1W Elmwood Park, IL | 2.0 | 1.0 | 850 | $1,695 | $1.99 | 18d | 1 | 1.44mi |
| 7901 W Grand Ave Unit 1S Elmwood Park, IL | 1.0 | 1.0 | 700 | $1,250 | $1.79 | 3d | 1 | 1.45mi |
| 100 Forest Pl Oak Park, IL | 1.0–2.0 | 1.0–2.5 | 945 | $5,614 | $5.94 | 4d | 15 | 1.50mi |
HOA detail condo
- Monthly dues
- $430 · $5,160/yr
- Likely covers
- pool
- ⚠ Special-assessment mentions
-
…parking space. Nearby retailers include Walgreens, Panera Bread, CVS, several restaurants and more. HOA includes special assessment that seller i
Listing history 27 events
-
2026-06-18days on market $65,000 Active 128 DOM
-
2026-06-17days on market $65,000 Active 127 DOM
-
2026-06-16days on market $65,000 Active 126 DOM
-
2026-06-16price $65,000 Active 125 DOM
-
2026-06-15days on market $74,900 Active 125 DOM
-
2026-06-13days on market $74,900 Active 123 DOM
-
2026-06-13days on market $74,900 Active 122 DOM
-
2026-06-09days on market $74,900 Active 119 DOM
-
2026-06-08days on market $74,900 Active 118 DOM
-
2026-06-07days on market $74,900 Active 117 DOM
-
2026-06-04days on market $74,900 Active 114 DOM
-
2026-06-03days on market $74,900 Active 113 DOM
-
2026-06-02days on market $74,900 Active 112 DOM
-
2026-06-01days on market $74,900 Active 111 DOM
-
2026-05-31days on market $74,900 Active 110 DOM
-
2026-05-20status Active
-
2026-03-05historical Contingent - Continue to Show
-
2026-02-27price $74,900
-
2026-02-10$79,900 Active
-
2026-02-10historical
-
2025-10-14Active
-
2025-10-14historical
-
2025-09-24status Active
-
2025-08-25historical Contingent - Continue to Show
-
2025-05-27Active
-
2025-05-27historical
-
2025-03-03Active
ⓘ Source: listings_history table (triggers on properties + properties_extension) + one-shot
backfill from property_details.listing_events for pre-trigger history.
Climate risk First Street
- Flood 6/10 Major FEMA zone X (unshaded) · 72% chance over 30 yrs
- Wildfire 1/10 Low
- Heat 3/10 Moderate 7 d/yr ≥100°F today · 14 d/yr by 30 yrs out
- Wind 2/10 Low 0% chance of damaging wind over 30 yrs
- Air quality 5/10 Major 6 unhealthy d/yr today · 8 by 30 yrs out
Nearby sold comps map
Loading sold comps map…
Walkable amenities ~0.75 mi
Loading nearby amenities…
Taxation est. · year 1
- Rental income
- $21,967
- − Mortgage interest
- −$3,641
- − Property taxes
- −$975
- − Insurance
- −$325
- − Repairs & maintenance
- −$1,757
- − Management
- −$1,757
- − HOA
- −$5,160
- − Depreciation
- −$1,891
- Taxable income
- $6,460
- Est. tax owed @ 24.0%
- −$1,550
- After-tax cash flow
- $5,253/yr
For passive investors: Depreciation is non-cash, so a rental often shows a tax loss while cash-flowing — sheltering income. Rental losses are passive: they offset passive income freely, and up to $25,000/yr can offset ordinary (W-2) income if you actively participate and your MAGI is under $100k (phasing out to $0 by $150k); unused losses carry forward. On sale, claimed depreciation is recaptured at up to 25%, and gains may owe capital-gains tax (a 1031 exchange can defer both). Figures are a year-1 estimate at your 24.0% rate — not tax advice; consult a CPA.
Condition & rehab AI · 3 photos
This condo is in good condition with minimal repairs needed. It offers a good investment opportunity with potential for cosmetic upgrades to enhance its resale and rental value.
Value-add opportunities
- Both Painting the exterior — Enhances curb appeal and resale value
- Both Landscaping improvements — Enhances curb appeal and rental value
- Both Interior touch-ups — Enhances interior aesthetics and resale value
Renovation cost estimate screening
Value-add ROI direction
- Both Painting the exterior — Enhances curb appeal and resale value ↑
- Both Landscaping improvements — Enhances curb appeal and rental value ↑
- Both Interior touch-ups — Enhances interior aesthetics and resale value ↑
ⓘ Cost ranges are severity-bucket heuristics (US national rule-of-thumb). Get contractor quotes + a written scope before underwriting a rehab budget.
Schools (NCES district)
- District
- Elmwood Park CUSD 401
- NCES district ID
- 1714100
- Math proficiency
- 15% ▼ -14.00%
- Reading proficiency
- 26% ▼ -14.00%
- Median HH income
- $54,600
- Composite
- 18.73/100
- National rank
- #8879
- State rank
- #403 of 620 in IL
Livability — Elmwood Park
- Score
- 83/100
- State rank
- #41
- US rank
- #865
Category grades
Schools grade is shown separately in the Schools card above.
Census & demographics
- Census place
- Elmwood Park, IL
- County
- Cook County · 4,486,803 people
- City population
- 41,116
- Metro
- Chicago-Naperville-Elgin, IL-IN-WI
- Population (ZIP)
- 41,116
- Household income
- $84,799
- Rent vs Own
- Severe rent burden
- 1195.0
Population outlook (Cook County) Hauer SSP2
- Today (2025)
- 5,347,519 people
- By 2030
- 5,357,703 · +0.2%
- By 2040
- 5,324,924 · -0.4%
- By 2050
- 5,230,762 · -2.2%
- By 2075
- 4,785,735 · -10.5%
- By 2100
- 4,188,836 · -21.7%
Race, ethnicity, and origin ACS 2023
- Neighborhood character
- Diverse neighborhood (Simpson 0.61)
- Race & ethnicity
- White 45% Hispanic / Latino 43% Two or more races 14% Black 7% Asian 3%
- Hispanic origin (detail)
- Mexican 22% Puerto Rican 12% Cuban 1%
- Common ancestry
- Romanian 13% Subsaharan African 2% Scotch-Irish 1%
- Foreign-born
- 25% · Canada, Jamaica, Dominican Republic
- Languages at home
- 54% English-only · Spanish 29% Russian/Polish/Slavic 11% Other Indo-European 3%
Political lean MEDSL · Cook
- 2024 margin
- Solid D (+42.0) · D 70.4% · R 28.4% · Other 1.2%
- 2008→2024 swing
- -11.4pp toward R · 2008: 53.4pp · 2024: 42.0pp
- All cycles
- 2024: D+42.0 2020: D+50.3 2016: D+53.0 2012: D+49.4 2008: D+53.4
Not yet ingested
- Civics
- —
Market trends
- HPI YoY
- ▼ -256.46%
- Current HPI
- 222.8083
- Rent YoY
- ▲ 7.21%
- Metro
- Chicago-Naperville-Elgin, IL-IN-WI
- State GDP YoY
- ▲ 1.59%
- F500 in state
- 60
Industry mix (Fortune 500 HQ in IL)
| Industry | F500 HQs | Revenue |
|---|---|---|
| Insurance | 4 | $201B |
|
||
| Consumer Goods | 4 | $87B |
|
||
| Industrial Machinery | 3 | $64B |
|
||
| Healthcare | 2 | $55B |
|
||
| Retail / Pharmacy | 1 | $148B |
|
||
| Agriculture / Food | 1 | $86B |
|
||
Price history
-6.3% since first listed12 events — show timeline
- 2026-05-20 Relisted — MRED as Distributed by MLS Grid
- 2026-03-05 Contingent — MRED as Distributed by MLS Grid
- 2026-02-27 Price Changed $74,900 MRED as Distributed by MLS Grid
- 2026-02-10 Listing Removed — MRED as Distributed by MLS Grid
- 2026-02-10 Listed $79,900 MRED as Distributed by MLS Grid
- 2025-10-14 Listing Removed — MRED as Distributed by MLS Grid
- 2025-10-14 Listed — MRED as Distributed by MLS Grid
- 2025-09-24 Relisted — MRED as Distributed by MLS Grid
- 2025-08-25 Contingent — MRED as Distributed by MLS Grid
- 2025-05-27 Listing Removed — MRED as Distributed by MLS Grid
- 2025-05-27 Listed — MRED as Distributed by MLS Grid
- 2025-03-03 Listed — MRED as Distributed by MLS Grid
Cash-flow waterfall
monthlySold comps — $/sqft
last 12 mo · ≤1 miLoading sold comps…