 Multi-family
195 Greenbush Rd · Corinna, ME
Flood risk No data
- FEMA flood zone
- —
- Chance of flooding over 30 yrs
- —
- Est. flood insurance / yr
- —
Fire risk No data
- Est. fire insurance / yr
- —
Heat risk No data
- Hot days now (above threshold)
- —
- Hot days in 30 yrs
- —
Wind risk No data
- Chance of severe wind over 30 yrs
- —
Air-quality risk No data
- Unhealthy air days now
- —
- Unhealthy air days in 30 yrs
- —
Risk factors via First Street. Map © Google.
Why this score? — see what drove the C- grade
The composite is a weighted blend of 9 inputs, each scored 0–100. Each bar is that input's sub-score; the figure is the points it added to the 100-point composite (weight × sub-score).
- Cash flow +12.8/30.0
- Appreciation +9.1/10.0
- ARV discount +7.5/15.0
- Schools +6.4/10.0
- DSCR +3.8/10.0
- 1% rule +2.9/10.0
- Rent growth +2.5/5.0
- Livability +2.5/5.0
- Condition / age +2.5/5.0
$340,000
🖨 Deal sheet (PDF) 📄 Offer letter ✓ Due diligence
Multi-family units
County records classify this as Multi-Family (2-4 Unit). Listing-text estimate: 1 unit. estimate disagrees with records
Listing remarks
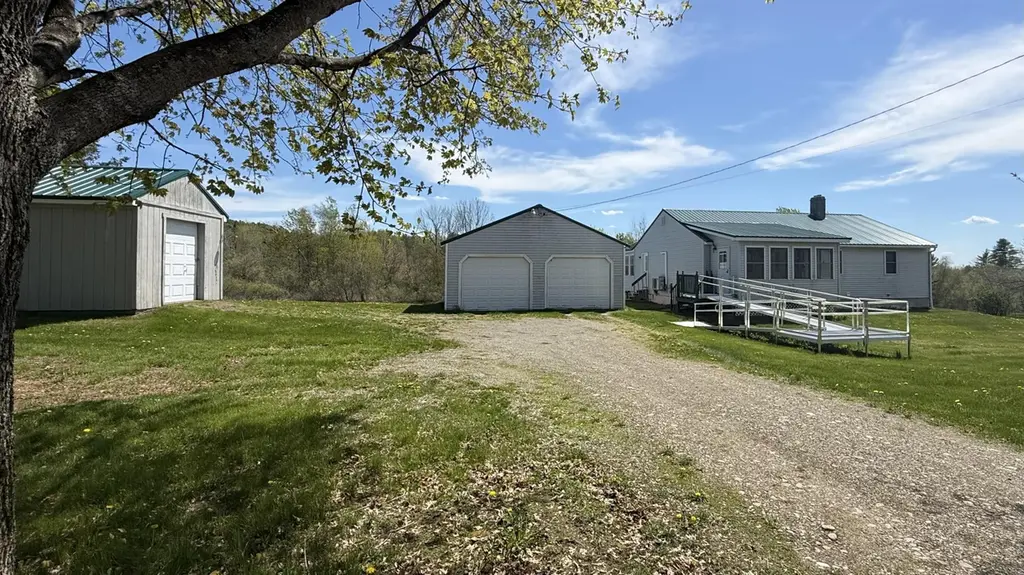
Situated on 15.3± acres, this meticulously well maintained one-level ranch offers the perfect blend of comfort, privacy, and functionality. The property includes two lots being conveyed together, featuring 2.4 open acres with a lush green lawn, and the remaining land is wooded for added recreation. A long driveway lined with beautiful mature trees creates a truly welcoming approach to the home. Inside, you'll find a bright and inviting open-concept kitchen and living area with warm wood floors throughout the main living space. The home offers 2 bedrooms and 2 bathrooms, a laundry room, along with a sunroom and a convenient porch/mudroom area that adds extra living and storage space.
Key facts
- Two lots
- Lush green lawn
- 2.4 open acres
Tags
Property features AI
Finance
- Financial info: Annual tax information available (not included per instructions)
Exterior
- Parking: Detached 2-car garage with auto door opener; Additional on-site gravel parking for 5–10 vehicles
- Security: No specific security features listed
- Utilities: Private well water; Private sewer; Circuit breaker electrical service; Utilities currently on; Water heater tied to heating system
- Home design: Single-family residence; Built in 1993; Facing direction not specified
- Construction: Wood frame with vinyl siding; Metal roof; Full basement with interior entry
- Exterior features: Deck; Porch; Outbuilding; Level, wooded lot; Paved road access
Interior
- Kitchen: Electric range; Dishwasher; Refrigerator
- Bedrooms: Primary bedroom on the first floor; Bedroom 2 on the first floor
- Flooring: Carpet; Tile; Wood
- Bathrooms: 2 full bathrooms
- Heating & cooling: Heat pump (also provides cooling); Baseboard heating; Hot water heating; Wood stove
- Interior features: First-floor primary bedroom with bath; Bathtub; Shower; One-floor living; Double-pane windows; 7 total rooms
- Laundry & utility: Washer and dryer included; Main-level laundry; Interior entry to full basement
Neighborhood map
What this means for you Summary
Snapshot
- This is a 3-bed/2.0-bath multifamily listed at $340k.
Deal economics
- At list price, monthly cash flow is $-34 ($-405/yr) — negative.
- To cash-flow at today's rent, offer at most $334k (1.8% below list).
- To meet the 1% rule (rent ≥ 1% of price), the offer needs to be $267k (21.4% below list).
- Recommended offer: $267k (21.4% below list) — sets the bar for 1% rule.
Location & tenants
- Location reads: area grade C — affects rentability + tenant quality, not the cash-flow math above.
- RSU 19 (rural): math 73% / reading 81% proficiency, ranked #96 of 112 in ME (top 86%) — strong family-tenant draw, lease renewals of 3-5y typical.
- Zoned schools: Nokomis Regional Middle School (math 68% / reading 79%, grade A, #79 of 85 statewide, top 95%, 544 students, 45% FRL); Nokomis Regional High School (math 87% / reading 92%, grade A+, #56 of 108 statewide, top 60%, 634 students, 41% FRL).
- Market conditions: 10 active listings in the ZIP; 440 units permitted in Penobscot County in 2024 (40 in 5+ unit buildings).
Forward outlook
- In year one you build about $30k of equity ($2k loan paydown + $28k appreciation (8.3% local appreciation)).
- Penobscot County population projected at -17% by 2050 — secular population decline; favor cash flow + early exit over multi-decade hold.
- At projected returns (8.3% appreciation + 3.0% rent growth), your $95k cash investment doubles in ~3 years — after that, you're playing with house money.
- By year 2, paydown + projected appreciation supports a ~$49k cash-out refi (75% LTV) — recoverable capital for the next deal without selling this one.
Negotiation context
- Only 8 days on market — expect competitive offers; lowballing is unlikely to land.
Questions for the listing agent
- What do current leases actually rent for vs. the listed asking? Can we see a recent rent roll and the last 12 months of T-12 income?
- Is there a deadline driving the sale (1031 exchange, divorce, estate, relocation)? That informs how much negotiation room exists.
- What's the average days-on-market for RENTAL listings here right now (not sales)? A rising rental-DOM trend means longer vacancies and softer asking-rent achievability than the comps imply.
- What's the recent tenant-quality profile in this submarket — average credit score on applications, eviction rate, late-payment / NSF rate, and stable-employment percentage? A property-management company in the area should have these aggregated.
- How much new apartment / multifamily construction is in the pipeline within 1–3 miles? Heavy new supply (>2% of stock underway) typically softens rents 12–24 months out; light construction supports rent growth.
Investment metrics
- 1% rule
- 0.79% ✗
- Cap rate
- 6.17%
- Cash-on-cash
- -0.43%
- DSCR
- 0.98
- GRM
- 10.6
CMA / ARV
No comps found within radius.
Projected returns pro-forma
8.27% appreciation · 3.0% rent growth · sell at horizon
- IRR
- 20.3%
- Equity multiple
- 2.51×
- Total profit
- $143,751
- Equity at exit
- $264,610
- IRR
- 18.7%
- Equity multiple
- 5.40×
- Total profit
- $418,827
- Equity at exit
- $531,377
Cash invested: $95,200 (down + closing). Projections, not guarantees.
Landlord ↔ Tenant lean methodology
- Overall (STATE)
- 41 Moderately Tenant-Leaning
- State Maine
- 41 Moderately Tenant-Leaning · D+2
- County
- — inherits STATE
- City
- — inherits STATE
ZIP-level market 04928
- Home prices YoY
- 2.8%
- Active inventory
- 10
- Price-to-rent
- 21.2×
Monthly cashflow live
- Estimated rent
- $2,673 medium interval (Pro) →
- Mortgage (P&I)
- −$1,783
- Tax from tax record
- −$221 /mo · $2,649/yr
- Insurance
- −$142
- HOA
- −$0
- Vacancy / Maint / Mgmt
- −$561
- Net cashflow
- $-34
Break-even live
Sensitivity live
| Price | -10% $159 | -5% $62 | +0% $-34 | +5% $-130 | +10% $-226 |
|---|---|---|---|---|---|
| Rent | -10% $-245 | -5% $-139 | +0% $-34 | +5% $72 | +10% $177 |
| Rate | -1.0pp $137 | -0.5pp $53 | base $-34 | +0.5pp $-122 | +1.0pp $-211 |
2-unit breakdown (identical units grouped — click to expand)
| Units | Beds | Baths | Est. rent |
|---|---|---|---|
| 2× units | 2 | 2 | $2,672 |
| #1 | 2 | 2 | $1,336 |
| #2 | 2 | 2 | $1,336 |
| Total (2 units) | $2,673 | ||
UW: 25.0% down · 7.5% · 30yr · 1.5% tax · 5.0% vac · 8.0% maint · 8.0% mgmt
Financing live
Cash to close
- Down payment
- $85,000
- Closing costs
- $10,200
- Reserves months
- —
- Total cash needed
- —
Loan-product check · same deal, 3 products live
Conventional
25% down · 7.5% · 30yr
- Down + closing
- —
- Monthly P&I
- —
- Monthly cashflow
- —
- DSCR
- —
- Eligible?
- —
Personal DTI + credit; lowest rate.
DSCR
20% down · 8.5% · 30yr
- Down + closing
- —
- Monthly P&I
- —
- Monthly cashflow
- —
- DSCR
- —
- Eligible?
- —
No personal income docs; deal must DSCR.
Hard money
10% down · 12.0% · 12mo
- Down + closing
- —
- Monthly P&I
- —
- Monthly cashflow
- —
- DSCR
- —
- Eligible?
- —
Short-term bridge; refi at stabilization.
Listing history 1 events
-
2026-05-18$340,000 Active
ⓘ Source: listings_history table (triggers on properties + properties_extension) + one-shot
backfill from property_details.listing_events for pre-trigger history.
Tax reassessment forecast ME · Partial reset (capped growth)
- Current annual tax
- $2,649 · $221/mo
- Projected year-2 tax
- $3,636 · $303/mo
- Expected delta
- +$988/yr (+$82/mo · 37.3%)
ⓘ Screening estimate from a state-policy table — verify with the county assessor before closing.
Nearby sold comps map
Loading sold comps map…
Walkable amenities ~0.75 mi
Loading nearby amenities…
Taxation est. · year 1
- Rental income
- $32,076
- − Mortgage interest
- −$19,045
- − Property taxes
- −$2,649
- − Insurance
- −$1,700
- − Repairs & maintenance
- −$2,566
- − Management
- −$2,566
- − Depreciation
- −$9,891
- Taxable loss
- −$6,341
- Est. tax savings @ 24.0%
- +$1,522
- After-tax cash flow
- $1,117/yr
For passive investors: Depreciation is non-cash, so a rental often shows a tax loss while cash-flowing — sheltering income. Rental losses are passive: they offset passive income freely, and up to $25,000/yr can offset ordinary (W-2) income if you actively participate and your MAGI is under $100k (phasing out to $0 by $150k); unused losses carry forward. On sale, claimed depreciation is recaptured at up to 25%, and gains may owe capital-gains tax (a 1031 exchange can defer both). Figures are a year-1 estimate at your 24.0% rate — not tax advice; consult a CPA.
Schools (NCES district)
- District
- RSU 19
- NCES district ID
- 2314785
- Math proficiency
- 73% ▲ 53.00%
- Reading proficiency
- 81% ▲ 39.00%
- Median HH income
- $41,866
- Composite
- 64.37/100
- National rank
- #548
- State rank
- #96 of 112 in ME
Livability — Corinna
No livability data for this city. (Only ~50 U.S. cities are tracked.)
Census & demographics
- Population (ZIP)
- 2,079
Population outlook (Penobscot County) Hauer SSP2
- Today (2025)
- 149,928 people
- By 2030
- 146,386 · -2.4%
- By 2040
- 135,952 · -9.3%
- By 2050
- 123,864 · -17.4%
- By 2075
- 97,825 · -34.8%
- By 2100
- 77,196 · -48.5%
Race, ethnicity, and origin ACS 2023
- Neighborhood character
- Predominantly White (98%)
- Race & ethnicity
- White 98% Two or more races 2%
- Common ancestry
- Lithuanian 11% Serbian 5% Slovak 3%
- Foreign-born
- 2% · Canada
Political lean MEDSL · Penobscot
- 2024 margin
- R (+10.9) · D 43.6% · R 54.5% · Other 1.9%
- 2008→2024 swing
- -15.9pp toward R · 2008: 5.0pp · 2024: -10.9pp
- All cycles
- 2024: R+10.9 2020: R+8.3 2016: R+10.9 2012: D+2.9 2008: D+5.0
Not yet ingested
- Civics
- —
Market trends
- HPI YoY
- ▲ 8.27%
- Current HPI
- 306.6748
- Rent YoY
- —
- Metro
- —
- State GDP YoY
- —
- F500 in state
- 0
Price history
1 event — show timeline
- 2026-05-18 Listed $340,000 MREIS
Property tax history
+2.1%/yrLatest (2025): $2,649 · +10.3% YoY. Source: county tax records.
Cash-flow waterfall
monthlySold comps — $/sqft
last 12 mo · ≤1 miLoading sold comps…