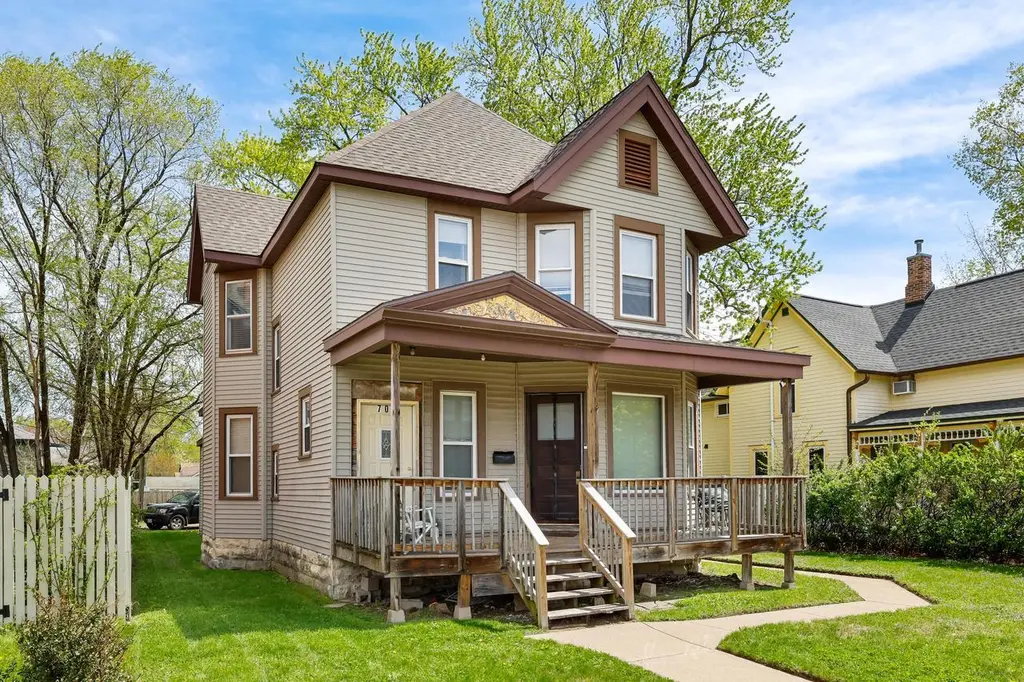
707 West Avenue Ave S #711 · La Crosse, WI
Flood risk 1/10 · Minimal
- FEMA flood zone
- X (unshaded)
- Chance of flooding over 30 yrs
- 0.0%
- Est. flood insurance / yr
- $473 – $860
Fire risk 1/10 · Minimal
- Est. fire insurance / yr
- $636 – $1,182
Heat risk 2/10 · Minimal
- Hot days now (above 101°F)
- 7 days/yr
- Hot days in 30 yrs
- 14 days/yr
Wind risk 2/10 · Minimal
- Chance of severe wind over 30 yrs
- —
Air-quality risk 1/10 · Minimal
- Unhealthy air days now
- 0 days/yr
- Unhealthy air days in 30 yrs
- 0 days/yr
Risk factors via First Street. Map © Google.
Why this score? — see what drove the F grade
The composite is a weighted blend of 9 inputs, each scored 0–100. Each bar is that input's sub-score; the figure is the points it added to the 100-point composite (weight × sub-score).
- ARV discount +7.5/15.0
- Condition / age +4.0/5.0
- Livability +3.5/5.0
- Rent growth +3.2/5.0
- Schools +2.7/10.0
- Cash flow +0.7/30.0
- 1% rule +0.0/10.0
- DSCR +0.0/10.0
- Appreciation +0.0/10.0
$349,900
🖨 Deal sheet (PDF) 📄 Offer letter ✓ Due diligence
Listing remarks
New Investment Opportunity! Triplex in a great location on West Ave near universities with strong rental demand and consistent income. Features three units: a 2-bedroom renting at $950/month, a 1-bedroom at $900/month, and a 3-bedroom at $1,300/month. Coin-operated laundry and 6 off street parking spaces. Ideal for investors looking to expand their portfolio in a high-demand area with long-term upside and steady occupancy.
Key facts
- Triplex
- High-demand area
- 8,276 sq ft lot
Tags
Property features AI
Finance
- Other: Includes 3 refrigerators and 3 stoves; Includes coin-operated laundry; Excludes seller and tenant personal property
- Financial info: 3-unit building
Exterior
- Parking: Outside parking; Inside parking; Outdoor space
- Utilities: Municipal water; Municipal sewer; Power (standard)
- Home design: Multi-family property (Duplex+); 1–2 stories
- Construction: Assessor/public record year built
- Exterior features: Vinyl exterior; Lot under 1/2 acre (approximately 0.19 acre); Residential zoning
Interior
- Kitchen: 3 stoves; 3 refrigerators
- Heating & cooling: Hot water/steam heating
- Interior features: Full basement; Coin-operated laundry
- Laundry & utility: Washer (seller owned); Dryer (seller owned); Coin-operated laundry; Water heater (seller owned)
Neighborhood map
What this means for you Summary
Snapshot
- This is a condo listed at $350k. Condition is rated good.
Deal economics
- At list price, monthly cash flow is $-1k ($-18k/yr) — negative.
- To cash-flow at today's rent, offer at most $134k (61.6% below list).
- To meet the 1% rule (rent ≥ 1% of price), the offer needs to be $117k (66.4% below list).
- Recommended offer: $117k (66.4% below list) — sets the bar for 1% rule.
- Cap rate 1.2% vs local median 3.1% in La Crosse — below-typical yield; the buyer is paying a premium for something (appreciation thesis, condition, location) that the cap rate doesn't capture.
Location & tenants
- Location reads 69/100 on livability (#339 in WI) — a middle-class / working-renter tenant base. Strengths: cost of living A+, housing A+; Watch: employment C-, health & safety D, crime F.
- La Crosse School District (urban): math 29% / reading 34% proficiency, ranked #267 of 342 in WI (top 78%) — families likely to look elsewhere, expect single-tenant / working-renter base with shorter leases.
- Zoned schools: Emerson Elementary (math 42% / reading 37%, grade F, #490 of 1,041 statewide, top 53%, 311 students, 31% FRL); Lincoln Middle (math 34% / reading 41%, grade F, #172 of 383 statewide, top 45%, 277 students, 41% FRL); Central High (math 26% / reading 36%, grade F, #204 of 483 statewide, top 43%, 1,008 students, 38% FRL) — zoned schools at 37% FRL track the district average.
- Market conditions: Rents rising (+2.7%/yr); 224 active listings in the ZIP; 11 comparable units currently listed for rent nearby; rentals lingering (median 46d on market — plan ~5-8 weeks vacancy on turnover, expect pricing pressure); 100% of comp listings sitting > 30 days — soft ceiling on asking rent; 268 units permitted in La Crosse County in 2024 (10 in 5+ unit buildings).
Forward outlook
- Local home prices are declining (-3.0%/yr); year-one equity from $2k of loan paydown is wiped out by about $10k of value loss. Plan a longer hold.
- La Crosse County population projected at +14% by 2050 — modest demand growth; plan on rents tracking national, not racing it.
Negotiation context
- Only 9 days on market — expect competitive offers; lowballing is unlikely to land.
Risks & watch-outs
- Watch-outs: built in 1920 — expect roof / HVAC / electrical / plumbing capex.
Questions for the listing agent
- What do current leases actually rent for vs. the listed asking? Can we see a recent rent roll and the last 12 months of T-12 income?
- Built in 1920 — when were the roof, HVAC, electrical panel, plumbing, and water heater last replaced?
- Any open or pending special assessments — roof, HVAC, plumbing, elevator, façade? What's the per-unit balance and payoff schedule, and is the seller paying it off at close or rolling it to the buyer?
- Is there a deadline driving the sale (1031 exchange, divorce, estate, relocation)? That informs how much negotiation room exists.
- Schools are D-rated, which usually means shorter tenancies and higher turnover. Who's the typical renter profile here, and what's been the actual vacancy rate?
- Crime grade is F in this area — have there been break-ins, vandalism, or insurance claims at this property in the last 3 years? What carrier currently insures it and at what premium?
- The area grade is low — what's the realistic commute time and amenity access for the typical tenant pool here? Any planned neighborhood developments (good or bad) we should know about?
- What's the average days-on-market for RENTAL listings here right now (not sales)? A rising rental-DOM trend means longer vacancies and softer asking-rent achievability than the comps imply.
- What's the recent tenant-quality profile in this submarket — average credit score on applications, eviction rate, late-payment / NSF rate, and stable-employment percentage? A property-management company in the area should have these aggregated.
- How much new apartment / multifamily construction is in the pipeline within 1–3 miles? Heavy new supply (>2% of stock underway) typically softens rents 12–24 months out; light construction supports rent growth.
Investment metrics
- 1% rule
- 0.34% ✗
- Cap rate
- 1.18%
- Cash-on-cash
- -18.25%
- DSCR
- 0.19
- GRM
- 24.8
CMA / ARV
- ARV (median comp)
- $228,600
- List price
- $349,900
- Delta
- 53.06%
- Verdict
- OVERPRICED
- Comps
- 1 within 2.0 mi
Show comp detail 6 sales within ~0.75 mi
| Address | Dist | Beds/Ba | Sqft | Sold | Price | $/sf | Match |
|---|---|---|---|---|---|---|---|
| 613 17th Street St S #615 | 0.41mi | 3/2.0 | 1,526 | 1mo | $228,600 | $150 | 67 |
| 1017 8th Street St S Unit 1015-1021 | 0.41mi | —/— | — | 5mo | $350,000 | — | 65 |
| 1009 7th Street St S Unit 1007, 1011 | 0.45mi | —/— | — | 4mo | $335,000 | — | 63 |
| 717 Jackson St #719 | 0.42mi | 4/2.0 | 1,690 | 14mo | $125,000 | $74 | 56 |
| 139 9th Street South St #137 | 0.49mi | —/— | — | 16mo | $361,000 | — | 52 |
| 946 Adams St #944 | 0.39mi | 4/2.0 | 1,457 | 24mo | $195,000 | $134 | 49 |
Match score weights: distance 35% · size 25% · config 20% · recency 20%. Top-matched comps best support the ARV.
Projected returns pro-forma
-3.0% appreciation · 2.72% rent growth · sell at horizon
- IRR
- -53.4%
- Equity multiple
- -0.55×
- Total profit
- $-151,919
- Equity at exit
- $52,171
- IRR
- —
- Equity multiple
- -1.61×
- Total profit
- $-255,773
- Equity at exit
- $30,253
Cash invested: $97,972 (down + closing). Projections, not guarantees.
Landlord ↔ Tenant lean methodology
- Overall (STATE)
- 73 Landlord-Friendly
- State Wisconsin
- 73 Landlord-Friendly · R+2
- County
- — inherits STATE
- City
- — inherits STATE
ZIP-level market 54601
- Rents YoY
- 2.7%
- Active inventory
- 224
- Price-to-rent
- 24.8×
Monthly cashflow live
- Estimated rent
- $1,175 high interval (Pro) →
- Mortgage (P&I)
- −$1,835
- Tax est. 1.5%
- −$437 /mo · $5,248/yr
- Insurance
- −$146
- HOA
- −$0
- Vacancy / Maint / Mgmt
- −$247
- Net cashflow
- $-1,490
Break-even live
Sensitivity live
| Price | -10% $-1,248 | -5% $-1,369 | +0% $-1,490 | +5% $-1,611 | +10% $-1,732 |
|---|---|---|---|---|---|
| Rent | -10% $-1,583 | -5% $-1,537 | +0% $-1,490 | +5% $-1,444 | +10% $-1,397 |
| Rate | -1.0pp $-1,314 | -0.5pp $-1,401 | base $-1,490 | +0.5pp $-1,581 | +1.0pp $-1,673 |
UW: 25.0% down · 7.5% · 30yr · 1.5% tax · 5.0% vac · 8.0% maint · 8.0% mgmt
Financing live
Cash to close
- Down payment
- $87,475
- Closing costs
- $10,497
- Reserves months
- —
- Total cash needed
- —
Loan-product check · same deal, 3 products live
Conventional
25% down · 7.5% · 30yr
- Down + closing
- —
- Monthly P&I
- —
- Monthly cashflow
- —
- DSCR
- —
- Eligible?
- —
Personal DTI + credit; lowest rate.
DSCR
20% down · 8.5% · 30yr
- Down + closing
- —
- Monthly P&I
- —
- Monthly cashflow
- —
- DSCR
- —
- Eligible?
- —
No personal income docs; deal must DSCR.
Hard money
10% down · 12.0% · 12mo
- Down + closing
- —
- Monthly P&I
- —
- Monthly cashflow
- —
- DSCR
- —
- Eligible?
- —
Short-term bridge; refi at stabilization.
Rent comps 11 comps
| Address | Beds | Baths | Sqft | Rent | $/sqft | DOM | Units | Dist |
|---|---|---|---|---|---|---|---|---|
| 1001 Johnson St Unit 1001 La Crosse, WI | 2.0 | 1.0 | — | $1,250 | — | 45d | 1 | 0.28mi |
| 616 9th St S #1 La Crosse, WI | 2.0 | 1.0 | 1000 | $1,100 | $1.10 | 45d | 1 | 0.31mi |
| 816 Cass St Apt 103 La Crosse, WI | 1.0 | 1.0 | 538 | $895 | $1.66 | 45d | 1 | 0.43mi |
| 520 7th St S Unit 5 La Crosse, WI | 3.0 | 1.0 | — | $1,195 | — | 45d | 1 | 0.46mi |
| 1418 10th St S La Crosse, WI | 3.0 | 1.0 | — | $1,200 | — | 45d | 1 | 0.50mi |
| 312 6th St S Unit 318 La Crosse, WI | 3.0 | 2.0 | — | $1,310 | — | 45d | 1 | 0.58mi |
| 1442 Redfield St La Crosse, WI | 3.0 | 1.0 | 1000 | $1,100 | $1.10 | 45d | 1 | 0.67mi |
| 1130 Vine St La Crosse, WI | 1.0 | 1.0 | 445 | $832 | $1.87 | 45d | 1 | 0.67mi |
| 1707 Main St La Crosse, WI | 3.0 | 1.0 | — | $1,690 | — | 45d | 1 | 0.71mi |
| 514 10th St N Unit 5 La Crosse, WI | 1.0 | 1.0 | 450 | $1,050 | $2.33 | 45d | 1 | 0.89mi |
| 27 Riverpoint Ct La Crosse, WI | 1.0 | 1.0 | 692 | $1,488 | $2.15 | 45d | 21 | 1.38mi |
HOA detail condo
- Monthly dues
- $0 · $0/yr
- Assessments
- None detected in remarks — confirm with the listing agent.
Listing history 2 events
-
2026-05-10status Pending 426-char remark
-
2026-04-30$349,900 Active 426-char remark
ⓘ Source: listings_history table (triggers on properties + properties_extension) + one-shot
backfill from property_details.listing_events for pre-trigger history.
Climate risk First Street
- Flood 1/10 Low FEMA zone X (unshaded) · 0% chance over 30 yrs
- Wildfire 1/10 Low
- Heat 2/10 Low 7 d/yr ≥101°F today · 14 d/yr by 30 yrs out
- Wind 2/10 Low
- Air quality 1/10 Low 0 unhealthy d/yr today · 0 by 30 yrs out
Nearby sold comps map
Loading sold comps map…
Walkable amenities ~0.75 mi
Loading nearby amenities…
Taxation est. · year 1
- Rental income
- $14,095
- − Mortgage interest
- −$19,600
- − Property taxes
- −$5,248
- − Insurance
- −$1,750
- − Repairs & maintenance
- −$1,128
- − Management
- −$1,128
- − Depreciation
- −$10,179
- Taxable loss
- −$24,937
- Est. tax savings @ 24.0%
- +$5,985
- After-tax cash flow
- $-11,897/yr
For passive investors: Depreciation is non-cash, so a rental often shows a tax loss while cash-flowing — sheltering income. Rental losses are passive: they offset passive income freely, and up to $25,000/yr can offset ordinary (W-2) income if you actively participate and your MAGI is under $100k (phasing out to $0 by $150k); unused losses carry forward. On sale, claimed depreciation is recaptured at up to 25%, and gains may owe capital-gains tax (a 1031 exchange can defer both). Figures are a year-1 estimate at your 24.0% rate — not tax advice; consult a CPA.
Condition & rehab AI · 1 photo
This triplex is in good condition with minimal cosmetic improvements needed. It offers a great investment opportunity in a high-demand area with strong rental demand.
Value-add opportunities
- Both Painting exterior and interior — Fresh paint enhances curb appeal and interior aesthetics
- Both Landscaping improvements — Enhances curb appeal and can attract more tenants
- Both Upgrade lighting fixtures — Improves curb appeal and can make the property more attractive to potential tenants
Renovation cost estimate screening
Value-add ROI direction
- Both Painting exterior and interior — Fresh paint enhances curb appeal and interior aesthetics ↑
- Both Landscaping improvements — Enhances curb appeal and can attract more tenants ↑
- Both Upgrade lighting fixtures — Improves curb appeal and can make the property more attractive to potential tenants ↑
ⓘ Cost ranges are severity-bucket heuristics (US national rule-of-thumb). Get contractor quotes + a written scope before underwriting a rehab budget.
Schools (NCES district)
- District
- La Crosse School District
- NCES district ID
- 5507530
- Math proficiency
- 29% ▼ -8.00%
- Reading proficiency
- 34% ▼ -4.00%
- Median HH income
- $42,924
- Composite
- 26.76/100
- National rank
- #7135
- State rank
- #267 of 342 in WI
Livability — La Crosse
- Score
- 69/100
- State rank
- #339
- US rank
- #8671
Category grades
Schools grade is shown separately in the Schools card above.
Census & demographics
- Census place
- La Crosse, WI
- County
- La Crosse County · 89,439 people
- City population
- 64,135
- Metro
- La Crosse-Onalaska, WI-MN
- Population (ZIP)
- 50,397
- Household income
- $61,639
- Rent vs Own
- Severe rent burden
- 2352.0
Population outlook (La Crosse County) Hauer SSP2
- Today (2025)
- 126,082 people
- By 2030
- 130,161 · +3.2%
- By 2040
- 137,231 · +8.8%
- By 2050
- 143,506 · +13.8%
- By 2075
- 160,149 · +27.0%
- By 2100
- 166,408 · +32.0%
Race, ethnicity, and origin ACS 2023
- Neighborhood character
- Predominantly White (89%)
- Race & ethnicity
- White 89% Asian 4% Two or more races 3% Hispanic / Latino 3% Black 1%
- Common ancestry
- Portuguese 14% Romanian 6% Lithuanian 2%
- Foreign-born
- 3% · Canada
- Languages at home
- 95% English-only · Spanish 2% Other Asian/Pacific 1% Other Indo-European 1%
Political lean MEDSL · La Crosse
- 2024 margin
- Lean D (+9.4) · D 54.0% · R 44.6% · Other 1.4%
- 2008→2024 swing
- -14.1pp toward R · 2008: 23.4pp · 2024: 9.4pp
- All cycles
- 2024: D+9.4 2020: D+13.5 2016: D+9.6 2012: D+17.3 2008: D+23.4
Not yet ingested
- Civics
- —
Market trends
- HPI YoY
- ▼ -186.70%
- Current HPI
- 236.4506
- Rent YoY
- ▲ 2.72%
- Metro
- La Crosse-Onalaska, WI-MN
- State GDP YoY
- ▲ 2.10%
- F500 in state
- 20
Industry mix (Fortune 500 HQ in WI)
| Industry | F500 HQs | Revenue |
|---|---|---|
| Industrial Machinery | 4 | $23B |
|
||
| Industrial Technology | 2 | $36B |
|
||
| Insurance | 1 | $36B |
|
||
| Professional Services | 1 | $19B |
|
||
| Utilities | 1 | $9B |
|
||
| Consumer Goods | 1 | $3B |
|
||
Price history
2 events — show timeline
- 2026-05-10 Pending — METROMLS
- 2026-04-30 Listed $349,900 METROMLS
Cash-flow waterfall
monthlySold comps — $/sqft
last 12 mo · ≤1 miLoading sold comps…