 🏗️ New Construction
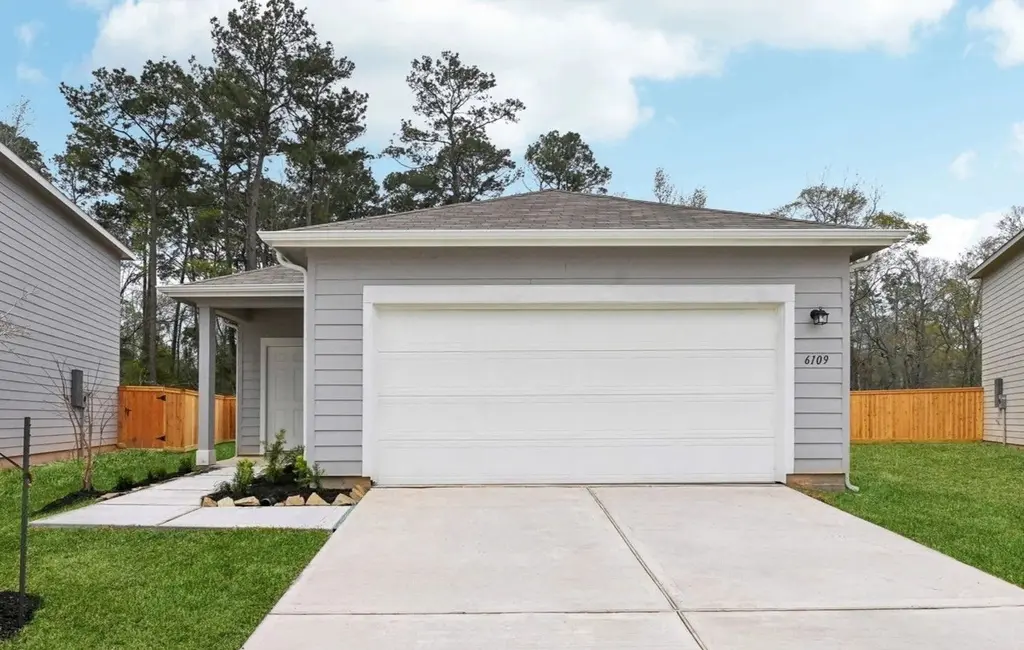
Odyssey Plan · Cut and Shoot, TX
Flood risk 1/10 · Minimal
- FEMA flood zone
- X (unshaded)
- Chance of flooding over 30 yrs
- 0.0%
- Est. flood insurance / yr
- $507 – $1,088
Fire risk 6/10 · Moderate
- Est. fire insurance / yr
- $1,222 – $2,270
Heat risk 8/10 · Major
- Hot days now (above 111°F)
- 7 days/yr
- Hot days in 30 yrs
- 25 days/yr
Wind risk 9/10 · Severe
- Chance of severe wind over 30 yrs
- 99.0%
Air-quality risk 2/10 · Minimal
- Unhealthy air days now
- 1 days/yr
- Unhealthy air days in 30 yrs
- 1 days/yr
Risk factors via First Street. Map © Google.
Why this score? — see what drove the D grade
The composite is a weighted blend of 9 inputs, each scored 0–100. Each bar is that input's sub-score; the figure is the points it added to the 100-point composite (weight × sub-score).
- Cash flow +11.8/30.0
- ARV discount +7.5/15.0
- Schools +5.1/10.0
- Condition / age +4.0/5.0
- DSCR +3.5/10.0
- 1% rule +3.4/10.0
- Livability +2.8/5.0
- Rent growth +2.4/5.0
- Appreciation +0.0/10.0
$233,990
🖨 Deal sheet (PDF) 📄 Offer letter ✓ Due diligence
Listing remarks MLS
You enter the home and are immediately welcomed into the open family room, kitchen, and dining area-designed for comfortable, connected living. Just off the family room, you'll find access to the two-car garage, a laundry room, and two secondary bedrooms that share a full bath. From the dining area, a covered patio offers space to relax outdoors. Also off the dining space is the primary bedroom, complete with a walk-in closet and a private primary bath.
Key facts
- Private primary bath
- Walk-in closet
- Open family room
Tags
Neighborhood map
What this means for you Summary
Snapshot
- This is a 3-bed/2.0-bath single-family listed at $234k. Condition is rated good.
Deal economics
- At list price, monthly cash flow is $-66 ($-795/yr) — negative.
- To cash-flow at today's rent, offer at most $228k (2.6% below list).
- To meet the 1% rule (rent ≥ 1% of price), the offer needs to be $199k (14.8% below list).
- Recommended offer: $199k (14.8% below list) — sets the bar for 1% rule.
- Cap rate 6.0% vs local median 4.9% in Cut and Shoot — meaningfully above typical; check what's discounted (condition, days-on-market, listing class) to confirm the premium yield is real.
Location & tenants
- Location reads 56/100 on livability (#1,326 in TX) — a working-class tenant base; expect higher turnover. Strengths: cost of living A+, housing A+; Watch: crime D-, amenities F, commute F.
- Conroe ISD (other): math 57% / reading 57% proficiency, ranked #69 of 826 in TX (top 8%) — acceptable for families but not a draw, mixed tenant base, ~2y average lease.
- Zoned schools: Austin El (math 39% / reading 29%, grade F, #2,149 of 4,322 statewide, top 50%, 950 students, 81% FRL); Moorhead J H (math 35% / reading 42%, grade F, #704 of 1,662 statewide, top 43%, 1,391 students, 82% FRL); Conroe H S (math 32% / reading 51%, grade F, #767 of 1,632 statewide, top 47%, 4,915 students, 61% FRL) — zoned schools average 75% FRL vs 34% district-wide (40 pts higher); higher-poverty schools than district average — tighter screening recommended.
- Zoned-school proficiency averages 38% at this address vs 57% district-wide (-19 pts) — the specific schools serving this property underperform the Conroe ISD average; the district grade overstates school quality for this exact location.
- Market conditions: Rents soft (-0.3%/yr); 721 active listings in the ZIP; 2 comparable units currently listed for rent nearby; solid renter incomes; 13,259 units permitted in Montgomery County in 2024 (1,402 in 5+ unit buildings).
- This rent runs 32% of the median local income ($75k/yr) — at the standard rent-burdened threshold; future hikes will face affordability resistance.
Forward outlook
- Local home prices are declining (-3.0%/yr); year-one equity from $2k of loan paydown is wiped out by about $7k of value loss. Plan a longer hold.
- Montgomery County population projected at +65% by 2050 — long-run rental-demand tailwind backs the buy-and-hold thesis.
Negotiation context
- It's been on market 89 days — a 6% lower offer ($220k) is reasonable based on typical stale-listing flexibility.
Risks & watch-outs
- Climate carrying-cost: severe wind risk, 99% chance of damaging wind over 30y; major wildfire risk; extreme-heat days projected 7→25/yr by 2055 (HVAC capex compounding) — expect insurance premiums to compound above CPI over the hold.
Questions for the listing agent
- What do current leases actually rent for vs. the listed asking? Can we see a recent rent roll and the last 12 months of T-12 income?
- It's been on market 89 days. Have you received any prior offers? Is the seller open to a 15% concession, seller financing, or rate buy-down credit?
- Why hasn't it sold? Are there any deal-killer items the seller is aware of (foundation, flood, title, zoning, code violations)?
- Is there a deadline driving the sale (1031 exchange, divorce, estate, relocation)? That informs how much negotiation room exists.
- Schools are F-rated, which usually means shorter tenancies and higher turnover. Who's the typical renter profile here, and what's been the actual vacancy rate?
- Crime grade is D in this area — have there been break-ins, vandalism, or insurance claims at this property in the last 3 years? What carrier currently insures it and at what premium?
- The area grade is low — what's the realistic commute time and amenity access for the typical tenant pool here? Any planned neighborhood developments (good or bad) we should know about?
- What's the average days-on-market for RENTAL listings here right now (not sales)? A rising rental-DOM trend means longer vacancies and softer asking-rent achievability than the comps imply.
- What's the recent tenant-quality profile in this submarket — average credit score on applications, eviction rate, late-payment / NSF rate, and stable-employment percentage? A property-management company in the area should have these aggregated.
- How much new for-sale + rental construction is in the pipeline within 1–3 miles? Heavy new supply typically softens prices + rents 12–24 months out; constrained supply supports both.
Investment metrics
- 1% rule
- 0.84% ✗
- Cap rate
- 5.96%
- Cash-on-cash
- -1.20%
- DSCR
- 0.95
- GRM
- 9.9
CMA / ARV
- ARV (median comp)
- $237,425
- List price
- $233,990
- Delta
- -1.45%
- Verdict
- FAIR
- Comps
- 14 within 1.0 mi
Show comp detail 2 sales within ~0.75 mi
| Address | Dist | Beds/Ba | Sqft | Sold | Price | $/sf | Match |
|---|---|---|---|---|---|---|---|
| 15435 Glinton Farm Ln | 0.06mi | 3/2.0 | 1,412 (0%) | 1mo | $244,500 | $173 | 96 |
| 5623 Shelford Birch Dr | 0.13mi | 3/2.0 | 1,412 (0%) | 1mo | $241,500 | $171 | 93 |
Match score weights: distance 35% · size 25% · config 20% · recency 20%. Top-matched comps best support the ARV.
Projected returns pro-forma
-3.0% appreciation · 0.0% rent growth · sell at horizon
- IRR
- -21.7%
- Equity multiple
- 0.27×
- Total profit
- $-48,504
- Equity at exit
- $35,401
- IRR
- -24.9%
- Equity multiple
- -0.05×
- Total profit
- $-70,122
- Equity at exit
- $20,528
Cash invested: $66,479 (down + closing). Projections, not guarantees.
Landlord ↔ Tenant lean methodology
- Overall (STATE)
- 87 Strongly Landlord-Friendly
- State Texas
- 87 Strongly Landlord-Friendly · R+5
- County
- — inherits STATE
- City
- — inherits STATE
ZIP-level market 77303
- Home prices YoY
- -22.4%
- Rents YoY
- -0.3%
- Active inventory
- 721
- Price-to-rent
- 9.8×
Monthly cashflow live
- Estimated rent
- $1,993 medium interval (Pro) →
- Mortgage (P&I)
- −$1,245
- Tax est. 1.5%
- −$297 /mo · $3,561/yr
- Insurance
- −$99
- HOA
- −$0
- Vacancy / Maint / Mgmt
- −$419
- Net cashflow
- $-66
Break-even live
Sensitivity live
| Price | -10% $98 | -5% $16 | +0% $-66 | +5% $-148 | +10% $-230 |
|---|---|---|---|---|---|
| Rent | -10% $-224 | -5% $-145 | +0% $-66 | +5% $12 | +10% $91 |
| Rate | -1.0pp $53 | -0.5pp $-6 | base $-66 | +0.5pp $-128 | +1.0pp $-190 |
UW: 25.0% down · 7.5% · 30yr · 1.5% tax · 5.0% vac · 8.0% maint · 8.0% mgmt
Financing live
Cash to close
- Down payment
- $59,356
- Closing costs
- $7,123
- Reserves months
- —
- Total cash needed
- —
Loan-product check · same deal, 3 products live
Conventional
25% down · 7.5% · 30yr
- Down + closing
- —
- Monthly P&I
- —
- Monthly cashflow
- —
- DSCR
- —
- Eligible?
- —
Personal DTI + credit; lowest rate.
DSCR
20% down · 8.5% · 30yr
- Down + closing
- —
- Monthly P&I
- —
- Monthly cashflow
- —
- DSCR
- —
- Eligible?
- —
No personal income docs; deal must DSCR.
Hard money
10% down · 12.0% · 12mo
- Down + closing
- —
- Monthly P&I
- —
- Monthly cashflow
- —
- DSCR
- —
- Eligible?
- —
Short-term bridge; refi at stabilization.
Rent comps 2 comps
| Address | Beds | Baths | Sqft | Rent | $/sqft | DOM | Units | Dist |
|---|---|---|---|---|---|---|---|---|
| 9248 Laiden Creek Trl Unit 510 Conroe, TX | 3.0 | 2.0 | 1788 | $1,984 | $1.11 | 0d | 1 | 1.45mi |
| 9262 Laiden Creek Trl Conroe, TX | 3.0–4.0 | 2.0–2.5 | 1601 | $1,855 | $1.16 | 0d | 14 | 1.48mi |
Listing history 16 events
-
2026-06-21days on market $233,990 Active 89 DOM
-
2026-06-18days on market $233,990 Active 86 DOM
-
2026-06-17days on market $233,990 Active 85 DOM
-
2026-06-16days on market $233,990 Active 84 DOM
-
2026-06-15days on market $233,990 Active 83 DOM
-
2026-06-13days on market $233,990 Active 81 DOM
-
2026-06-09days on market $233,990 Active 77 DOM
-
2026-06-08days on market $233,990 Active 76 DOM
-
2026-06-07pricedays on market $233,990 Active 75 DOM
-
2026-06-04days on market $234,240 Active 72 DOM
-
2026-06-03pricedays on market $234,240 Active 71 DOM
-
2026-06-02days on market $233,990 Active 70 DOM
-
2026-06-01days on market $233,990 Active 69 DOM
-
2026-05-31days on market $233,990 Active 68 DOM
-
2026-05-05price $233,990 457-char remark
Show marketing remark (457 chars)
You enter the home and are immediately welcomed into the open family room, kitchen, and dining area-designed for comfortable, connected living. Just off the family room, you'll find access to the two-car garage, a laundry room, and two secondary bedrooms that share a full bath. From the dining area, a covered patio offers space to relax outdoors. Also off the dining space is the primary bedroom, complete with a walk-in closet and a private primary bath.
-
2026-03-24$232,990 Active 457-char remark
Show marketing remark (457 chars)
You enter the home and are immediately welcomed into the open family room, kitchen, and dining area-designed for comfortable, connected living. Just off the family room, you'll find access to the two-car garage, a laundry room, and two secondary bedrooms that share a full bath. From the dining area, a covered patio offers space to relax outdoors. Also off the dining space is the primary bedroom, complete with a walk-in closet and a private primary bath.
ⓘ Source: listings_history table (triggers on properties + properties_extension) + one-shot
backfill from property_details.listing_events for pre-trigger history.
Climate risk First Street
- Flood 1/10 Low FEMA zone X (unshaded) · 0% chance over 30 yrs
- Wildfire 6/10 Major
- Heat 8/10 Severe 7 d/yr ≥111°F today · 25 d/yr by 30 yrs out
- Wind 9/10 Extreme 99% chance of damaging wind over 30 yrs
- Air quality 2/10 Low 1 unhealthy d/yr today · 1 by 30 yrs out
Nearby sold comps map
Loading sold comps map…
Walkable amenities ~0.75 mi
Loading nearby amenities…
Taxation est. · year 1
- Rental income
- $23,917
- − Mortgage interest
- −$13,299
- − Property taxes
- −$3,561
- − Insurance
- −$1,187
- − Repairs & maintenance
- −$1,913
- − Management
- −$1,913
- − Depreciation
- −$6,907
- Taxable loss
- −$4,865
- Est. tax savings @ 24.0%
- +$1,168
- After-tax cash flow
- $372/yr
For passive investors: Depreciation is non-cash, so a rental often shows a tax loss while cash-flowing — sheltering income. Rental losses are passive: they offset passive income freely, and up to $25,000/yr can offset ordinary (W-2) income if you actively participate and your MAGI is under $100k (phasing out to $0 by $150k); unused losses carry forward. On sale, claimed depreciation is recaptured at up to 25%, and gains may owe capital-gains tax (a 1031 exchange can defer both). Figures are a year-1 estimate at your 24.0% rate — not tax advice; consult a CPA.
Condition & rehab AI · 6 photos
This home is in excellent condition with a good condition score of 80. It is move-in ready with a cosmetic rehab level, and minor updates such as painting and landscaping can significantly increase its value.
Value-add opportunities
- Both Painting the exterior and interior walls — Fresh paint enhances curb appeal and interior aesthetics.
- Both Landscaping improvements — Enhanced landscaping can increase both resale and rental value.
- Resale Upgrading the kitchen appliances — Modern appliances can attract more buyers and renters.
- Both Adding smart home features — Smart home features can increase both resale and rental value by making the home more appealing and energy-efficient.
Renovation cost estimate screening
Value-add ROI direction
- Both Painting the exterior and interior walls — Fresh paint enhances curb appeal and interior aesthetics. ↑
- Both Landscaping improvements — Enhanced landscaping can increase both resale and rental value. ↑
- Resale Upgrading the kitchen appliances — Modern appliances can attract more buyers and renters. ↑
- Both Adding smart home features — Smart home features can increase both resale and rental value by making the home more appealing and energy-efficient. ↑
ⓘ Cost ranges are severity-bucket heuristics (US national rule-of-thumb). Get contractor quotes + a written scope before underwriting a rehab budget.
Schools (NCES district)
- District
- Conroe ISD
- NCES district ID
- 4815000
- Math proficiency
- 57% ▼ -6.00%
- Reading proficiency
- 57% ▼ -1.00%
- Median HH income
- $71,541
- Composite
- 50.65/100
- National rank
- #1833
- State rank
- #69 of 826 in TX
Livability — Cut and Shoot
- Score
- 56/100
- State rank
- #1326
- US rank
- #22835
Category grades
Schools grade is shown separately in the Schools card above.
Census & demographics
- County
- Montgomery County · 663,713 people
- Metro
- Houston-The Woodlands-Sugar Land, TX
- Population (ZIP)
- 28,854
- Household income
- $75,348
- Rent vs Own
- Severe rent burden
- 464.0
Population outlook (Montgomery County) Hauer SSP2
- Today (2025)
- 713,896 people
- By 2030
- 805,263 · +12.8%
- By 2040
- 992,708 · +39.1%
- By 2050
- 1,179,590 · +65.2%
- By 2075
- 1,628,084 · +128.1%
- By 2100
- 1,937,880 · +171.5%
Race, ethnicity, and origin ACS 2023
- Neighborhood character
- Diverse neighborhood (Simpson 0.56)
- Race & ethnicity
- White 54% Hispanic / Latino 38% Two or more races 17% Black 4%
- Hispanic origin (detail)
- Mexican 25%
- Common ancestry
- Lithuanian 1% Romanian 1% Slovak 1%
- Foreign-born
- 13% · Canada, Jamaica
- Languages at home
- 69% English-only · Spanish 31%
Political lean MEDSL · Montgomery
- 2024 margin
- Solid R (+45.5) · D 26.8% · R 72.3%
- 2008→2024 swing
- +7.2pp toward D · 2008: -52.7pp · 2024: -45.5pp
- All cycles
- 2024: R+45.5 2020: R+43.8 2016: R+51.4 2012: R+60.7 2008: R+52.7
Not yet ingested
- Civics
- —
Market trends
- HPI YoY
- ▼ -77.71%
- Current HPI
- 269.5367
- Rent YoY
- ▼ -0.31%
- Metro
- Houston-The Woodlands-Sugar Land, TX
- State GDP YoY
- ▲ 3.95%
- F500 in state
- 110
Industry mix (Fortune 500 HQ in TX)
| Industry | F500 HQs | Revenue |
|---|---|---|
| Energy | 16 | $1,198B |
|
||
| Technology | 5 | $198B |
|
||
| Engineering / Construction | 4 | $72B |
|
||
| Energy Services | 3 | $60B |
|
||
| Utilities | 3 | $41B |
|
||
| Healthcare | 2 | $330B |
|
||
Price history
+0.4% since first listed2 events — show timeline
- 2026-05-05 Price Changed $233,990 Zillow
- 2026-03-24 Listed $232,990 Zillow
Cash-flow waterfall
monthlySold comps — $/sqft
last 12 mo · ≤1 miLoading sold comps…