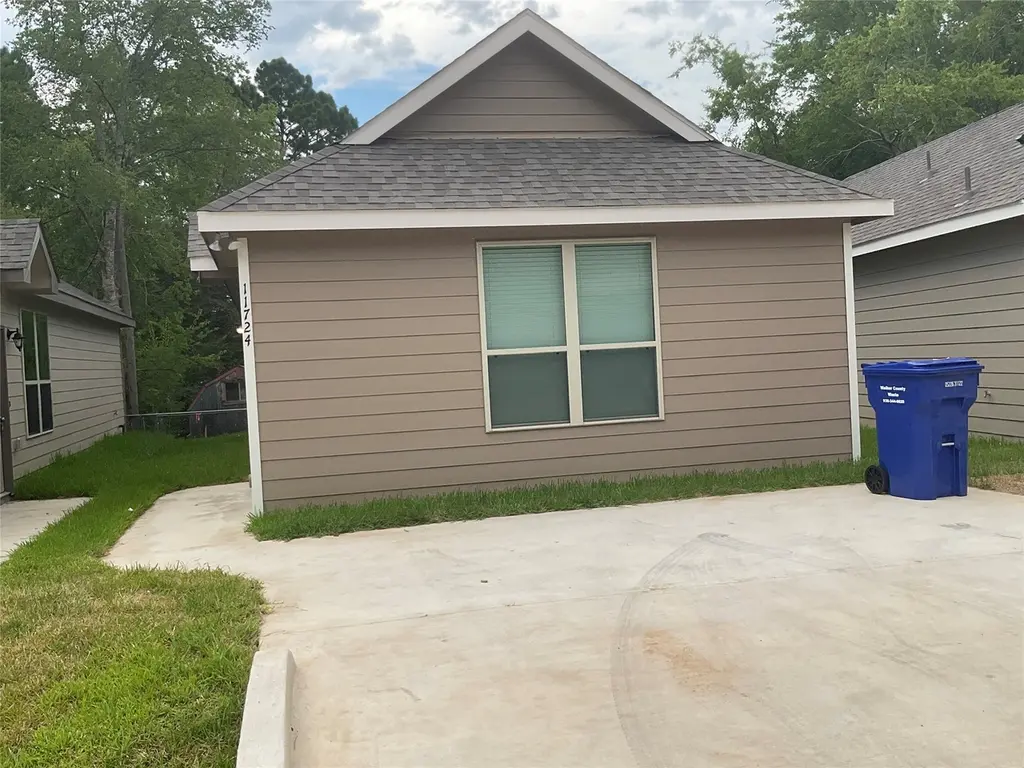
11724 White Cedar St · Willis, TX
Flood risk 1/10 · Minimal
- FEMA flood zone
- X (unshaded)
- Chance of flooding over 30 yrs
- 0.0%
- Est. flood insurance / yr
- $507 – $1,088
Fire risk 4/10 · Minor
- Est. fire insurance / yr
- $1,222 – $2,270
Heat risk 8/10 · Major
- Hot days now (above 111°F)
- 7 days/yr
- Hot days in 30 yrs
- 24 days/yr
Wind risk 8/10 · Major
- Chance of severe wind over 30 yrs
- 99.0%
Air-quality risk 2/10 · Minimal
- Unhealthy air days now
- 1 days/yr
- Unhealthy air days in 30 yrs
- 1 days/yr
Risk factors via First Street. Map © Google.
Why this score? — see what drove the C+ grade
The composite is a weighted blend of 9 inputs, each scored 0–100. Each bar is that input's sub-score; the figure is the points it added to the 100-point composite (weight × sub-score).
- Cash flow +25.0/30.0
- ARV discount +11.7/15.0
- DSCR +8.2/10.0
- 1% rule +7.0/10.0
- Schools +3.2/10.0
- Livability +3.1/5.0
- Condition / age +2.5/5.0
- Rent growth +2.0/5.0
- Appreciation +0.0/10.0
$145,000
🖨 Deal sheet 📄 Offer letter ✓ Due diligence
Listing remarks
Positive cash flowing investment property. Tenant occupied. No showings without an executed contract. Perfect opportunity to purchase a turnkey cash flowing property in a phenomenal area that is experiencing growth. CURRENTLY THIS HOME IS BEING LISTED FOR $1450 IN SEVERAL LOCATIONS IN WALNUT COVE THIS IS A VERY DESIRABLE STREET
Key facts
- 8,694 sq ft lot
- Community pool
- Built 2022
Property features AI
Finance
- Other: Property has additional parcel(s)
- HOA & community: Walnut Cove POA; Quarterly association fee (about $57); Association fee covers clubhouse, common areas and recreation facilities; Community amenities include basketball court, boat ramp, clubhouse, meeting/banquet/party room, picnic area, playground, pickleball, park, pool
Exterior
- Parking: Road access via asphalt and gravel
- Security: Smoke detectors
- Utilities: Public water; Public sewer
- Home design: Residential property; Full ownership; Single-story (all main rooms on the first floor)
- Construction: Cement siding; Composition roof; Slab foundation; Built in 2022
- Exterior features: Subdivision lot; Community pool (association); Smoke detector(s)
Interior
- Kitchen: Dishwasher; Electric oven; Microwave; Oven; Refrigerator; ENERGY STAR qualified appliances
- Bedrooms: Three bedrooms total; Primary bedroom on the first floor; Two additional bedrooms on the first floor (approx. 11x9 each)
- Flooring: Plank flooring; Vinyl flooring
- Bathrooms: Two full bathrooms
- Heating & cooling: Central heating (electric); Central air (electric)
- Interior features: Granite counters; High ceilings; Pantry; Tub with shower; Kitchen/dining combo; Programmable thermostat; Low emissivity windows
- Laundry & utility: Washer hookup; Electric dryer hookup; Washer; Dryer
Neighborhood map
What this means for you Summary
Snapshot
- This is a 3-bed/2.0-bath single-family listed at $145k.
Deal economics
- At list price, monthly cash flow is $317 ($4k/yr) — positive.
- The deal already cash-flows at list — no discount required.
- Meets the 1% rule at list price ($2k rent vs $145k).
- Cap rate 8.9% vs local median 4.7% in Willis — top-decile yield for the area; either an underpriced asset or a hidden risk that comps aren't pricing in. Stress-test before assuming the spread holds.
Location & tenants
- Location reads 62/100 on livability (#933 in TX) — a middle-class / working-renter tenant base. Strengths: cost of living A+, housing A+; Watch: crime C-, employment D+, amenities F.
- Willis ISD (rural): math 33% / reading 40% proficiency, ranked #458 of 826 in TX (top 55%) — families likely to look elsewhere, expect single-tenant / working-renter base with shorter leases.
- Zoned schools: Lynn Lucas Middle (math 23% / reading 32%, grade F, #1,156 of 1,662 statewide, top 71%, 971 students, 74% FRL); Willis H S (math 19% / reading 46%, grade F, #1,029 of 1,632 statewide, top 64%, 2,521 students, 57% FRL).
- Market conditions: Rents soft (-2.1%/yr); 1189 active listings in the ZIP; 9 comparable units currently listed for rent nearby; rentals lingering (median 44d on market — plan ~5-8 weeks vacancy on turnover, expect pricing pressure); 67% of comp listings sitting > 30 days — soft ceiling on asking rent; solid renter incomes; 13,259 units permitted in Montgomery County in 2024 (1,402 in 5+ unit buildings).
Forward outlook
- Local home prices are declining (-3.0%/yr); year-one equity from $1k of loan paydown is wiped out by about $4k of value loss. Plan a longer hold.
- Montgomery County population projected at +65% by 2050 — long-run rental-demand tailwind backs the buy-and-hold thesis.
Negotiation context
- Only 1 days on market — expect competitive offers; lowballing is unlikely to land.
Risks & watch-outs
- Climate carrying-cost: severe wind risk, 99% chance of damaging wind over 30y; extreme-heat days projected 7→24/yr by 2055 (HVAC capex compounding) — expect insurance premiums to compound above CPI over the hold.
Questions for the listing agent
- What does the HOA fee cover, when was the last increase, and are there any pending special assessments or reserve-fund shortfalls?
- Is there a deadline driving the sale (1031 exchange, divorce, estate, relocation)? That informs how much negotiation room exists.
- Schools are D-rated, which usually means shorter tenancies and higher turnover. Who's the typical renter profile here, and what's been the actual vacancy rate?
- What's the average days-on-market for RENTAL listings here right now (not sales)? A rising rental-DOM trend means longer vacancies and softer asking-rent achievability than the comps imply.
- What's the recent tenant-quality profile in this submarket — average credit score on applications, eviction rate, late-payment / NSF rate, and stable-employment percentage? A property-management company in the area should have these aggregated.
- How much new for-sale + rental construction is in the pipeline within 1–3 miles? Heavy new supply typically softens prices + rents 12–24 months out; constrained supply supports both.
Investment metrics
- 1% rule
- 1.20% ✓
- Cap rate
- 8.92%
- Cash-on-cash
- 9.38%
- DSCR
- 1.42
- GRM
- 6.9
CMA / ARV
- ARV (on-the-fly)
- $160,000
- Comps found
- 12
Show comp detail 12 sales within ~0.75 mi
| Address | Dist | Beds/Ba | Sqft | Sold | Price | $/sf | Match |
|---|---|---|---|---|---|---|---|
| 11753 White Cedar St | 0.07mi | 3/2.0 | 1,000 (0%) | 1mo | $159,900 | $160 | 96 |
| 11755 White Cedar St | 0.08mi | 3/2.0 | 1,000 (0%) | 1mo | $159,900 | $160 | 95 |
| 11847 Nelwood St | 0.19mi | 3/2.0 | 1,000 (0%) | 2mo | $159,900 | $160 | 90 |
| 9770 Blackgum Dr | 0.30mi | 3/2.0 | 988 (-1%) | 2mo | $158,000 | $160 | 83 |
| 9775 Black Gum | 0.30mi | 3/2.0 | 1,000 (0%) | 4mo | $154,900 | $155 | 83 |
| 9866 Arbor Oak St | 0.37mi | 3/2.0 | 1,000 (0%) | 1mo | $159,900 | $160 | 82 |
| 9864 Arbor Oak St | 0.37mi | 3/2.0 | 1,000 (0%) | 1mo | $159,900 | $160 | 82 |
| 9868 Arbor Oak St | 0.37mi | 3/2.0 | 1,000 (0%) | 1mo | $159,900 | $160 | 82 |
| 9583 Darkwood St | 0.31mi | 3/2.0 | 1,000 (0%) | 6mo | $159,900 | $160 | 80 |
| 10088 Calendar St | 0.41mi | 3/2.0 | 930 (-7%) | 1mo | $159,900 | $172 | 68 |
| 9563 Darkwood St | 0.27mi | 2/2.5 (-1) | 1,072 (+7%) | 3mo | $159,000 | $148 | 66 |
| 11712 White Cedar St | 0.03mi | 2/1.0 (-1) | 855 (-14%) | 2mo | $145,000 | $170 | 64 |
Match score weights: distance 35% · size 25% · config 20% · recency 20%. Top-matched comps best support the ARV.
Projected returns pro-forma
-3.0% appreciation · 0.0% rent growth · sell at horizon
- IRR
- -5.7%
- Equity multiple
- 0.79×
- Total profit
- $-8,327
- Equity at exit
- $21,620
- IRR
- -0.3%
- Equity multiple
- 0.98×
- Total profit
- $-705
- Equity at exit
- $12,537
Cash invested: $40,600 (down + closing). Projections, not guarantees.
Landlord ↔ Tenant lean methodology
- Overall (STATE)
- 87 Strongly Landlord-Friendly
- State Texas
- 87 Strongly Landlord-Friendly · R+5
- County
- — inherits STATE
- City
- — inherits STATE
ZIP-level market 77318
- Home prices YoY
- -32.7%
- Rents YoY
- -2.1%
- Active inventory
- 1189
- Price-to-rent
- 6.9×
Monthly cashflow live
- Estimated rent
- $1,742 high interval (Pro) →
- Mortgage (P&I)
- −$760
- Tax from tax record
- −$219 /mo · $2,631/yr
- Insurance
- −$60
- HOA
- −$19
- Vacancy / Maint / Mgmt
- −$366
- Net cashflow
- $317
Break-even live
UW: 25.0% down · 7.5% · 30yr · 1.5% tax · 5.0% vac · 8.0% maint · 8.0% mgmt
Financing live
Cash to close
- Down payment
- $36,250
- Closing costs
- $4,350
- Reserves months
- —
- Total cash needed
- —
Loan-product check · same deal, 3 products live
Conventional
25% down · 7.5% · 30yr
- Down + closing
- —
- Monthly P&I
- —
- Monthly cashflow
- —
- DSCR
- —
- Eligible?
- —
Personal DTI + credit; lowest rate.
DSCR
20% down · 8.5% · 30yr
- Down + closing
- —
- Monthly P&I
- —
- Monthly cashflow
- —
- DSCR
- —
- Eligible?
- —
No personal income docs; deal must DSCR.
Hard money
10% down · 12.0% · 12mo
- Down + closing
- —
- Monthly P&I
- —
- Monthly cashflow
- —
- DSCR
- —
- Eligible?
- —
Short-term bridge; refi at stabilization.
Rent comps 9 comps
| Address | Beds | Baths | Sqft | Rent | $/sqft | DOM | Units | Dist |
|---|---|---|---|---|---|---|---|---|
| 11555 Persimmon St Willis, TX | 3.0 | 2.0 | 1000 | $1,495 | $1.50 | 43d | 1 | 0.11mi |
| 11559 Persimmon St Willis, TX | 3.0 | 2.0 | 1000 | $1,490 | $1.49 | 43d | 1 | 0.11mi |
| 11561 Persimmon St Willis, TX | 3.0 | 2.0 | 1000 | $1,530 | $1.53 | 43d | 1 | 0.12mi |
| 9743 Black Gum Willis, TX | 3.0 | 2.0 | 1000 | $1,350 | $1.35 | 2d | 1 | 0.23mi |
| 9745 Black Gum Willis, TX | 3.0 | 2.0 | 1000 | $1,300 | $1.30 | 43d | 1 | 0.23mi |
| 9992 Calendar St Willis, TX | 2.0 | 1.0 | 800 | $1,200 | $1.50 | 43d | 1 | 0.25mi |
| 14190 Green Wing Cir Willis, TX | 3.0 | 2.0 | 1402 | $1,795 | $1.28 | 3d | 1 | 0.86mi |
| 14214 Green Wing Cir Willis, TX | 3.0 | 2.0 | 1200 | $1,950 | $1.62 | 43d | 1 | 0.90mi |
| 14156 Shadow Bay Dr Willis, TX | 3.0 | 2.0 | 1432 | $2,195 | $1.53 | 1d | 1 | 1.39mi |
HOA detail
- Monthly dues
- $19 · $228/yr
Listing history 2 events
-
2026-06-18remarks 329-char remark
-
2026-06-18$145,000 Active 1 DOM
ⓘ Source: listings_history table (triggers on properties + properties_extension) + one-shot
backfill from property_details.listing_events for pre-trigger history.
Tax reassessment forecast TX · Resets to sale price
- Current annual tax
- $2,631 · $219/mo
- Projected year-2 tax
- $2,654 · $221/mo
- Expected delta
- +$22/yr (+$2/mo · 0.9%)
ⓘ Screening estimate from a state-policy table — verify with the county assessor before closing.
Climate risk First Street
- Flood 1/10 Low FEMA zone X (unshaded) · 0% chance over 30 yrs
- Wildfire 4/10 Moderate
- Heat 8/10 Severe 7 d/yr ≥111°F today · 24 d/yr by 30 yrs out
- Wind 8/10 Severe 99% chance of damaging wind over 30 yrs
- Air quality 2/10 Low 1 unhealthy d/yr today · 1 by 30 yrs out
Nearby sold comps map
Loading sold comps map…
Walkable amenities ~0.75 mi
Loading nearby amenities…
Taxation est. · year 1
- Rental income
- $20,908
- − Mortgage interest
- −$8,122
- − Property taxes
- −$2,631
- − Insurance
- −$725
- − Repairs & maintenance
- −$1,673
- − Management
- −$1,673
- − HOA
- −$228
- − Depreciation
- −$4,218
- Taxable income
- $1,638
- Est. tax owed @ 24.0%
- −$393
- After-tax cash flow
- $3,415/yr
For passive investors: Depreciation is non-cash, so a rental often shows a tax loss while cash-flowing — sheltering income. Rental losses are passive: they offset passive income freely, and up to $25,000/yr can offset ordinary (W-2) income if you actively participate and your MAGI is under $100k (phasing out to $0 by $150k); unused losses carry forward. On sale, claimed depreciation is recaptured at up to 25%, and gains may owe capital-gains tax (a 1031 exchange can defer both). Figures are a year-1 estimate at your 24.0% rate — not tax advice; consult a CPA.
Schools (NCES district)
- District
- Willis ISD
- NCES district ID
- 4845900
- Math proficiency
- 33% ▼ -15.00%
- Reading proficiency
- 40% ▼ -2.00%
- Median HH income
- $57,828
- Composite
- 32.32/100
- National rank
- #5746
- State rank
- #458 of 826 in TX
Livability — Willis
- Score
- 62/100
- State rank
- #933
- US rank
- #16579
Category grades
Schools grade is shown separately in the Schools card above.
Census & demographics
- County
- Montgomery County · 663,713 people
- City population
- 38,421
- Metro
- Houston-The Woodlands-Sugar Land, TX
- Population (ZIP)
- 20,792
- Household income
- $92,415
- Rent vs Own
- Severe rent burden
- 279.0
Population outlook (Montgomery County) Hauer SSP2
- Today (2025)
- 713,896 people
- By 2030
- 805,263 · +12.8%
- By 2040
- 992,708 · +39.1%
- By 2050
- 1,179,590 · +65.2%
- By 2075
- 1,628,084 · +128.1%
- By 2100
- 1,937,880 · +171.5%
Race, ethnicity, and origin ACS 2023
- Neighborhood character
- Predominantly White (72%)
- Race & ethnicity
- White 72% Hispanic / Latino 17% Two or more races 14% Black 3%
- Hispanic origin (detail)
- Mexican 12%
- Common ancestry
- Lithuanian 4% Slovak 2% Serbian 2%
- Foreign-born
- 6% · Canada, Jamaica
- Languages at home
- 88% English-only · Spanish 10%
Political lean MEDSL · Montgomery
- 2024 margin
- Solid R (+45.5) · D 26.8% · R 72.3%
- 2008→2024 swing
- +7.2pp toward D · 2008: -52.7pp · 2024: -45.5pp
- All cycles
- 2024: R+45.5 2020: R+43.8 2016: R+51.4 2012: R+60.7 2008: R+52.7
Not yet ingested
- Civics
- —
Market trends
- HPI YoY
- ▼ -114.58%
- Current HPI
- 236.256
- Rent YoY
- ▼ -2.09%
- Metro
- Houston-The Woodlands-Sugar Land, TX
- State GDP YoY
- ▲ 3.95%
- F500 in state
- 110
Industry mix (Fortune 500 HQ in TX)
| Industry | F500 HQs | Revenue |
|---|---|---|
| Energy | 16 | $1,198B |
|
||
| Technology | 5 | $198B |
|
||
| Engineering / Construction | 4 | $72B |
|
||
| Energy Services | 3 | $60B |
|
||
| Utilities | 3 | $41B |
|
||
| Healthcare | 2 | $330B |
|
||
Price history
2 events — show timeline
- 2026-06-17 Listed $145,000 HARMLS
- 2005-12-13 Sold (Public Records) — Public Records
Property tax history
+18.9%/yrLatest (2025): $2,631 · -2.3% YoY. Source: county tax records.
Cash-flow waterfall
monthlySold comps — $/sqft
last 12 mo · ≤1 miLoading sold comps…