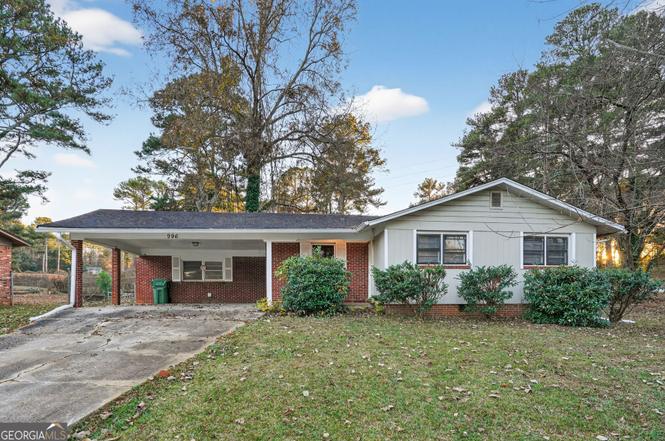
996 Forest Valley Dr SE · Atlanta, GA
Flood risk 1/10 · Minimal
- FEMA flood zone
- X (unshaded)
- Chance of flooding over 30 yrs
- 0.0%
- Est. flood insurance / yr
- $473 – $860
Fire risk 3/10 · Minor
- Est. fire insurance / yr
- $963 – $1,789
Heat risk 5/10 · Moderate
- Hot days now (above 104°F)
- 7 days/yr
- Hot days in 30 yrs
- 17 days/yr
Wind risk 6/10 · Moderate
- Chance of severe wind over 30 yrs
- 27.0%
Air-quality risk 4/10 · Minor
- Unhealthy air days now
- 4 days/yr
- Unhealthy air days in 30 yrs
- 6 days/yr
Risk factors via First Street. Map © Google.
Why this score? — see what drove the D+ grade
The composite is a weighted blend of 9 inputs, each scored 0–100. Each bar is that input's sub-score; the figure is the points it added to the 100-point composite (weight × sub-score).
- ARV discount +13.5/15.0
- Cash flow +13.2/30.0
- Livability +4.2/5.0
- 1% rule +4.1/10.0
- DSCR +4.0/10.0
- Rent growth +3.9/5.0
- Schools +2.7/10.0
- Condition / age +2.5/5.0
- Appreciation +0.0/10.0
$179,900
🖨 Deal sheet (PDF) 📄 Offer letter ✓ Due diligence
Listing remarks
Cozy single story ranch home, with 3 bedrooms, 2 full bathrooms. Living room has a fire place for those chilly nights. Home has great bones, lots of potential to add your touches.
Key facts
- 0.38 acre lot
- 2 parking spots
- Built 1961
Property features AI
Finance
- HOA & community: No homeowners association
Exterior
- Parking: Attached carport for 2 vehicles
- Utilities: Public water; Public sewer; Utilities: Other
- Home design: Single-family house; Residential property; Resale; Built in 1961; One story
- Construction: Slab foundation
- Exterior features: Composition roof; Brick and vinyl siding; Lot features: Other
Interior
- Kitchen: Dishwasher; Refrigerator
- Bedrooms: Three bedrooms on the main level
- Flooring: Carpet; Hardwood; Vinyl
- Bathrooms: Two full bathrooms on the main level
- Heating & cooling: Central heating; Central air; Ceiling fans
- Interior features: One-level living; Family room; Fireplace in the family room; Window treatments
- Laundry & utility: Laundry features: Other
Neighborhood map
What this means for you Summary
Snapshot
- This is a 3-bed/2.0-bath single-family listed at $180k.
Deal economics
- At list price, monthly cash flow is $-4 ($-51/yr) — negative.
- To cash-flow at today's rent, offer at most $179k (0.4% below list).
- To meet the 1% rule (rent ≥ 1% of price), the offer needs to be $164k (8.6% below list).
- Recommended offer: $164k (9.0% below list) — sets the bar for market timing.
- Cap rate 6.3% vs local median 3.1% in Atlanta — top-decile yield for the area; either an underpriced asset or a hidden risk that comps aren't pricing in. Stress-test before assuming the spread holds.
Location & tenants
- Location reads 83/100 on livability (#6 in GA, #919 nationally) — a professional / high-income tenant draw. Strengths: amenities A+, commute A+, housing A+; Watch: cost of living C-.
- Atlanta Public Schools (urban): math 28% / reading 35% proficiency, ranked #80 of 174 in GA (top 46%) — families likely to look elsewhere, expect single-tenant / working-renter base with shorter leases; 71% free/reduced lunch — lower-income household profile, screen leases tightly.
- Zoned schools: Heritage Academy Elementary School (math 5% / reading 8%, grade F, #1,153 of 1,228 statewide, top 94%, 398 students, 100% FRL); Crawford Long Middle School (math 2% / reading 8%, grade F, #462 of 470 statewide, top 99%, 705 students, 100% FRL); South Atlanta High School (math 2% / reading 12%, grade F, #385 of 424 statewide, top 92%, 928 students, 100% FRL) — zoned schools average 100% FRL vs 71% district-wide (29 pts higher); higher-poverty schools than district average — tighter screening recommended.
- Zoned-school proficiency averages 6% at this address vs 32% district-wide (-25 pts) — the specific schools serving this property underperform the Atlanta Public Schools average; the district grade overstates school quality for this exact location.
- Market conditions: Rents rising fast (+5.5%/yr); 179 active listings in the ZIP; 24 comparable units currently listed for rent nearby; rentals at typical pace (median 26d on market — plan ~3-4 weeks tenant-placement turnaround); 11,565 units permitted in Fulton County in 2024 (8,159 in 5+ unit buildings).
- This rent runs 31% of the median local income ($63k/yr) — at the standard rent-burdened threshold; future hikes will face affordability resistance.
Forward outlook
- Local home prices are declining (-3.0%/yr); year-one equity from $1k of loan paydown is wiped out by about $5k of value loss. Plan a longer hold.
- Fulton County population projected at +38% by 2050 — long-run rental-demand tailwind backs the buy-and-hold thesis.
Negotiation context
- It's been on market 111 days — a 9% lower offer ($164k) is reasonable based on typical stale-listing flexibility.
- 6 sale attempts since 18y ago; this cycle's ask has dropped $10k (5%) from the opening price — seller is motivated, your offer sets the floor, not the list.
- Current owner paid $62k; list at $180k implies a 188% gain — meaningful room to come down on a strong offer.
Risks & watch-outs
- Climate carrying-cost: major wind risk, 27% chance of damaging wind over 30y; extreme-heat days projected 7→17/yr by 2055 (HVAC capex compounding) — expect insurance premiums to compound above CPI over the hold.
Questions for the listing agent
- What do current leases actually rent for vs. the listed asking? Can we see a recent rent roll and the last 12 months of T-12 income?
- It's been on market 111 days. Have you received any prior offers? Is the seller open to a 9% concession, seller financing, or rate buy-down credit?
- Built in 1961 — when were the roof, HVAC, electrical panel, plumbing, and water heater last replaced?
- Why hasn't it sold? Are there any deal-killer items the seller is aware of (foundation, flood, title, zoning, code violations)?
- Is there a deadline driving the sale (1031 exchange, divorce, estate, relocation)? That informs how much negotiation room exists.
- The area grade is low — what's the realistic commute time and amenity access for the typical tenant pool here? Any planned neighborhood developments (good or bad) we should know about?
- What's the average days-on-market for RENTAL listings here right now (not sales)? A rising rental-DOM trend means longer vacancies and softer asking-rent achievability than the comps imply.
- What's the recent tenant-quality profile in this submarket — average credit score on applications, eviction rate, late-payment / NSF rate, and stable-employment percentage? A property-management company in the area should have these aggregated.
- How much new for-sale + rental construction is in the pipeline within 1–3 miles? Heavy new supply typically softens prices + rents 12–24 months out; constrained supply supports both.
Investment metrics
- 1% rule
- 0.91% ✗
- Cap rate
- 6.26%
- Cash-on-cash
- -0.10%
- DSCR
- 1.00
- GRM
- 9.1
CMA / ARV
- ARV (on-the-fly)
- $207,320
- Comps found
- 12
Show comp detail 12 sales within ~0.75 mi
| Address | Dist | Beds/Ba | Sqft | Sold | Price | $/sf | Match |
|---|---|---|---|---|---|---|---|
| 996 Forest Valley Dr SE | 0.00mi | 3/2.0 | 1,460 (0%) | 1mo | $170,000 | $116 | 99 |
| 3970 Joanne Ct | 0.43mi | 4/1.5 (+1) | 1,475 (+1%) | 2mo | $150,000 | $102 | 70 |
| 3881 Bonnie Ln SE | 0.24mi | 4/2.0 (+1) | 1,350 (-8%) | 5mo | $192,000 | $142 | 67 |
| 3893 Bonnie Ln SE | 0.25mi | 4/2.0 (+1) | 1,350 (-8%) | 11mo | $230,000 | $170 | 61 |
| 1072 Vincent Dr | 0.51mi | 4/3.0 (+1) | 1,435 (-2%) | 14mo | $244,500 | $170 | 53 |
| 1085 Hendon Rd SE | 0.31mi | 3/2.0 | 1,260 (-14%) | 18mo | $252,000 | $200 | 48 |
| 1035 Little Hampton Ct SE | 0.54mi | 3/2.0 | 1,600 (+10%) | 16mo | $335,000 | $209 | 45 |
| 3575 Pine Forest Dr SE | 0.39mi | 3/1.0 | 1,275 (-13%) | 14mo | $147,000 | $115 | 45 |
| 3489 Pine Forest Dr SE | 0.49mi | 4/2.0 (+1) | 1,617 (+11%) | 13mo | $220,000 | $136 | 43 |
| 1114 Holly Cir | 0.66mi | 3/2.0 | 1,347 (-8%) | 17mo | $161,000 | $120 | 42 |
| 3971 David Dr | 0.40mi | 3/1.0 | 1,274 (-13%) | 18mo | $137,000 | $108 | 41 |
| 3514 Pine Forest Dr SE | 0.51mi | 4/2.0 (+1) | 1,260 (-14%) | 19mo | $215,000 | $171 | 33 |
Match score weights: distance 35% · size 25% · config 20% · recency 20%. Top-matched comps best support the ARV.
Projected returns pro-forma
-3.0% appreciation · 5.45% rent growth · sell at horizon
- IRR
- -13.6%
- Equity multiple
- 0.50×
- Total profit
- $-25,211
- Equity at exit
- $26,824
- IRR
- -1.1%
- Equity multiple
- 0.92×
- Total profit
- $-4,143
- Equity at exit
- $15,554
Cash invested: $50,372 (down + closing). Projections, not guarantees.
Landlord ↔ Tenant lean methodology
- Overall (STATE)
- 90 Strongly Landlord-Friendly
- State Georgia
- 90 Strongly Landlord-Friendly · R+3
- County
- — inherits STATE
- City
- — inherits STATE
ZIP-level market 30354
- Home prices YoY
- -17.5%
- Rents YoY
- 5.5%
- Active inventory
- 179
- Price-to-rent
- 9.1×
Monthly cashflow live
- Estimated rent
- $1,644 high interval (Pro) →
- Mortgage (P&I)
- −$943
- Tax from tax record
- −$284 /mo · $3,413/yr
- Insurance
- −$75
- HOA
- −$0
- Vacancy / Maint / Mgmt
- −$345
- Net cashflow
- $-4
Break-even live
Sensitivity live
| Price | -10% $98 | -5% $47 | +0% $-4 | +5% $-55 | +10% $-106 |
|---|---|---|---|---|---|
| Rent | -10% $-134 | -5% $-69 | +0% $-4 | +5% $61 | +10% $126 |
| Rate | -1.0pp $86 | -0.5pp $41 | base $-4 | +0.5pp $-51 | +1.0pp $-98 |
UW: 25.0% down · 7.5% · 30yr · 1.5% tax · 5.0% vac · 8.0% maint · 8.0% mgmt
Financing live
Cash to close
- Down payment
- $44,975
- Closing costs
- $5,397
- Reserves months
- —
- Total cash needed
- —
Loan-product check · same deal, 3 products live
Conventional
25% down · 7.5% · 30yr
- Down + closing
- —
- Monthly P&I
- —
- Monthly cashflow
- —
- DSCR
- —
- Eligible?
- —
Personal DTI + credit; lowest rate.
DSCR
20% down · 8.5% · 30yr
- Down + closing
- —
- Monthly P&I
- —
- Monthly cashflow
- —
- DSCR
- —
- Eligible?
- —
No personal income docs; deal must DSCR.
Hard money
10% down · 12.0% · 12mo
- Down + closing
- —
- Monthly P&I
- —
- Monthly cashflow
- —
- DSCR
- —
- Eligible?
- —
Short-term bridge; refi at stabilization.
Rent comps 24 comps
| Address | Beds | Baths | Sqft | Rent | $/sqft | DOM | Units | Dist |
|---|---|---|---|---|---|---|---|---|
| 3450 Forrest Park Rd SE Atlanta, GA | 1.0–3.0 | 1.0–2.0 | 1002 | $1,537 | $1.53 | 26d | 11 | 0.55mi |
| 1006 Hutchens Rd SE Atlanta, GA | 3.0 | 2.0 | 881 | $2,800 | $3.18 | 26d | 1 | 0.97mi |
| 729 Blueridge Dr Forest Park, GA | 3.0 | 1.0 | 1150 | $1,505 | $1.31 | 7d | 1 | 1.04mi |
| 4168 Tara Dr Forest Park, GA | 3.0 | 1.0 | 975 | $1,299 | $1.33 | 45d | 1 | 1.10mi |
| 1381 Oakview Cir Forest Park, GA | 3.0 | 1.0 | 1028 | $1,500 | $1.46 | 26d | 1 | 1.18mi |
| 1381 Oakview Cir Forest Park, GA | 3.0 | 1.0 | 1028 | $1,500 | $1.46 | 45d | 1 | 1.18mi |
| 1131 Stoneybrook Rd Forest Park, GA | 3.0 | 1.0 | 1053 | $3,400 | $3.23 | 45d | 1 | 1.25mi |
| 3080 Forrest Park Rd SE Atlanta, GA | 3.0 | 2.0 | 1828 | $1,950 | $1.07 | 26d | 1 | 1.26mi |
| 4309 Gilbert Pl Forest Park, GA | 4.0 | 2.0 | 1660 | $1,981 | $1.19 | 6d | 1 | 1.28mi |
| 4241 Hendrix Dr Forest Park, GA | 2.0 | 1.5 | 1050 | $1,224 | $1.17 | 3d | 5 | 1.33mi |
| 1540 Greenwillow Dr Conley, GA | 4.0 | 2.0 | 1564 | $1,895 | $1.21 | 26d | 1 | 1.34mi |
| 837 Forrest Cir SE Atlanta, GA | 3.0 | 2.0 | 1500 | $1,845 | $1.23 | 26d | 1 | 1.37mi |
| 4404 Currie Ct Forest Park, GA | 3.0 | 2.0 | 1188 | $1,595 | $1.34 | 45d | 1 | 1.37mi |
| 575 Springwood Dr Forest Park, GA | 2.0 | 1.0 | 1100 | $1,550 | $1.41 | 45d | 1 | 1.39mi |
| 382 Cologne Dr SE Atlanta, GA | 3.0 | 1.0 | 1100 | $1,400 | $1.27 | 0d | 1 | 1.41mi |
| 633 Sandys Ln SE Atlanta, GA | 3.0 | 2.0 | 1314 | $1,950 | $1.48 | 7d | 1 | 1.44mi |
| 331 Simca St SE Atlanta, GA | 3.0 | 1.0 | 1000 | $1,700 | $1.70 | 4d | 1 | 1.45mi |
| 4522 Ridge Dr Forest Park, GA | 3.0 | 2.0 | 1176 | $1,450 | $1.23 | 6d | 1 | 1.45mi |
| 573 Evergreen Ter Unit 2 Forest Park, GA | 2.0 | 1.0 | 900 | $1,150 | $1.28 | 46d | 1 | 1.46mi |
| 1409 Rock Cut Rd Forest Park, GA | 1.0–2.0 | 1.0 | 875 | $1,100 | $1.26 | 45d | 1 | 1.49mi |
| 1409 Rock Cut Rd Forest Park, GA | 2.0 | 1.0 | 960 | $900 | $0.94 | 12d | 1 | 1.49mi |
| 1409 Rock Cut Rd Forest Park, GA | 2.0 | 1.0 | 960 | $900 | $0.94 | 3d | 1 | 1.50mi |
| 1409 Rock Cut Rd Forest Park, GA | 2.0 | 1.0 | 960 | $900 | $0.94 | 0d | 1 | 1.50mi |
| 4548 Pine Dr Forest Park, GA | 3.0 | 1.0 | 963 | $1,250 | $1.30 | 14d | 1 | 1.50mi |
Listing history 23 events
-
2026-05-12status Under Contract
-
2026-03-20price $179,900
-
2026-02-24price $184,900
-
2026-01-21$189,900 New
-
2025-12-31historical
-
2025-10-02price $190,900
-
2025-09-24price $197,900
-
2025-09-13price $202,900
-
2025-08-26$209,900 New
-
2014-02-19historical
-
2014-02-18historical
-
2013-11-15price $63,900 Reduced
-
2013-11-15price $63,900
-
2013-08-30$69,900 New
-
2013-08-30$69,900 Active
-
2012-05-01historical
-
2012-01-21$19,900 New
-
2011-10-23price $19,900
-
2008-05-01soldstatus $62,500
-
2008-02-26$67,000
-
2007-06-22soldstatus $68,000
-
2004-10-11soldstatus $85,000
-
1977-06-16soldstatus $28,000
ⓘ Source: listings_history table (triggers on properties + properties_extension) + one-shot
backfill from property_details.listing_events for pre-trigger history.
Tax reassessment forecast GA · Resets to sale price
- Current annual tax
- $3,413 · $284/mo
- Projected year-2 tax
- $3,413 · $284/mo
- Expected delta
- $0/yr ($0/mo · 0.0%)
ⓘ Screening estimate from a state-policy table — verify with the county assessor before closing.
Climate risk First Street
- Flood 1/10 Low FEMA zone X (unshaded) · 0% chance over 30 yrs
- Wildfire 3/10 Moderate
- Heat 5/10 Major 7 d/yr ≥104°F today · 17 d/yr by 30 yrs out
- Wind 6/10 Major 27% chance of damaging wind over 30 yrs
- Air quality 4/10 Moderate 4 unhealthy d/yr today · 6 by 30 yrs out
Nearby sold comps map
Loading sold comps map…
Walkable amenities ~0.75 mi
Loading nearby amenities…
Taxation est. · year 1
- Rental income
- $19,725
- − Mortgage interest
- −$10,077
- − Property taxes
- −$3,413
- − Insurance
- −$900
- − Repairs & maintenance
- −$1,578
- − Management
- −$1,578
- − Depreciation
- −$5,233
- Taxable loss
- −$3,055
- Est. tax savings @ 24.0%
- +$733
- After-tax cash flow
- $682/yr
For passive investors: Depreciation is non-cash, so a rental often shows a tax loss while cash-flowing — sheltering income. Rental losses are passive: they offset passive income freely, and up to $25,000/yr can offset ordinary (W-2) income if you actively participate and your MAGI is under $100k (phasing out to $0 by $150k); unused losses carry forward. On sale, claimed depreciation is recaptured at up to 25%, and gains may owe capital-gains tax (a 1031 exchange can defer both). Figures are a year-1 estimate at your 24.0% rate — not tax advice; consult a CPA.
Schools (NCES district)
- District
- Atlanta Public Schools
- NCES district ID
- 1300120
- Math proficiency
- 28% ▼ -6.00%
- Reading proficiency
- 35% ▼ -2.00%
- Median HH income
- $48,306
- Composite
- 27.27/100
- National rank
- #7006
- State rank
- #80 of 174 in GA
Livability — Atlanta
- Score
- 83/100
- State rank
- #6
- US rank
- #919
Category grades
Schools grade is shown separately in the Schools card above.
Census & demographics
- Census place
- Atlanta, GA
- County
- Fulton County · 1,094,430 people
- City population
- 629,525
- Metro
- Atlanta-Sandy Springs-Alpharetta, GA
- Population (ZIP)
- 16,182
- Household income
- $63,189
- Rent vs Own
- Severe rent burden
- 930.0
Population outlook (Fulton County) Hauer SSP2
- Today (2025)
- 1,203,707 people
- By 2030
- 1,299,706 · +8.0%
- By 2040
- 1,488,256 · +23.6%
- By 2050
- 1,664,580 · +38.3%
- By 2075
- 2,036,072 · +69.2%
- By 2100
- 2,222,402 · +84.6%
Race, ethnicity, and origin ACS 2023
- Neighborhood character
- Predominantly Black (68%)
- Race & ethnicity
- Black 68% Hispanic / Latino 16% White 10% Two or more races 9% Native American 2% Asian 1%
- Hispanic origin (detail)
- Mexican 13%
- Common ancestry
- Italian 2% Romanian 1% Swedish 1%
- Foreign-born
- 11% · Canada, Vietnam, Guatemala
- Languages at home
- 81% English-only · Spanish 15% German/W. Germanic 1% Vietnamese 1%
Political lean MEDSL · Fulton
- 2024 margin
- Solid D (+44.9) · D 71.9% · R 27.0% · Other 1.1%
- 2008→2024 swing
- +9.8pp toward D · 2008: 35.0pp · 2024: 44.9pp
- All cycles
- 2024: D+44.9 2020: D+46.4 2016: D+42.1 2012: D+29.6 2008: D+35.0
Not yet ingested
- Civics
- —
Market trends
- HPI YoY
- ▼ -67.78%
- Current HPI
- 320.1111
- Rent YoY
- ▲ 5.45%
- Metro
- Atlanta-Sandy Springs-Alpharetta, GA
- State GDP YoY
- ▲ 2.66%
- F500 in state
- 28
Industry mix (Fortune 500 HQ in GA)
| Industry | F500 HQs | Revenue |
|---|---|---|
| Paper / Packaging | 2 | $29B |
|
||
| Retail | 1 | $160B |
|
||
| Transportation / Logistics | 1 | $91B |
|
||
| Airlines | 1 | $62B |
|
||
| Consumer Goods | 1 | $47B |
|
||
| Utilities | 1 | $25B |
|
||
Price history
+542.5% since first listed23 events — show timeline
- 2026-05-12 Pending — GAMLS
- 2026-03-20 Price Changed $179,900 GAMLS
- 2026-02-24 Price Changed $184,900 GAMLS
- 2026-01-21 Listed $189,900 GAMLS
- 2025-12-31 Listing Removed — GAMLS
- 2025-10-02 Price Changed $190,900 GAMLS
- 2025-09-24 Price Changed $197,900 GAMLS
- 2025-09-13 Price Changed $202,900 GAMLS
- 2025-08-26 Listed $209,900 GAMLS
- 2014-02-19 Listing Removed — FMLS
- 2014-02-18 Listing Removed — GAMLS
- 2013-11-15 Price Changed $63,900 GAMLS
- 2013-11-15 Price Changed $63,900 FMLS
- 2013-08-30 Listed $69,900 GAMLS
- 2013-08-30 Listed $69,900 FMLS
- 2012-05-01 Listing Removed — GAMLS
- 2012-01-21 Listed $19,900 GAMLS
- 2011-10-23 Price Changed $19,900 GAMLS
- 2008-05-01 Sold (MLS) $62,500 FMLS
- 2008-02-26 Listed $67,000 FMLS
- 2007-06-22 Sold (Public Records) $68,000 Public Records
- 2004-10-11 Sold (Public Records) $85,000 Public Records
- 1977-06-16 Sold (Public Records) $28,000 Public Records
Property tax history
+4.3%/yrLatest (2025): $3,413 · -2.3% YoY. Source: county tax records.
Cash-flow waterfall
monthlySold comps — $/sqft
last 12 mo · ≤1 miLoading sold comps…